You are viewing a plain text version of this content. The canonical link for it is here.
Posted to commits@iotdb.apache.org by ro...@apache.org on 2022/04/19 09:34:41 UTC
[iotdb] branch rel/0.13 updated: [IOTDB-2873] Apache IoTDB Dashboard: Grafana Metrics Template (#5586)
This is an automated email from the ASF dual-hosted git repository.
rong pushed a commit to branch rel/0.13
in repository https://gitbox.apache.org/repos/asf/iotdb.git
The following commit(s) were added to refs/heads/rel/0.13 by this push:
new 06af1317ff [IOTDB-2873] Apache IoTDB Dashboard: Grafana Metrics Template (#5586)
06af1317ff is described below
commit 06af1317ffefd0a923be950902246fdf80e2de20
Author: ZhangHongYin <46...@users.noreply.github.com>
AuthorDate: Tue Apr 19 17:34:36 2022 +0800
[IOTDB-2873] Apache IoTDB Dashboard: Grafana Metrics Template (#5586)
---
distribution/src/assembly/all.xml | 4 +
distribution/src/assembly/server.xml | 4 +
docs/UserGuide/Maintenance-Tools/Metric-Tool.md | 12 +-
docs/zh/UserGuide/Maintenance-Tools/Metric-Tool.md | 12 +-
.../Apache IoTDB Dashboard v0.13.1.json | 1527 ++++++++++++++++++++
5 files changed, 1553 insertions(+), 6 deletions(-)
diff --git a/distribution/src/assembly/all.xml b/distribution/src/assembly/all.xml
index 098b0df9f3..dcd04e93ad 100644
--- a/distribution/src/assembly/all.xml
+++ b/distribution/src/assembly/all.xml
@@ -55,6 +55,10 @@
<outputDirectory>conf</outputDirectory>
<directory>${maven.multiModuleProjectDirectory}/metrics/interface/src/main/assembly/resources/conf</directory>
</fileSet>
+ <fileSet>
+ <outputDirectory>grafana-metrics-example</outputDirectory>
+ <directory>${maven.multiModuleProjectDirectory}/grafana-metrics-example</directory>
+ </fileSet>
<fileSet>
<outputDirectory>sbin</outputDirectory>
<directory>${maven.multiModuleProjectDirectory}/server/src/assembly/resources/sbin</directory>
diff --git a/distribution/src/assembly/server.xml b/distribution/src/assembly/server.xml
index 2946ebb637..adbeb5c90f 100644
--- a/distribution/src/assembly/server.xml
+++ b/distribution/src/assembly/server.xml
@@ -46,6 +46,10 @@
<outputDirectory>conf</outputDirectory>
<directory>${maven.multiModuleProjectDirectory}/metrics/interface/src/main/assembly/resources/conf</directory>
</fileSet>
+ <fileSet>
+ <outputDirectory>grafana-metrics-example</outputDirectory>
+ <directory>${maven.multiModuleProjectDirectory}/grafana-metrics-example</directory>
+ </fileSet>
<fileSet>
<outputDirectory>sbin</outputDirectory>
<directory>${maven.multiModuleProjectDirectory}/server/src/assembly/resources/sbin</directory>
diff --git a/docs/UserGuide/Maintenance-Tools/Metric-Tool.md b/docs/UserGuide/Maintenance-Tools/Metric-Tool.md
index 83150b1b40..e656f79437 100644
--- a/docs/UserGuide/Maintenance-Tools/Metric-Tool.md
+++ b/docs/UserGuide/Maintenance-Tools/Metric-Tool.md
@@ -327,8 +327,14 @@ The following documents may help you have a good journey with Prometheus and Gra
[Grafana query metrics from Prometheus](https://prometheus.io/docs/visualization/grafana/#grafana-support-for-prometheus)
-Here are two demo pictures of IoTDB's metrics data in Grafana.
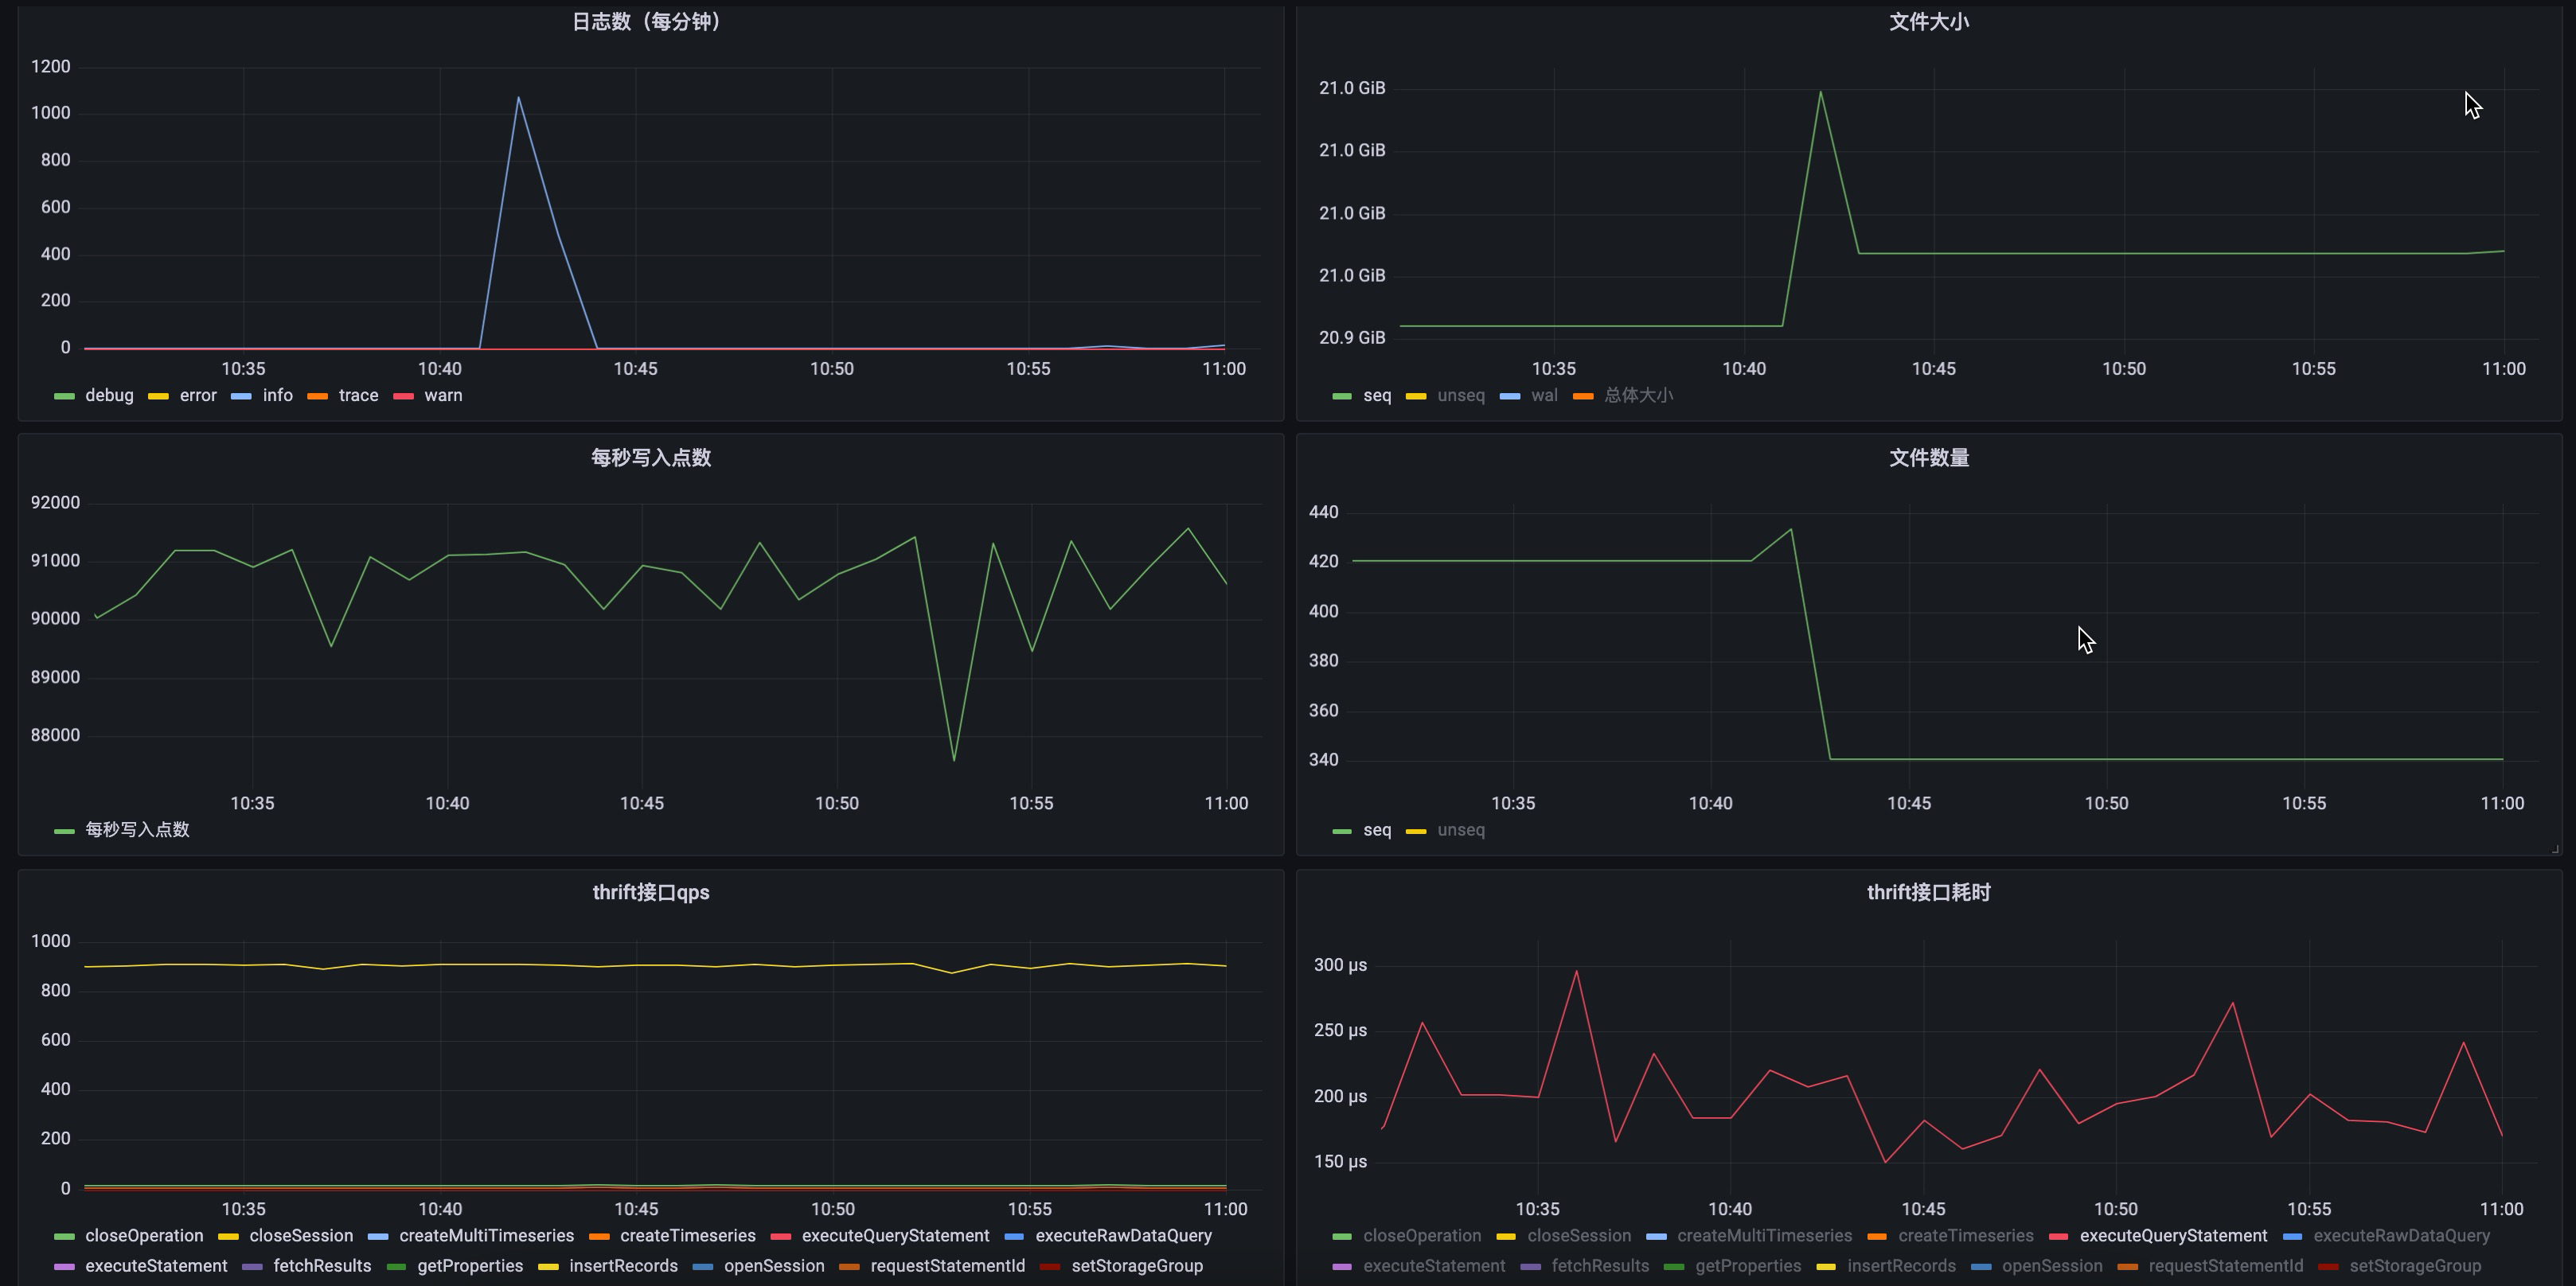
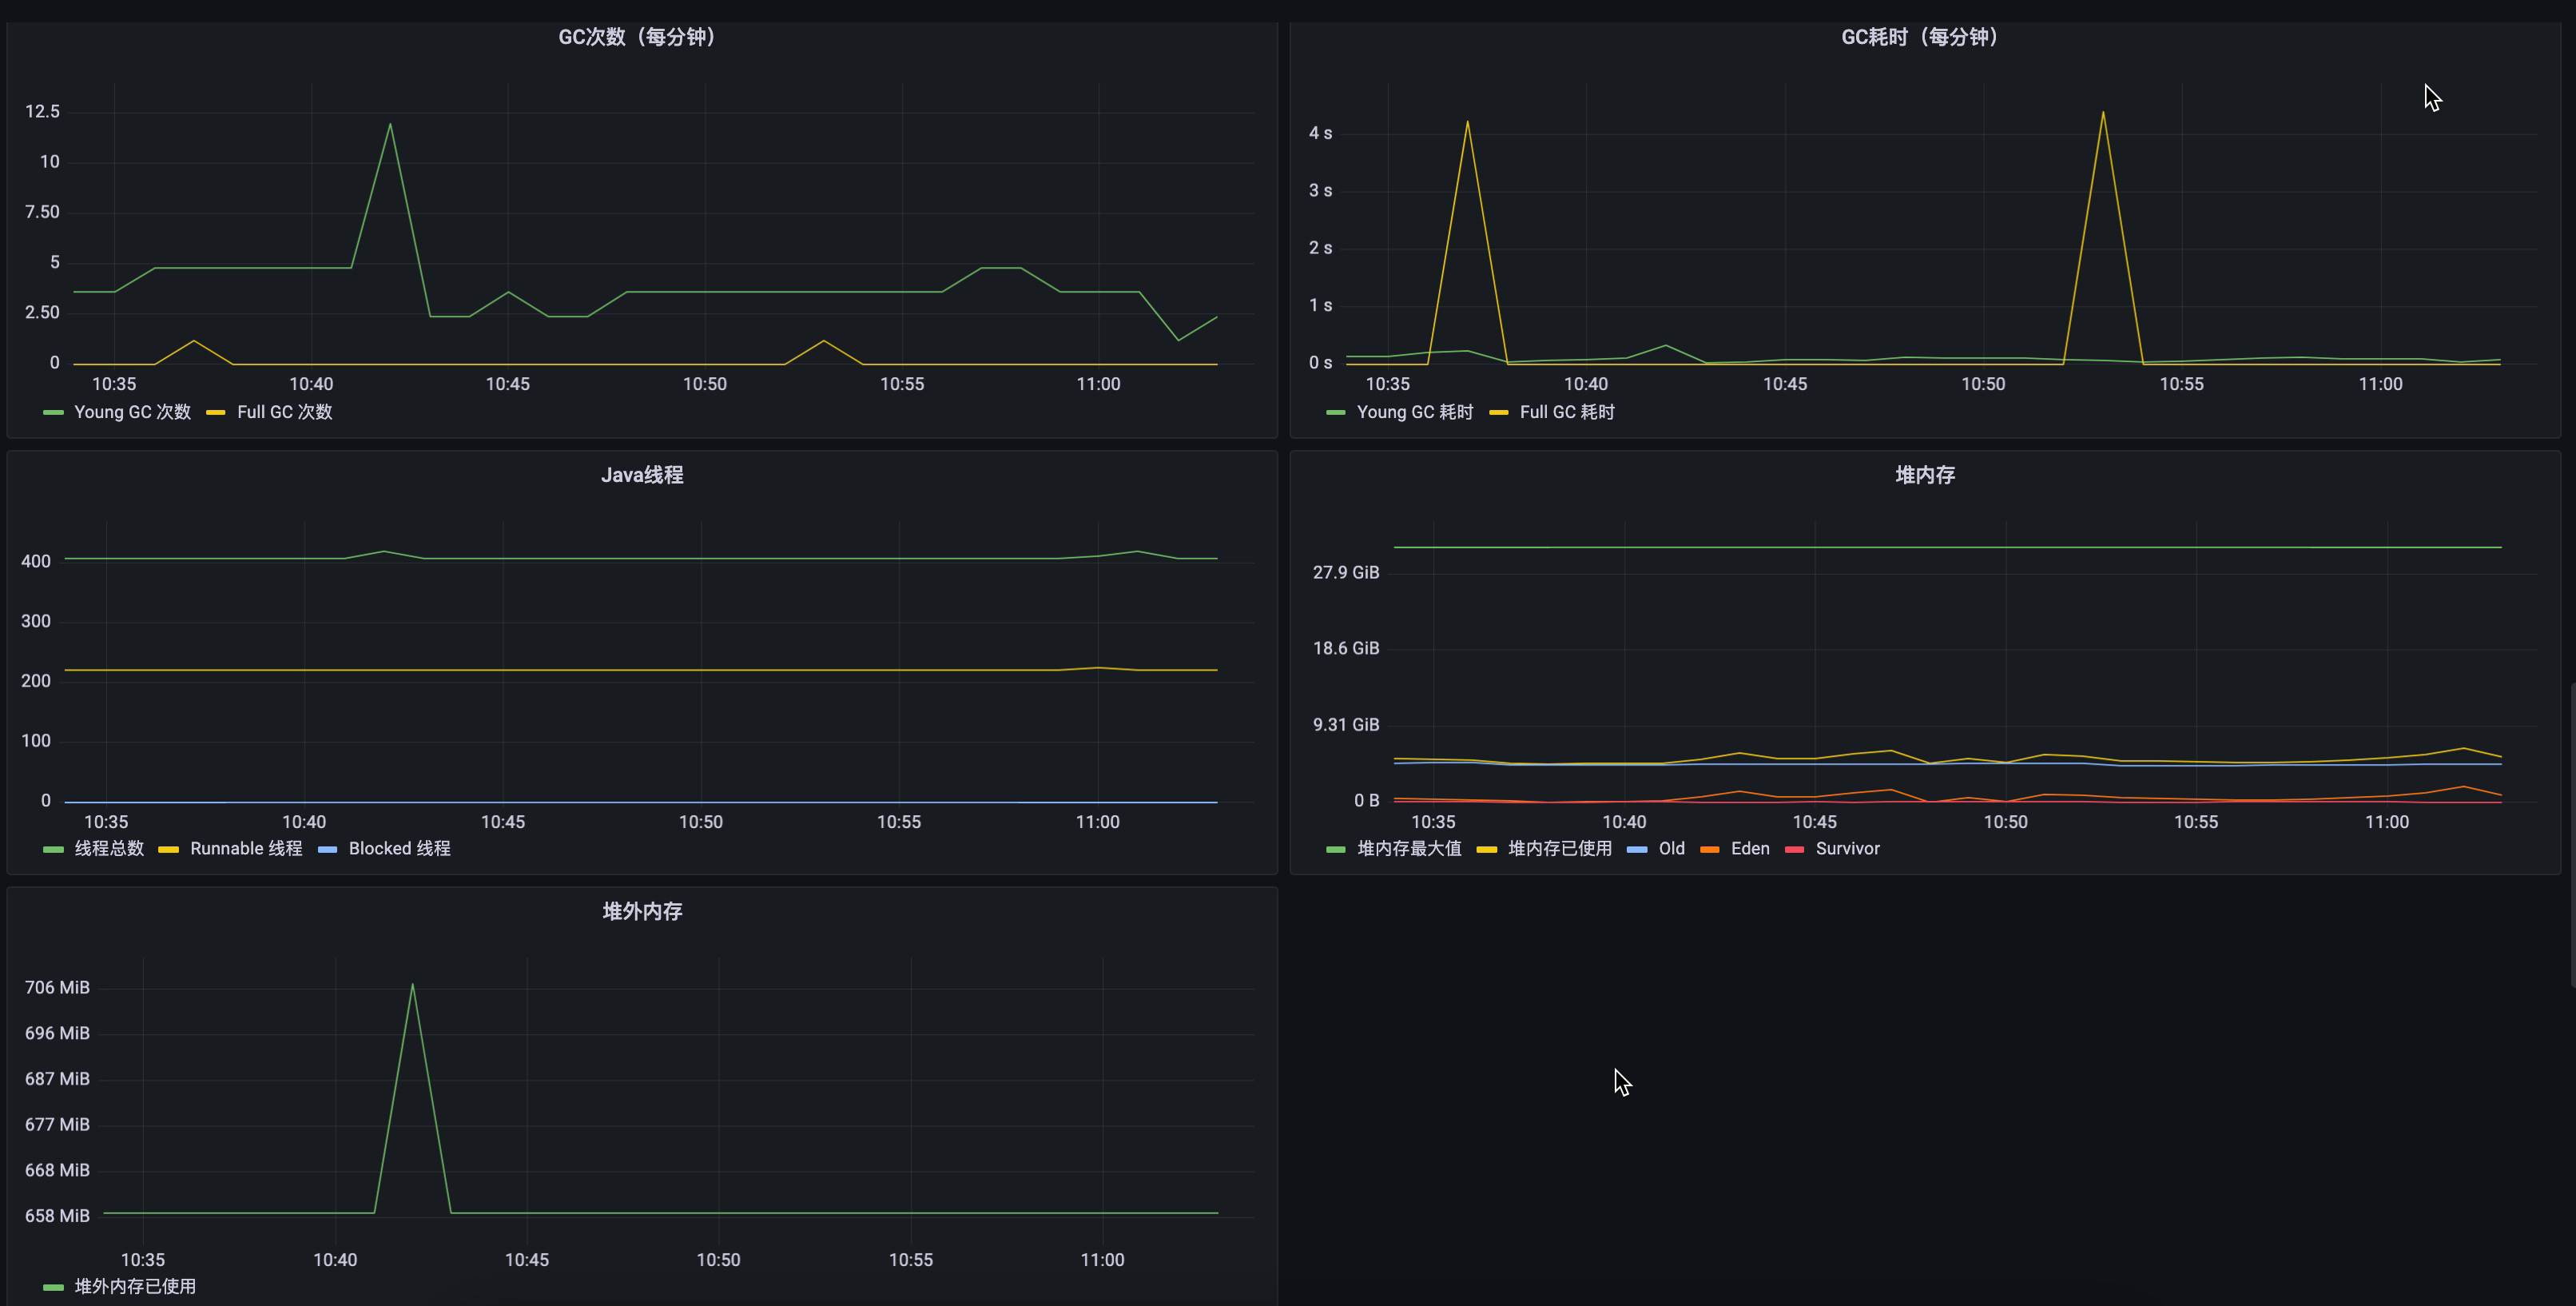
+### 5.3. Apache IoTDB Dashboard
+We provide the Apache IoTDB Dashboard, and the rendering shown in Grafana is as follows:
-
+
-
\ No newline at end of file
+How to get Apache IoTDB Dashboard:
+
+1. You can obtain the json files of Dashboards corresponding to different iotdb versions in the grafana-metrics-example folder.
+2. You can visit [Grafana Dashboard official website](https://grafana.com/grafana/dashboards/), search for `Apache IoTDB Dashboard` and use
+
+When creating Grafana, you can select the json file you just downloaded to `Import` and select the corresponding target data source for Apache IoTDB Dashboard.
\ No newline at end of file
diff --git a/docs/zh/UserGuide/Maintenance-Tools/Metric-Tool.md b/docs/zh/UserGuide/Maintenance-Tools/Metric-Tool.md
index 5d78d90e63..d73769b211 100644
--- a/docs/zh/UserGuide/Maintenance-Tools/Metric-Tool.md
+++ b/docs/zh/UserGuide/Maintenance-Tools/Metric-Tool.md
@@ -328,8 +328,14 @@ static_configs:
[Grafana从Prometheus查询数据并绘图的文档](https://prometheus.io/docs/visualization/grafana/#grafana-support-for-prometheus)
-最后是IoTDB的metrics数据在Grafana中显示的效果图:
+### 5.3. Apache IoTDB Dashboard
+我们提供了Apache IoTDB Dashboard,在Grafana中显示的效果图如下所示:
-
+
-
\ No newline at end of file
+Apache IoTDB Dashboard的获取方式:
+
+1. 您可以在grafana-metrics-example文件夹下获取到对应不同iotdb版本的Dashboard的json文件。
+2. 您可以访问[Grafana Dashboard官网](https://grafana.com/grafana/dashboards/)搜索`Apache IoTDB Dashboard`并使用
+
+在创建Grafana时,您可以选择Import刚刚下载的json文件,并为Apache IoTDB Dashboard选择对应目标数据源。
diff --git a/grafana-metrics-example/Apache IoTDB Dashboard v0.13.1.json b/grafana-metrics-example/Apache IoTDB Dashboard v0.13.1.json
new file mode 100644
index 0000000000..0c531954d4
--- /dev/null
+++ b/grafana-metrics-example/Apache IoTDB Dashboard v0.13.1.json
@@ -0,0 +1,1527 @@
+{
+ "__inputs": [
+ {
+ "name": "DS_PROMETHEUS",
+ "label": "Prometheus",
+ "description": "",
+ "type": "datasource",
+ "pluginId": "prometheus",
+ "pluginName": "Prometheus"
+ }
+ ],
+ "__elements": [],
+ "__requires": [
+ {
+ "type": "grafana",
+ "id": "grafana",
+ "name": "Grafana",
+ "version": "8.4.2"
+ },
+ {
+ "type": "datasource",
+ "id": "prometheus",
+ "name": "Prometheus",
+ "version": "1.0.0"
+ },
+ {
+ "type": "panel",
+ "id": "timeseries",
+ "name": "Time series",
+ "version": ""
+ }
+ ],
+ "annotations": {
+ "list": [
+ {
+ "builtIn": 1,
+ "datasource": "-- Grafana --",
+ "enable": true,
+ "hide": true,
+ "iconColor": "rgba(0, 211, 255, 1)",
+ "name": "Annotations & Alerts",
+ "target": {
+ "limit": 100,
+ "matchAny": false,
+ "tags": [],
+ "type": "dashboard"
+ },
+ "type": "dashboard"
+ }
+ ]
+ },
+ "description": "",
+ "editable": true,
+ "fiscalYearStartMonth": 0,
+ "graphTooltip": 0,
+ "id": null,
+ "iteration": 1650335659041,
+ "links": [],
+ "liveNow": false,
+ "panels": [
+ {
+ "collapsed": false,
+ "gridPos": {
+ "h": 1,
+ "w": 24,
+ "x": 0,
+ "y": 0
+ },
+ "id": 38,
+ "panels": [],
+ "title": "Overview",
+ "type": "row"
+ },
+ {
+ "fieldConfig": {
+ "defaults": {
+ "color": {
+ "mode": "palette-classic"
+ },
+ "custom": {
+ "axisLabel": "",
+ "axisPlacement": "auto",
+ "barAlignment": 0,
+ "drawStyle": "line",
+ "fillOpacity": 0,
+ "gradientMode": "none",
+ "hideFrom": {
+ "legend": false,
+ "tooltip": false,
+ "viz": false
+ },
+ "lineInterpolation": "linear",
+ "lineWidth": 1,
+ "pointSize": 5,
+ "scaleDistribution": {
+ "type": "linear"
+ },
+ "showPoints": "auto",
+ "spanNulls": false,
+ "stacking": {
+ "group": "A",
+ "mode": "none"
+ },
+ "thresholdsStyle": {
+ "mode": "off"
+ }
+ },
+ "mappings": [],
+ "thresholds": {
+ "mode": "absolute",
+ "steps": [
+ {
+ "color": "green",
+ "value": null
+ }
+ ]
+ }
+ },
+ "overrides": []
+ },
+ "gridPos": {
+ "h": 8,
+ "w": 12,
+ "x": 0,
+ "y": 1
+ },
+ "id": 36,
+ "options": {
+ "legend": {
+ "calcs": [],
+ "displayMode": "list",
+ "placement": "bottom"
+ },
+ "tooltip": {
+ "mode": "single",
+ "sort": "none"
+ }
+ },
+ "targets": [
+ {
+ "datasource": {
+ "type": "prometheus",
+ "uid": "${DS_PROMETHEUS}"
+ },
+ "exemplar": true,
+ "expr": "quantity{instance=~\"$instance\"}",
+ "interval": "",
+ "legendFormat": "{{name}} number",
+ "refId": "A"
+ }
+ ],
+ "title": "The number of entity",
+ "type": "timeseries"
+ },
+ {
+ "fieldConfig": {
+ "defaults": {
+ "color": {
+ "mode": "palette-classic"
+ },
+ "custom": {
+ "axisLabel": "",
+ "axisPlacement": "auto",
+ "barAlignment": 0,
+ "drawStyle": "line",
+ "fillOpacity": 0,
+ "gradientMode": "none",
+ "hideFrom": {
+ "legend": false,
+ "tooltip": false,
+ "viz": false
+ },
+ "lineInterpolation": "linear",
+ "lineWidth": 1,
+ "pointSize": 5,
+ "scaleDistribution": {
+ "type": "linear"
+ },
+ "showPoints": "auto",
+ "spanNulls": false,
+ "stacking": {
+ "group": "A",
+ "mode": "none"
+ },
+ "thresholdsStyle": {
+ "mode": "off"
+ }
+ },
+ "mappings": [],
+ "thresholds": {
+ "mode": "absolute",
+ "steps": [
+ {
+ "color": "green",
+ "value": null
+ }
+ ]
+ }
+ },
+ "overrides": []
+ },
+ "gridPos": {
+ "h": 8,
+ "w": 12,
+ "x": 12,
+ "y": 1
+ },
+ "id": 34,
+ "options": {
+ "legend": {
+ "calcs": [],
+ "displayMode": "list",
+ "placement": "bottom"
+ },
+ "tooltip": {
+ "mode": "single",
+ "sort": "none"
+ }
+ },
+ "targets": [
+ {
+ "datasource": {
+ "type": "prometheus",
+ "uid": "${DS_PROMETHEUS}"
+ },
+ "exemplar": true,
+ "expr": "rate(quantity_total{instance=~\"$instance\"}[1m])",
+ "interval": "1m",
+ "legendFormat": "write point per minute",
+ "refId": "A"
+ }
+ ],
+ "title": "write point per minute",
+ "type": "timeseries"
+ },
+ {
+ "fieldConfig": {
+ "defaults": {
+ "color": {
+ "mode": "palette-classic"
+ },
+ "custom": {
+ "axisLabel": "",
+ "axisPlacement": "auto",
+ "barAlignment": 0,
+ "drawStyle": "line",
+ "fillOpacity": 0,
+ "gradientMode": "none",
+ "hideFrom": {
+ "legend": false,
+ "tooltip": false,
+ "viz": false
+ },
+ "lineInterpolation": "linear",
+ "lineWidth": 1,
+ "pointSize": 5,
+ "scaleDistribution": {
+ "type": "linear"
+ },
+ "showPoints": "auto",
+ "spanNulls": false,
+ "stacking": {
+ "group": "A",
+ "mode": "none"
+ },
+ "thresholdsStyle": {
+ "mode": "off"
+ }
+ },
+ "mappings": [],
+ "thresholds": {
+ "mode": "absolute",
+ "steps": [
+ {
+ "color": "green",
+ "value": null
+ }
+ ]
+ },
+ "unit": "bytes"
+ },
+ "overrides": []
+ },
+ "gridPos": {
+ "h": 8,
+ "w": 12,
+ "x": 0,
+ "y": 9
+ },
+ "id": 32,
+ "options": {
+ "legend": {
+ "calcs": [],
+ "displayMode": "list",
+ "placement": "bottom"
+ },
+ "tooltip": {
+ "mode": "single",
+ "sort": "none"
+ }
+ },
+ "targets": [
+ {
+ "datasource": {
+ "type": "prometheus",
+ "uid": "${DS_PROMETHEUS}"
+ },
+ "exemplar": true,
+ "expr": "mem{instance=~\"$instance\"}",
+ "interval": "1m",
+ "legendFormat": "{{name}}",
+ "refId": "A"
+ }
+ ],
+ "title": "storage group used memory",
+ "type": "timeseries"
+ },
+ {
+ "collapsed": false,
+ "gridPos": {
+ "h": 1,
+ "w": 24,
+ "x": 0,
+ "y": 17
+ },
+ "id": 30,
+ "panels": [],
+ "title": "Interface",
+ "type": "row"
+ },
+ {
+ "fieldConfig": {
+ "defaults": {
+ "color": {
+ "mode": "palette-classic"
+ },
+ "custom": {
+ "axisLabel": "",
+ "axisPlacement": "auto",
+ "barAlignment": 0,
+ "drawStyle": "line",
+ "fillOpacity": 0,
+ "gradientMode": "none",
+ "hideFrom": {
+ "legend": false,
+ "tooltip": false,
+ "viz": false
+ },
+ "lineInterpolation": "linear",
+ "lineWidth": 1,
+ "pointSize": 5,
+ "scaleDistribution": {
+ "type": "linear"
+ },
+ "showPoints": "auto",
+ "spanNulls": false,
+ "stacking": {
+ "group": "A",
+ "mode": "none"
+ },
+ "thresholdsStyle": {
+ "mode": "off"
+ }
+ },
+ "mappings": [],
+ "thresholds": {
+ "mode": "absolute",
+ "steps": [
+ {
+ "color": "green",
+ "value": null
+ }
+ ]
+ }
+ },
+ "overrides": []
+ },
+ "gridPos": {
+ "h": 8,
+ "w": 12,
+ "x": 0,
+ "y": 18
+ },
+ "id": 24,
+ "options": {
+ "legend": {
+ "calcs": [],
+ "displayMode": "list",
+ "placement": "bottom"
+ },
+ "tooltip": {
+ "mode": "single",
+ "sort": "none"
+ }
+ },
+ "targets": [
+ {
+ "datasource": {
+ "type": "prometheus",
+ "uid": "${DS_PROMETHEUS}"
+ },
+ "exemplar": true,
+ "expr": "rate(entry_seconds_count{instance=~\"$instance\"}[1m])",
+ "interval": "1m",
+ "legendFormat": "{{instance}}-{{name}}",
+ "refId": "A"
+ }
+ ],
+ "title": "The QPS of interface",
+ "type": "timeseries"
+ },
+ {
+ "fieldConfig": {
+ "defaults": {
+ "color": {
+ "mode": "palette-classic"
+ },
+ "custom": {
+ "axisLabel": "",
+ "axisPlacement": "auto",
+ "barAlignment": 0,
+ "drawStyle": "line",
+ "fillOpacity": 0,
+ "gradientMode": "none",
+ "hideFrom": {
+ "legend": false,
+ "tooltip": false,
+ "viz": false
+ },
+ "lineInterpolation": "linear",
+ "lineWidth": 1,
+ "pointSize": 5,
+ "scaleDistribution": {
+ "type": "linear"
+ },
+ "showPoints": "auto",
+ "spanNulls": false,
+ "stacking": {
+ "group": "A",
+ "mode": "none"
+ },
+ "thresholdsStyle": {
+ "mode": "off"
+ }
+ },
+ "mappings": [],
+ "thresholds": {
+ "mode": "absolute",
+ "steps": [
+ {
+ "color": "green",
+ "value": null
+ },
+ {
+ "color": "red",
+ "value": 80
+ }
+ ]
+ },
+ "unit": "s"
+ },
+ "overrides": []
+ },
+ "gridPos": {
+ "h": 8,
+ "w": 12,
+ "x": 12,
+ "y": 18
+ },
+ "id": 26,
+ "options": {
+ "legend": {
+ "calcs": [],
+ "displayMode": "list",
+ "placement": "bottom"
+ },
+ "tooltip": {
+ "mode": "single",
+ "sort": "none"
+ }
+ },
+ "targets": [
+ {
+ "datasource": {
+ "type": "prometheus",
+ "uid": "${DS_PROMETHEUS}"
+ },
+ "exemplar": true,
+ "expr": "avg(rate(entry_seconds_sum{}[1m])/rate(entry_seconds_count{}[1m])) by (name,instance)",
+ "interval": "1m",
+ "legendFormat": "{{instance}}-{{name}}",
+ "refId": "A"
+ }
+ ],
+ "title": "The time consumed of interface",
+ "type": "timeseries"
+ },
+ {
+ "fieldConfig": {
+ "defaults": {
+ "color": {
+ "mode": "palette-classic"
+ },
+ "custom": {
+ "axisLabel": "",
+ "axisPlacement": "auto",
+ "barAlignment": 0,
+ "drawStyle": "line",
+ "fillOpacity": 0,
+ "gradientMode": "none",
+ "hideFrom": {
+ "legend": false,
+ "tooltip": false,
+ "viz": false
+ },
+ "lineInterpolation": "linear",
+ "lineWidth": 1,
+ "pointSize": 5,
+ "scaleDistribution": {
+ "type": "linear"
+ },
+ "showPoints": "auto",
+ "spanNulls": false,
+ "stacking": {
+ "group": "A",
+ "mode": "none"
+ },
+ "thresholdsStyle": {
+ "mode": "off"
+ }
+ },
+ "mappings": [],
+ "thresholds": {
+ "mode": "absolute",
+ "steps": [
+ {
+ "color": "green",
+ "value": null
+ }
+ ]
+ },
+ "unit": "percent"
+ },
+ "overrides": []
+ },
+ "gridPos": {
+ "h": 8,
+ "w": 12,
+ "x": 0,
+ "y": 26
+ },
+ "id": 28,
+ "options": {
+ "legend": {
+ "calcs": [],
+ "displayMode": "list",
+ "placement": "bottom"
+ },
+ "tooltip": {
+ "mode": "single",
+ "sort": "none"
+ }
+ },
+ "targets": [
+ {
+ "datasource": {
+ "type": "prometheus",
+ "uid": "${DS_PROMETHEUS}"
+ },
+ "exemplar": true,
+ "expr": "cache_hit",
+ "interval": "",
+ "legendFormat": "{{name}}",
+ "refId": "A"
+ }
+ ],
+ "title": "Cache hit rate",
+ "type": "timeseries"
+ },
+ {
+ "collapsed": false,
+ "gridPos": {
+ "h": 1,
+ "w": 24,
+ "x": 0,
+ "y": 34
+ },
+ "id": 22,
+ "panels": [],
+ "title": "Engine",
+ "type": "row"
+ },
+ {
+ "fieldConfig": {
+ "defaults": {
+ "color": {
+ "mode": "palette-classic"
+ },
+ "custom": {
+ "axisLabel": "",
+ "axisPlacement": "auto",
+ "barAlignment": 0,
+ "drawStyle": "line",
+ "fillOpacity": 0,
+ "gradientMode": "none",
+ "hideFrom": {
+ "legend": false,
+ "tooltip": false,
+ "viz": false
+ },
+ "lineInterpolation": "linear",
+ "lineWidth": 1,
+ "pointSize": 5,
+ "scaleDistribution": {
+ "type": "linear"
+ },
+ "showPoints": "auto",
+ "spanNulls": false,
+ "stacking": {
+ "group": "A",
+ "mode": "none"
+ },
+ "thresholdsStyle": {
+ "mode": "off"
+ }
+ },
+ "mappings": [],
+ "thresholds": {
+ "mode": "absolute",
+ "steps": [
+ {
+ "color": "green",
+ "value": null
+ },
+ {
+ "color": "red",
+ "value": 80
+ }
+ ]
+ }
+ },
+ "overrides": []
+ },
+ "gridPos": {
+ "h": 8,
+ "w": 12,
+ "x": 0,
+ "y": 35
+ },
+ "id": 18,
+ "options": {
+ "legend": {
+ "calcs": [],
+ "displayMode": "list",
+ "placement": "bottom"
+ },
+ "tooltip": {
+ "mode": "single",
+ "sort": "none"
+ }
+ },
+ "targets": [
+ {
+ "datasource": {
+ "type": "prometheus",
+ "uid": "${DS_PROMETHEUS}"
+ },
+ "exemplar": true,
+ "expr": "queue{instance=~\"$instance\"}",
+ "interval": "1m",
+ "legendFormat": "{{name}}-{{status}}",
+ "refId": "A"
+ }
+ ],
+ "title": "Task number(pending and active)",
+ "type": "timeseries"
+ },
+ {
+ "fieldConfig": {
+ "defaults": {
+ "color": {
+ "mode": "palette-classic"
+ },
+ "custom": {
+ "axisLabel": "",
+ "axisPlacement": "auto",
+ "barAlignment": 0,
+ "drawStyle": "line",
+ "fillOpacity": 0,
+ "gradientMode": "none",
+ "hideFrom": {
+ "legend": false,
+ "tooltip": false,
+ "viz": false
+ },
+ "lineInterpolation": "linear",
+ "lineWidth": 1,
+ "pointSize": 5,
+ "scaleDistribution": {
+ "type": "linear"
+ },
+ "showPoints": "auto",
+ "spanNulls": false,
+ "stacking": {
+ "group": "A",
+ "mode": "none"
+ },
+ "thresholdsStyle": {
+ "mode": "off"
+ }
+ },
+ "mappings": [],
+ "thresholds": {
+ "mode": "absolute",
+ "steps": [
+ {
+ "color": "green",
+ "value": null
+ }
+ ]
+ },
+ "unit": "s"
+ },
+ "overrides": []
+ },
+ "gridPos": {
+ "h": 8,
+ "w": 12,
+ "x": 12,
+ "y": 35
+ },
+ "id": 20,
+ "options": {
+ "legend": {
+ "calcs": [],
+ "displayMode": "list",
+ "placement": "bottom"
+ },
+ "tooltip": {
+ "mode": "single",
+ "sort": "none"
+ }
+ },
+ "targets": [
+ {
+ "datasource": {
+ "type": "prometheus",
+ "uid": "${DS_PROMETHEUS}"
+ },
+ "exemplar": true,
+ "expr": "rate(cost_task_seconds_sum{instance=~\"$instance\"}[10m])/rate(cost_task_seconds_count{instance=~\"$instance\"}[10m])",
+ "interval": "1m",
+ "legendFormat": "{{instance}}-{{name}}",
+ "refId": "A"
+ }
+ ],
+ "title": "The time consumed of task(pending and active)",
+ "type": "timeseries"
+ },
+ {
+ "collapsed": false,
+ "gridPos": {
+ "h": 1,
+ "w": 24,
+ "x": 0,
+ "y": 43
+ },
+ "id": 16,
+ "panels": [],
+ "title": "System",
+ "type": "row"
+ },
+ {
+ "fieldConfig": {
+ "defaults": {
+ "color": {
+ "mode": "palette-classic"
+ },
+ "custom": {
+ "axisLabel": "",
+ "axisPlacement": "auto",
+ "barAlignment": 0,
+ "drawStyle": "line",
+ "fillOpacity": 0,
+ "gradientMode": "none",
+ "hideFrom": {
+ "legend": false,
+ "tooltip": false,
+ "viz": false
+ },
+ "lineInterpolation": "linear",
+ "lineWidth": 1,
+ "pointSize": 5,
+ "scaleDistribution": {
+ "type": "linear"
+ },
+ "showPoints": "auto",
+ "spanNulls": false,
+ "stacking": {
+ "group": "A",
+ "mode": "none"
+ },
+ "thresholdsStyle": {
+ "mode": "off"
+ }
+ },
+ "mappings": [],
+ "thresholds": {
+ "mode": "absolute",
+ "steps": [
+ {
+ "color": "green",
+ "value": null
+ }
+ ]
+ },
+ "unit": "bytes"
+ },
+ "overrides": []
+ },
+ "gridPos": {
+ "h": 8,
+ "w": 12,
+ "x": 0,
+ "y": 44
+ },
+ "id": 12,
+ "options": {
+ "legend": {
+ "calcs": [],
+ "displayMode": "list",
+ "placement": "bottom"
+ },
+ "tooltip": {
+ "mode": "single",
+ "sort": "none"
+ }
+ },
+ "targets": [
+ {
+ "datasource": {
+ "type": "prometheus",
+ "uid": "${DS_PROMETHEUS}"
+ },
+ "exemplar": true,
+ "expr": "file_size{instance=~\"$instance\"}",
+ "interval": "1m",
+ "legendFormat": "{{instance}}-{{name}}",
+ "refId": "A"
+ },
+ {
+ "datasource": {
+ "type": "prometheus",
+ "uid": "${DS_PROMETHEUS}"
+ },
+ "exemplar": true,
+ "expr": "sum(file_size{instance=~\"$instance\"})",
+ "hide": false,
+ "interval": "1m",
+ "legendFormat": "total size of file",
+ "refId": "B"
+ }
+ ],
+ "title": "The size of file",
+ "type": "timeseries"
+ },
+ {
+ "fieldConfig": {
+ "defaults": {
+ "color": {
+ "mode": "palette-classic"
+ },
+ "custom": {
+ "axisLabel": "",
+ "axisPlacement": "auto",
+ "barAlignment": 0,
+ "drawStyle": "line",
+ "fillOpacity": 0,
+ "gradientMode": "none",
+ "hideFrom": {
+ "legend": false,
+ "tooltip": false,
+ "viz": false
+ },
+ "lineInterpolation": "linear",
+ "lineWidth": 1,
+ "pointSize": 5,
+ "scaleDistribution": {
+ "type": "linear"
+ },
+ "showPoints": "auto",
+ "spanNulls": false,
+ "stacking": {
+ "group": "A",
+ "mode": "none"
+ },
+ "thresholdsStyle": {
+ "mode": "off"
+ }
+ },
+ "mappings": [],
+ "thresholds": {
+ "mode": "absolute",
+ "steps": [
+ {
+ "color": "green",
+ "value": null
+ }
+ ]
+ }
+ },
+ "overrides": []
+ },
+ "gridPos": {
+ "h": 8,
+ "w": 12,
+ "x": 12,
+ "y": 44
+ },
+ "id": 14,
+ "options": {
+ "legend": {
+ "calcs": [],
+ "displayMode": "list",
+ "placement": "bottom"
+ },
+ "tooltip": {
+ "mode": "single",
+ "sort": "none"
+ }
+ },
+ "targets": [
+ {
+ "datasource": {
+ "type": "prometheus",
+ "uid": "${DS_PROMETHEUS}"
+ },
+ "exemplar": true,
+ "expr": "file_count{instance=~\"$instance\"}",
+ "interval": "",
+ "legendFormat": "{{name}}",
+ "refId": "A"
+ },
+ {
+ "datasource": {
+ "type": "prometheus",
+ "uid": "${DS_PROMETHEUS}"
+ },
+ "exemplar": true,
+ "expr": "sum(file_count{instance=~\"$instance\"})",
+ "hide": false,
+ "interval": "",
+ "legendFormat": "total number of file",
+ "refId": "B"
+ }
+ ],
+ "title": "The number of file",
+ "type": "timeseries"
+ },
+ {
+ "fieldConfig": {
+ "defaults": {
+ "color": {
+ "mode": "palette-classic"
+ },
+ "custom": {
+ "axisLabel": "",
+ "axisPlacement": "auto",
+ "barAlignment": 0,
+ "drawStyle": "line",
+ "fillOpacity": 0,
+ "gradientMode": "none",
+ "hideFrom": {
+ "legend": false,
+ "tooltip": false,
+ "viz": false
+ },
+ "lineInterpolation": "linear",
+ "lineWidth": 1,
+ "pointSize": 5,
+ "scaleDistribution": {
+ "type": "linear"
+ },
+ "showPoints": "auto",
+ "spanNulls": false,
+ "stacking": {
+ "group": "A",
+ "mode": "none"
+ },
+ "thresholdsStyle": {
+ "mode": "off"
+ }
+ },
+ "mappings": [],
+ "thresholds": {
+ "mode": "absolute",
+ "steps": [
+ {
+ "color": "green",
+ "value": null
+ }
+ ]
+ }
+ },
+ "overrides": []
+ },
+ "gridPos": {
+ "h": 8,
+ "w": 12,
+ "x": 0,
+ "y": 52
+ },
+ "id": 10,
+ "options": {
+ "legend": {
+ "calcs": [],
+ "displayMode": "list",
+ "placement": "bottom"
+ },
+ "tooltip": {
+ "mode": "single",
+ "sort": "none"
+ }
+ },
+ "targets": [
+ {
+ "datasource": {
+ "type": "prometheus",
+ "uid": "${DS_PROMETHEUS}"
+ },
+ "exemplar": true,
+ "expr": "sum(rate(jvm_gc_pause_seconds_count{instance=~\"$instance\", action=\"end of minor GC\"}[1m]))*60",
+ "interval": "1m",
+ "legendFormat": "Young GC number",
+ "refId": "A"
+ },
+ {
+ "datasource": {
+ "type": "prometheus",
+ "uid": "${DS_PROMETHEUS}"
+ },
+ "exemplar": true,
+ "expr": "sum(rate(jvm_gc_pause_seconds_count{instance=~\"$instance\", action=\"end of major GC\"}[1m]))*60",
+ "hide": false,
+ "interval": "1m",
+ "legendFormat": "Full GC number",
+ "refId": "B"
+ }
+ ],
+ "title": "The number of GC (per minute)",
+ "type": "timeseries"
+ },
+ {
+ "fieldConfig": {
+ "defaults": {
+ "color": {
+ "mode": "palette-classic"
+ },
+ "custom": {
+ "axisLabel": "",
+ "axisPlacement": "auto",
+ "barAlignment": 0,
+ "drawStyle": "line",
+ "fillOpacity": 0,
+ "gradientMode": "none",
+ "hideFrom": {
+ "legend": false,
+ "tooltip": false,
+ "viz": false
+ },
+ "lineInterpolation": "linear",
+ "lineWidth": 1,
+ "pointSize": 5,
+ "scaleDistribution": {
+ "type": "linear"
+ },
+ "showPoints": "auto",
+ "spanNulls": false,
+ "stacking": {
+ "group": "A",
+ "mode": "none"
+ },
+ "thresholdsStyle": {
+ "mode": "off"
+ }
+ },
+ "mappings": [],
+ "thresholds": {
+ "mode": "absolute",
+ "steps": [
+ {
+ "color": "green",
+ "value": null
+ }
+ ]
+ },
+ "unit": "s"
+ },
+ "overrides": []
+ },
+ "gridPos": {
+ "h": 8,
+ "w": 12,
+ "x": 12,
+ "y": 52
+ },
+ "id": 8,
+ "options": {
+ "legend": {
+ "calcs": [],
+ "displayMode": "list",
+ "placement": "bottom"
+ },
+ "tooltip": {
+ "mode": "single",
+ "sort": "none"
+ }
+ },
+ "targets": [
+ {
+ "datasource": {
+ "type": "prometheus",
+ "uid": "${DS_PROMETHEUS}"
+ },
+ "exemplar": true,
+ "expr": "sum(rate(jvm_gc_pause_seconds_sum{instance=~\"$instance\", action=\"end of minor GC\"}[1m]))*60",
+ "interval": "1m",
+ "legendFormat": "The time of young GC",
+ "refId": "A"
+ },
+ {
+ "datasource": {
+ "type": "prometheus",
+ "uid": "${DS_PROMETHEUS}"
+ },
+ "exemplar": true,
+ "expr": "sum(rate(jvm_gc_pause_seconds_sum{instance=~\"$instance\", action=\"end of major GC\"}[1m]))*60",
+ "hide": false,
+ "interval": "1m",
+ "legendFormat": "The time of full GC",
+ "refId": "B"
+ }
+ ],
+ "title": "The time consumed of GC(per minute)",
+ "type": "timeseries"
+ },
+ {
+ "fieldConfig": {
+ "defaults": {
+ "color": {
+ "mode": "palette-classic"
+ },
+ "custom": {
+ "axisLabel": "",
+ "axisPlacement": "auto",
+ "barAlignment": 0,
+ "drawStyle": "line",
+ "fillOpacity": 0,
+ "gradientMode": "none",
+ "hideFrom": {
+ "legend": false,
+ "tooltip": false,
+ "viz": false
+ },
+ "lineInterpolation": "linear",
+ "lineWidth": 1,
+ "pointSize": 5,
+ "scaleDistribution": {
+ "type": "linear"
+ },
+ "showPoints": "auto",
+ "spanNulls": false,
+ "stacking": {
+ "group": "A",
+ "mode": "none"
+ },
+ "thresholdsStyle": {
+ "mode": "off"
+ }
+ },
+ "mappings": [],
+ "thresholds": {
+ "mode": "absolute",
+ "steps": [
+ {
+ "color": "green",
+ "value": null
+ }
+ ]
+ },
+ "unit": "bytes"
+ },
+ "overrides": []
+ },
+ "gridPos": {
+ "h": 8,
+ "w": 12,
+ "x": 0,
+ "y": 60
+ },
+ "id": 6,
+ "options": {
+ "legend": {
+ "calcs": [],
+ "displayMode": "list",
+ "placement": "bottom"
+ },
+ "tooltip": {
+ "mode": "single",
+ "sort": "none"
+ }
+ },
+ "targets": [
+ {
+ "datasource": {
+ "type": "prometheus",
+ "uid": "${DS_PROMETHEUS}"
+ },
+ "exemplar": true,
+ "expr": "sum(jvm_memory_max_bytes{instance=~\"$instance\",area=\"heap\"})",
+ "interval": "1m",
+ "legendFormat": "Maximum heap memory",
+ "refId": "A"
+ },
+ {
+ "datasource": {
+ "type": "prometheus",
+ "uid": "${DS_PROMETHEUS}"
+ },
+ "exemplar": true,
+ "expr": "sum(jvm_memory_used_bytes{instance=~\"$instance\",area=\"heap\"})",
+ "hide": false,
+ "interval": "1m",
+ "legendFormat": "Used heap memory",
+ "refId": "B"
+ },
+ {
+ "datasource": {
+ "type": "prometheus",
+ "uid": "${DS_PROMETHEUS}"
+ },
+ "exemplar": true,
+ "expr": "jvm_memory_used_bytes{instance=~\"$instance\",area=\"heap\",id=\"PS Old Gen\"}",
+ "hide": false,
+ "interval": "1m",
+ "legendFormat": "Old area",
+ "refId": "C"
+ },
+ {
+ "datasource": {
+ "type": "prometheus",
+ "uid": "${DS_PROMETHEUS}"
+ },
+ "exemplar": true,
+ "expr": "jvm_memory_used_bytes{instance=~\"$instance\",area=\"heap\",id=\"PS Eden Space\"}",
+ "hide": false,
+ "interval": "1m",
+ "legendFormat": "Eden area",
+ "refId": "D"
+ },
+ {
+ "datasource": {
+ "type": "prometheus",
+ "uid": "${DS_PROMETHEUS}"
+ },
+ "exemplar": true,
+ "expr": "jvm_memory_used_bytes{instance=~\"$instance\",area=\"heap\",id=\"PS Survivor Space\"}",
+ "hide": false,
+ "interval": "1m",
+ "legendFormat": "Survivor area",
+ "refId": "E"
+ }
+ ],
+ "title": "Heap Memory",
+ "type": "timeseries"
+ },
+ {
+ "fieldConfig": {
+ "defaults": {
+ "color": {
+ "mode": "palette-classic"
+ },
+ "custom": {
+ "axisLabel": "",
+ "axisPlacement": "auto",
+ "barAlignment": 0,
+ "drawStyle": "line",
+ "fillOpacity": 0,
+ "gradientMode": "none",
+ "hideFrom": {
+ "legend": false,
+ "tooltip": false,
+ "viz": false
+ },
+ "lineInterpolation": "linear",
+ "lineWidth": 1,
+ "pointSize": 5,
+ "scaleDistribution": {
+ "type": "linear"
+ },
+ "showPoints": "auto",
+ "spanNulls": false,
+ "stacking": {
+ "group": "A",
+ "mode": "none"
+ },
+ "thresholdsStyle": {
+ "mode": "off"
+ }
+ },
+ "mappings": [],
+ "thresholds": {
+ "mode": "absolute",
+ "steps": [
+ {
+ "color": "green",
+ "value": null
+ }
+ ]
+ },
+ "unit": "bytes"
+ },
+ "overrides": []
+ },
+ "gridPos": {
+ "h": 8,
+ "w": 12,
+ "x": 12,
+ "y": 60
+ },
+ "id": 4,
+ "options": {
+ "legend": {
+ "calcs": [],
+ "displayMode": "list",
+ "placement": "bottom"
+ },
+ "tooltip": {
+ "mode": "single",
+ "sort": "none"
+ }
+ },
+ "targets": [
+ {
+ "datasource": {
+ "type": "prometheus",
+ "uid": "${DS_PROMETHEUS}"
+ },
+ "exemplar": true,
+ "expr": "sum(jvm_buffer_memory_used_bytes{instance=~\"$instance\"})",
+ "interval": "1m",
+ "legendFormat": "off-heap memory",
+ "refId": "A"
+ }
+ ],
+ "title": "Off-heap Memory",
+ "type": "timeseries"
+ },
+ {
+ "fieldConfig": {
+ "defaults": {
+ "color": {
+ "mode": "palette-classic"
+ },
+ "custom": {
+ "axisLabel": "",
+ "axisPlacement": "auto",
+ "barAlignment": 0,
+ "drawStyle": "line",
+ "fillOpacity": 0,
+ "gradientMode": "none",
+ "hideFrom": {
+ "legend": false,
+ "tooltip": false,
+ "viz": false
+ },
+ "lineInterpolation": "linear",
+ "lineWidth": 1,
+ "pointSize": 5,
+ "scaleDistribution": {
+ "type": "linear"
+ },
+ "showPoints": "auto",
+ "spanNulls": false,
+ "stacking": {
+ "group": "A",
+ "mode": "none"
+ },
+ "thresholdsStyle": {
+ "mode": "off"
+ }
+ },
+ "mappings": [],
+ "thresholds": {
+ "mode": "absolute",
+ "steps": [
+ {
+ "color": "green",
+ "value": null
+ }
+ ]
+ }
+ },
+ "overrides": []
+ },
+ "gridPos": {
+ "h": 8,
+ "w": 12,
+ "x": 0,
+ "y": 68
+ },
+ "id": 2,
+ "options": {
+ "legend": {
+ "calcs": [],
+ "displayMode": "list",
+ "placement": "bottom"
+ },
+ "tooltip": {
+ "mode": "single",
+ "sort": "none"
+ }
+ },
+ "targets": [
+ {
+ "datasource": {
+ "type": "prometheus",
+ "uid": "${DS_PROMETHEUS}"
+ },
+ "exemplar": true,
+ "expr": "jvm_threads_live_threads{instance=~\"$instance\"}",
+ "interval": "1m",
+ "legendFormat": "The total number of jvm thread",
+ "refId": "A"
+ },
+ {
+ "datasource": {
+ "type": "prometheus",
+ "uid": "${DS_PROMETHEUS}"
+ },
+ "exemplar": true,
+ "expr": "jvm_threads_states_threads{instance=~\"$instance\"}",
+ "hide": false,
+ "interval": "1m",
+ "legendFormat": "{{state}}",
+ "refId": "B"
+ }
+ ],
+ "title": "The number of Java thread",
+ "type": "timeseries"
+ }
+ ],
+ "refresh": false,
+ "schemaVersion": 35,
+ "style": "dark",
+ "tags": [
+ "Apache-IoTDB",
+ "v0.13.1"
+ ],
+ "templating": {
+ "list": [
+ {
+ "current": {},
+ "datasource": {
+ "type": "prometheus",
+ "uid": "${DS_PROMETHEUS}"
+ },
+ "definition": "label_values(job)",
+ "hide": 0,
+ "includeAll": false,
+ "multi": false,
+ "name": "job",
+ "options": [],
+ "query": {
+ "query": "label_values(job)",
+ "refId": "StandardVariableQuery"
+ },
+ "refresh": 1,
+ "regex": "",
+ "skipUrlSync": false,
+ "sort": 0,
+ "type": "query"
+ },
+ {
+ "current": {},
+ "datasource": {
+ "type": "prometheus",
+ "uid": "${DS_PROMETHEUS}"
+ },
+ "definition": "label_values(up{job=~\"$job\"},instance)",
+ "hide": 0,
+ "includeAll": false,
+ "multi": false,
+ "name": "instance",
+ "options": [],
+ "query": {
+ "query": "label_values(up{job=~\"$job\"},instance)",
+ "refId": "StandardVariableQuery"
+ },
+ "refresh": 1,
+ "regex": "",
+ "skipUrlSync": false,
+ "sort": 0,
+ "type": "query"
+ }
+ ]
+ },
+ "time": {
+ "from": "now-2d",
+ "to": "now"
+ },
+ "timepicker": {
+ "refresh_intervals": [
+ "15s",
+ "30s",
+ "1m",
+ "5m",
+ "15m",
+ "30m"
+ ]
+ },
+ "timezone": "browser",
+ "title": "Apache IoTDB Dashboard",
+ "uid": "TbEVYRw7k",
+ "version": 2,
+ "weekStart": ""
+}
\ No newline at end of file