You are viewing a plain text version of this content. The canonical link for it is here.
Posted to commits@echarts.apache.org by GitBox <gi...@apache.org> on 2020/10/10 04:42:01 UTC
[GitHub] [incubator-echarts] yufeng04 opened a new pull request #13416: feat(gauge): modify some default values, support svg pointer, add axisLine.distance/splitLine.distance/progress/anchor/data[i].title/data[i].detail #13216
yufeng04 opened a new pull request #13416:
URL: https://github.com/apache/incubator-echarts/pull/13416
<!-- Please fill in the following information to help us review your PR more efficiently. -->
## Brief Information
This pull request is in the type of:
- [ ] bug fixing
- [x] new feature
- [ ] others
### What does this PR do?
1. modify some default values
2. support svg pointer
3. add distance to axisLine and splitLine
4. add anchor to gauge.series
5. add progress to gauge.series
6. add title and detail to series.data[i]
7. fix the color of text in dark mode
<!-- USE ONCE SENTENCE TO DESCRIBE WHAT THIS PR DOES. -->
### Fixed issues
【design】 #13216
<!--
- #xxxx: ...
-->
## Details
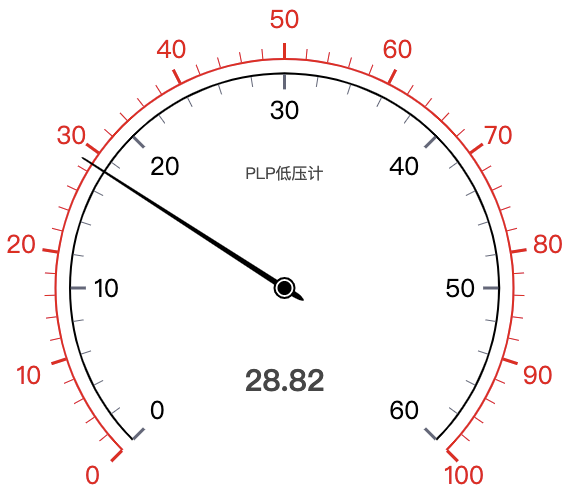
- modify some default values
1. changes
|configuration|before|after|
|--|--|--|
|axisLine.lineStyle.color|`[[0.2, '#91c7ae'], [0.8, '#63869e'], [1, '#c23531']]`|`[[1, '#E6EBF8']]`|
|axisLine.lineStyle.width|30|10|
|axisLine.roundCap|-|false|
|splitLine.length|30|10|
|splitLine.lineStyle.color|'#eee'|'#63677A'|
|splitLine.lineStyle.width|2|3|
|axisTick.length|8|6|
|axisTick.lineStyle.color|'#eee'|'#63677A'|
|axisLabel.distance|5|15|
|axisLabel.color|'auto'|'#46464'|
|axisLabel.fontSize|-|12|
|pointer.icon|-|default/svg|
|pointer.offsetCenter|-|[0,0]|
|poinet.length|'80%'|'60%'|
|pointer.width|8|6|
|poiner.keepAspect|-|false|
|title.color|'#333'|'#464646'|
|title.offserCenter|[0, '-40%']|[0, '20%']|
|title.fontSzie|15|16|
|detail.color|'auto'|'#464646'|
|detail.fontWeight|-|'bold'|
|detail.lineHeight|-|30|
2. Example(default values)

**NOTE**
if some configurations of the chart need to use default(auto) color, we should set `xxx.color: 'auto'`
- support svg pointer
1. configuration
|configuration|values|default|usage|
|--|--|--|--|
|pointer.icon|'default'/svg path|'default'|`pointer: {icon: 'path://xxxxx'}`|
2. Example(svg path)

- add distance to axisTick and splitLine
1. configuration
|configuration|values|default|usage|
|--|--|--|--|
|axisTick.distance|number|10|`axisTick: {distance: 20}`|
|splitLine.distance|number|10|`splitLine: {distance: 20}`|
2. example
- add anchor to gauge.series
1. configuration
|configuration|values|default|usage|
|--|--|--|--|
|anchor.show|boolean|false|-|
|anchor.anchorSize|number|6|-|
|anchor.itemStyle|-|`{color: '#fff', borderWidth: 0, borderColor: '#5470c6'}`|-|
2. example

- add progress to gauge.series
1. configuration
|configuration|values|default|usage|
|--|--|--|--|
|progress.show|boolean|false|-|
|progress.overlap|boolean|true|-|
|progress.width|number|10|-|
|progress.roundCap|boolean|false|-|
|progress.slient|boolean|false|-|
2. example(overlap: false, roundCap: true)
- add title and detail to series.data[i]
1. configuration
|configuration|values|default|usage|
|--|--|--|--|
|series[i].data[i].title|same as series[i].title|same as series[i].title|same as series[i].title|
|series[i].data[i].detail|same as series[i].detail|same as series[i].detail|same as series[i].detail|
2. example

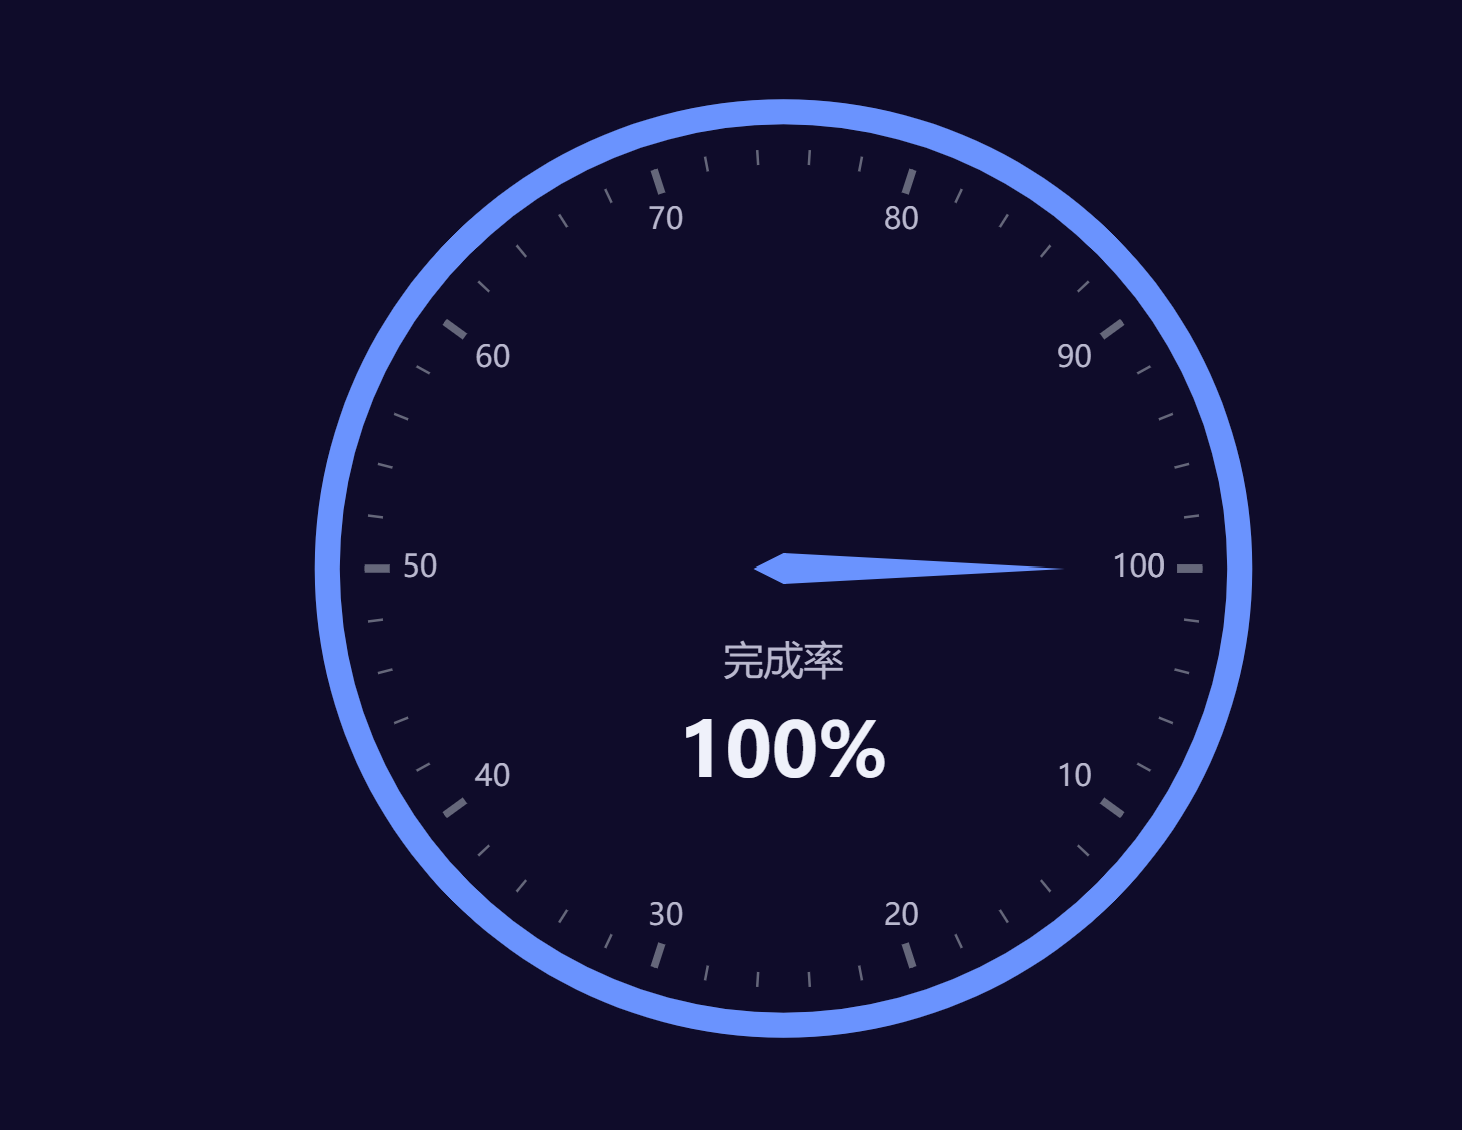
- fix the color of text in dark mode

## Usage
### Are there any API changes?
- [ ] The API has been changed.
<!-- LIST THE API CHANGES HERE -->
### Related test cases or examples to use the new APIs
NA.
## Others
### Merging options
- [x] Please squash the commits into a single one when merge.
### Other information
----------------------------------------------------------------
This is an automated message from the Apache Git Service.
To respond to the message, please log on to GitHub and use the
URL above to go to the specific comment.
For queries about this service, please contact Infrastructure at:
users@infra.apache.org
---------------------------------------------------------------------
To unsubscribe, e-mail: commits-unsubscribe@echarts.apache.org
For additional commands, e-mail: commits-help@echarts.apache.org
[GitHub] [incubator-echarts] yufeng04 commented on a change in pull request #13416: feat(gauge): modify some default values, support svg pointer, add axisLine.distance/splitLine.distance/progress/anchor/data[i].title/data[i].detail #13216
Posted by GitBox <gi...@apache.org>.
yufeng04 commented on a change in pull request #13416:
URL: https://github.com/apache/incubator-echarts/pull/13416#discussion_r503091991


##########
File path: src/chart/gauge/GaugeView.ts
##########
@@ -95,25 +99,26 @@ class GaugeView extends ChartView {
         posInfo: PosInfo
     ) {
         const group = this.group;
-
-        const axisLineModel = seriesModel.getModel('axisLine');
-        const lineStyleModel = axisLineModel.getModel('lineStyle');
-
         const clockwise = seriesModel.get('clockwise');
         let startAngle = -seriesModel.get('startAngle') / 180 * Math.PI;
         let endAngle = -seriesModel.get('endAngle') / 180 * Math.PI;
+        const axisLineModel = seriesModel.getModel('axisLine');
+
+        const roundCap = axisLineModel.get('roundCap');
+        const MainPath = roundCap ? Sausage : graphic.Sector;

Review comment:
       Yes,you are right! I fixed the bug that gauge.axisLine can not be a circle when the arc angle is 360 degrees just now.

   ```
           // angleRangeSpan can't be PI2
           // const angleRangeSpan = (endAngle - startAngle) % PI2
           const angleRangeSpan = !((endAngle - startAngle) % PI2) && endAngle !== startAngle
               ? PI2 : (endAngle - startAngle) % PI2;
   ```

   Now, the path can be closed.


----------------------------------------------------------------
This is an automated message from the Apache Git Service.
To respond to the message, please log on to GitHub and use the
URL above to go to the specific comment.

For queries about this service, please contact Infrastructure at:
users@infra.apache.org


---------------------------------------------------------------------
To unsubscribe, e-mail: commits-unsubscribe@echarts.apache.org
For additional commands, e-mail: commits-help@echarts.apache.org
[GitHub] [incubator-echarts] plainheart commented on a change in pull request #13416: feat(gauge): modify some default values, support svg pointer, add axisLine.distance/splitLine.distance/progress/anchor/data[i].title/data[i].detail #13216
Posted by GitBox <gi...@apache.org>.
plainheart commented on a change in pull request #13416:
URL: https://github.com/apache/incubator-echarts/pull/13416#discussion_r503077856
##########
File path: src/chart/gauge/GaugeView.ts
##########
@@ -95,25 +99,26 @@ class GaugeView extends ChartView {
posInfo: PosInfo
) {
const group = this.group;
-
- const axisLineModel = seriesModel.getModel('axisLine');
- const lineStyleModel = axisLineModel.getModel('lineStyle');
-
const clockwise = seriesModel.get('clockwise');
let startAngle = -seriesModel.get('startAngle') / 180 * Math.PI;
let endAngle = -seriesModel.get('endAngle') / 180 * Math.PI;
+ const axisLineModel = seriesModel.getModel('axisLine');
+
+ const roundCap = axisLineModel.get('roundCap');
+ const MainPath = roundCap ? Sausage : graphic.Sector;
Review comment:
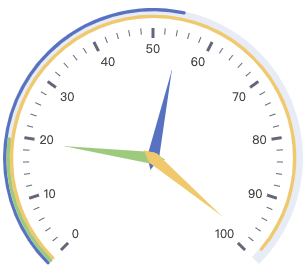
Looks like the arc angle is not 360 degrees(a circle)? Is there some wrong with the startAngle and endAngle?
If it's a circle, the path should be closed.
----------------------------------------------------------------
This is an automated message from the Apache Git Service.
To respond to the message, please log on to GitHub and use the
URL above to go to the specific comment.
For queries about this service, please contact Infrastructure at:
users@infra.apache.org
---------------------------------------------------------------------
To unsubscribe, e-mail: commits-unsubscribe@echarts.apache.org
For additional commands, e-mail: commits-help@echarts.apache.org
[GitHub] [incubator-echarts] pissang merged pull request #13416: feat(gauge): modify some default values, support svg pointer, add axisLine.distance/splitLine.distance/progress/anchor/data[i].title/data[i].detail #13216
Posted by GitBox <gi...@apache.org>.
pissang merged pull request #13416:
URL: https://github.com/apache/incubator-echarts/pull/13416


----------------------------------------------------------------
This is an automated message from the Apache Git Service.
To respond to the message, please log on to GitHub and use the
URL above to go to the specific comment.

For queries about this service, please contact Infrastructure at:
users@infra.apache.org


---------------------------------------------------------------------
To unsubscribe, e-mail: commits-unsubscribe@echarts.apache.org
For additional commands, e-mail: commits-help@echarts.apache.org
[GitHub] [incubator-echarts] plainheart commented on a change in pull request #13416: feat(gauge): modify some default values, support svg pointer, add axisLine.distance/splitLine.distance/progress/anchor/data[i].title/data[i].detail #13216
Posted by GitBox <gi...@apache.org>.
plainheart commented on a change in pull request #13416:
URL: https://github.com/apache/incubator-echarts/pull/13416#discussion_r503093938
##########
File path: src/chart/gauge/GaugeView.ts
##########
@@ -95,25 +99,26 @@ class GaugeView extends ChartView {
posInfo: PosInfo
) {
const group = this.group;
-
- const axisLineModel = seriesModel.getModel('axisLine');
- const lineStyleModel = axisLineModel.getModel('lineStyle');
-
const clockwise = seriesModel.get('clockwise');
let startAngle = -seriesModel.get('startAngle') / 180 * Math.PI;
let endAngle = -seriesModel.get('endAngle') / 180 * Math.PI;
+ const axisLineModel = seriesModel.getModel('axisLine');
+
+ const roundCap = axisLineModel.get('roundCap');
+ const MainPath = roundCap ? Sausage : graphic.Sector;
Review comment:
I made a test for this and it indicated that no such case. See the screenshot. If I'm missing something, please let me know.
----------------------------------------------------------------
This is an automated message from the Apache Git Service.
To respond to the message, please log on to GitHub and use the
URL above to go to the specific comment.
For queries about this service, please contact Infrastructure at:
users@infra.apache.org
---------------------------------------------------------------------
To unsubscribe, e-mail: commits-unsubscribe@echarts.apache.org
For additional commands, e-mail: commits-help@echarts.apache.org
[GitHub] [incubator-echarts] pissang commented on a change in pull request #13416: feat(gauge): modify some default values, support svg pointer, add axisLine.distance/splitLine.distance/progress/anchor/data[i].title/data[i].detail #13216
Posted by GitBox <gi...@apache.org>.
pissang commented on a change in pull request #13416:
URL: https://github.com/apache/incubator-echarts/pull/13416#discussion_r503017344


##########
File path: src/util/types.ts
##########
@@ -795,6 +795,7 @@ export interface LineStyleOption<Clr = ZRColor> extends ShadowOptionMixin {
     join?: CanvasLineJoin
     dashOffset?: number
     miterLimit?: number
+    roundCap?: boolean

Review comment:
       Agree. `roundCap` should not be added in here. It's not for all `lineStyle`.  Only gauge use it.

   Also, there is a  conflict here is we use `lineStyle` in gauge but draw the shape with `fill`. So either we use a limited subset of `lineStyle`, or we change the draw method from `fill` to `stroke`


----------------------------------------------------------------
This is an automated message from the Apache Git Service.
To respond to the message, please log on to GitHub and use the
URL above to go to the specific comment.

For queries about this service, please contact Infrastructure at:
users@infra.apache.org


---------------------------------------------------------------------
To unsubscribe, e-mail: commits-unsubscribe@echarts.apache.org
For additional commands, e-mail: commits-help@echarts.apache.org
[GitHub] [incubator-echarts] plainheart commented on a change in pull request #13416: feat(gauge): modify some default values, support svg pointer, add axisLine.distance/splitLine.distance/progress/anchor/data[i].title/data[i].detail #13216
Posted by GitBox <gi...@apache.org>.
plainheart commented on a change in pull request #13416:
URL: https://github.com/apache/incubator-echarts/pull/13416#discussion_r502865707


##########
File path: src/util/types.ts
##########
@@ -795,6 +795,7 @@ export interface LineStyleOption<Clr = ZRColor> extends ShadowOptionMixin {
     join?: CanvasLineJoin
     dashOffset?: number
     miterLimit?: number
+    roundCap?: boolean

Review comment:
       Perhaps, `roundCap` is not very necessary. There is an option `cap` above. Setting `cap` to `round` is identical to `roundCap`.

##########
File path: src/chart/gauge/GaugeView.ts
##########
@@ -312,165 +324,291 @@ class GaugeView extends ChartView {
         posInfo: PosInfo,
         startAngle: number,
         endAngle: number,
-        clockwise: boolean
+        clockwise: boolean,
+        axisLineWidth: number
     ) {

         const group = this.group;
         const oldData = this._data;
+        const oldProgressData = this._progressData;
+        const progressList = [] as graphic.Path[];

-        if (!seriesModel.get(['pointer', 'show'])) {
-            // Remove old element
-            oldData && oldData.eachItemGraphicEl(function (el) {
-                group.remove(el);
-            });
-            return;
-        }
-
-        const valueExtent = [+seriesModel.get('min'), +seriesModel.get('max')];
-        const angleExtent = [startAngle, endAngle];
+        const showPointer = seriesModel.get(['pointer', 'show']);
+        const progressModel = seriesModel.getModel('progress');
+        const showProgress = progressModel.get('show');

         const data = seriesModel.getData();
         const valueDim = data.mapDimension('value');
+        const valueExtent = [+seriesModel.get('min'), +seriesModel.get('max')];
+        const angleExtent = [startAngle, endAngle];

-        data.diff(oldData)
-            .add(function (idx) {
-                const pointer = new PointerPath({
+        function createPointer(idx: number) {
+            const itemModel = data.getItemModel<GaugeDataItemOption>(idx);
+            const pointerModel = itemModel.getModel('pointer');
+            const pointerWidth = parsePercent(pointerModel.get('width'), posInfo.r);
+            const pointerLength = parsePercent(pointerModel.get('length'), posInfo.r);
+
+            const pointerStr = seriesModel.get(['pointer', 'icon']);
+            const pointerOffset = pointerModel.get('offsetCenter');
+            const pointerKeepAspect = pointerModel.get('keepAspect');
+            let pointer;
+            if (pointerStr.indexOf('path://') === 0) {
+                pointer = createSymbol(
+                    pointerStr,
+                    parsePercent(pointerOffset[0], posInfo.r) - pointerWidth / 2,
+                    parsePercent(pointerOffset[1], posInfo.r) - pointerLength,
+                    pointerWidth,
+                    pointerLength,
+                    null,
+                    pointerKeepAspect
+                ) as graphic.Path;
+            }
+            else {
+                pointer = new PointerPath({
                     shape: {
-                        angle: startAngle
+                        angle: -Math.PI / 2,
+                        width: parsePercent(pointerModel.get('width'), posInfo.r),
+                        r: parsePercent(pointerModel.get('length'), posInfo.r)
                     }
-                });
+                })
+            }
+            pointer.rotation = -(startAngle + Math.PI / 2);
+            pointer.x = posInfo.cx;
+            pointer.y = posInfo.cy;
+            return pointer;
+        }

-                graphic.initProps(pointer, {
-                    shape: {
-                        angle: linearMap(data.get(valueDim, idx) as number, valueExtent, angleExtent, true)
-                    }
-                }, seriesModel);
+        function createProgress(idx: number, endAngle: number) {
+            const roundCap = progressModel.get('roundCap');
+            const ProgressPath = roundCap ? Sausage : graphic.Sector;

Review comment:
       The same as the above.

##########
File path: src/chart/gauge/GaugeView.ts
##########
@@ -95,25 +99,26 @@ class GaugeView extends ChartView {
         posInfo: PosInfo
     ) {
         const group = this.group;
-
-        const axisLineModel = seriesModel.getModel('axisLine');
-        const lineStyleModel = axisLineModel.getModel('lineStyle');
-
         const clockwise = seriesModel.get('clockwise');
         let startAngle = -seriesModel.get('startAngle') / 180 * Math.PI;
         let endAngle = -seriesModel.get('endAngle') / 180 * Math.PI;
+        const axisLineModel = seriesModel.getModel('axisLine');
+
+        const roundCap = axisLineModel.get('roundCap');
+        const MainPath = roundCap ? Sausage : graphic.Sector;

Review comment:
       Currently, the `Sector` shape has provided supports to draw corner radius. Using `Sector` should be enough.
   Setting `shape.cornerRadius` to the half of `shape.r` and `shape.innerCornerRadius` to the half of `shape.r0` is identical to `roundCap`(Sausage).

   I'm not sure if we should use `Sector` instead of `Sausage`.


----------------------------------------------------------------
This is an automated message from the Apache Git Service.
To respond to the message, please log on to GitHub and use the
URL above to go to the specific comment.

For queries about this service, please contact Infrastructure at:
users@infra.apache.org


---------------------------------------------------------------------
To unsubscribe, e-mail: commits-unsubscribe@echarts.apache.org
For additional commands, e-mail: commits-help@echarts.apache.org
[GitHub] [incubator-echarts] yufeng04 commented on a change in pull request #13416: feat(gauge): modify some default values, support svg pointer, add axisLine.distance/splitLine.distance/progress/anchor/data[i].title/data[i].detail #13216
Posted by GitBox <gi...@apache.org>.
yufeng04 commented on a change in pull request #13416:
URL: https://github.com/apache/incubator-echarts/pull/13416#discussion_r503644452
##########
File path: src/chart/gauge/GaugeView.ts
##########
@@ -95,25 +99,26 @@ class GaugeView extends ChartView {
posInfo: PosInfo
) {
const group = this.group;
-
- const axisLineModel = seriesModel.getModel('axisLine');
- const lineStyleModel = axisLineModel.getModel('lineStyle');
-
const clockwise = seriesModel.get('clockwise');
let startAngle = -seriesModel.get('startAngle') / 180 * Math.PI;
let endAngle = -seriesModel.get('endAngle') / 180 * Math.PI;
+ const axisLineModel = seriesModel.getModel('axisLine');
+
+ const roundCap = axisLineModel.get('roundCap');
+ const MainPath = roundCap ? Sausage : graphic.Sector;
Review comment:
The difference between setting shape.cornerRadius/shape.innerCornerRadius and roundCap(Sausage):
1. `axisLine:{color: [color: [[0.9, '#0f0'], [1, '#f00']]}` (cornerRadius maybe better)

2. `porgress:{itemStyle: {color: '#f00',borderColor: '#0f0',borderWidth: 1}}`, and the current value is greater than max value. (roundCap maybe better)

In order to keep `axisLine` and `progress` the same style, is `roundCap` better?
----------------------------------------------------------------
This is an automated message from the Apache Git Service.
To respond to the message, please log on to GitHub and use the
URL above to go to the specific comment.
For queries about this service, please contact Infrastructure at:
users@infra.apache.org
---------------------------------------------------------------------
To unsubscribe, e-mail: commits-unsubscribe@echarts.apache.org
For additional commands, e-mail: commits-help@echarts.apache.org
[GitHub] [incubator-echarts] pissang commented on pull request #13416: feat(gauge): modify some default values, support svg pointer, add axisLine.distance/splitLine.distance/progress/anchor/data[i].title/data[i].detail #13216
Posted by GitBox <gi...@apache.org>.
pissang commented on pull request #13416:
URL: https://github.com/apache/incubator-echarts/pull/13416#issuecomment-709965936


   Besides these requested changes. I see lots of linting errors. It's better to check and fix all of them.


----------------------------------------------------------------
This is an automated message from the Apache Git Service.
To respond to the message, please log on to GitHub and use the
URL above to go to the specific comment.

For queries about this service, please contact Infrastructure at:
users@infra.apache.org


---------------------------------------------------------------------
To unsubscribe, e-mail: commits-unsubscribe@echarts.apache.org
For additional commands, e-mail: commits-help@echarts.apache.org
[GitHub] [incubator-echarts] yufeng04 commented on a change in pull request #13416: feat(gauge): modify some default values, support svg pointer, add axisLine.distance/splitLine.distance/progress/anchor/data[i].title/data[i].detail #13216
Posted by GitBox <gi...@apache.org>.
yufeng04 commented on a change in pull request #13416:
URL: https://github.com/apache/incubator-echarts/pull/13416#discussion_r503045580
##########
File path: src/util/types.ts
##########
@@ -795,6 +795,7 @@ export interface LineStyleOption<Clr = ZRColor> extends ShadowOptionMixin {
join?: CanvasLineJoin
dashOffset?: number
miterLimit?: number
+ roundCap?: boolean
Review comment:
Thanks! I forget to delete it.
##########
File path: src/chart/gauge/GaugeView.ts
##########
@@ -95,25 +99,26 @@ class GaugeView extends ChartView {
posInfo: PosInfo
) {
const group = this.group;
-
- const axisLineModel = seriesModel.getModel('axisLine');
- const lineStyleModel = axisLineModel.getModel('lineStyle');
-
const clockwise = seriesModel.get('clockwise');
let startAngle = -seriesModel.get('startAngle') / 180 * Math.PI;
let endAngle = -seriesModel.get('endAngle') / 180 * Math.PI;
+ const axisLineModel = seriesModel.getModel('axisLine');
+
+ const roundCap = axisLineModel.get('roundCap');
+ const MainPath = roundCap ? Sausage : graphic.Sector;
Review comment:
There is a little difference between setting shape.cornerRadius/shape.innerCornerRadius and `roundCap`(Sausage).

----------------------------------------------------------------
This is an automated message from the Apache Git Service.
To respond to the message, please log on to GitHub and use the
URL above to go to the specific comment.
For queries about this service, please contact Infrastructure at:
users@infra.apache.org
---------------------------------------------------------------------
To unsubscribe, e-mail: commits-unsubscribe@echarts.apache.org
For additional commands, e-mail: commits-help@echarts.apache.org
[GitHub] [incubator-echarts] echarts-bot[bot] commented on pull request #13416: feat(gauge): modify some default values, support svg pointer, add axisLine.distance/splitLine.distance/progress/anchor/data[i].title/data[i].detail #13216
Posted by GitBox <gi...@apache.org>.
echarts-bot[bot] commented on pull request #13416:
URL: https://github.com/apache/incubator-echarts/pull/13416#issuecomment-710763006


   Congratulations! Your PR has been merged. Thanks for your contribution! 👍


----------------------------------------------------------------
This is an automated message from the Apache Git Service.
To respond to the message, please log on to GitHub and use the
URL above to go to the specific comment.

For queries about this service, please contact Infrastructure at:
users@infra.apache.org


---------------------------------------------------------------------
To unsubscribe, e-mail: commits-unsubscribe@echarts.apache.org
For additional commands, e-mail: commits-help@echarts.apache.org
[GitHub] [incubator-echarts] plainheart commented on a change in pull request #13416: feat(gauge): modify some default values, support svg pointer, add axisLine.distance/splitLine.distance/progress/anchor/data[i].title/data[i].detail #13216
Posted by GitBox <gi...@apache.org>.
plainheart commented on a change in pull request #13416:
URL: https://github.com/apache/incubator-echarts/pull/13416#discussion_r503648492


##########
File path: src/chart/gauge/GaugeView.ts
##########
@@ -95,25 +99,26 @@ class GaugeView extends ChartView {
         posInfo: PosInfo
     ) {
         const group = this.group;
-
-        const axisLineModel = seriesModel.getModel('axisLine');
-        const lineStyleModel = axisLineModel.getModel('lineStyle');
-
         const clockwise = seriesModel.get('clockwise');
         let startAngle = -seriesModel.get('startAngle') / 180 * Math.PI;
         let endAngle = -seriesModel.get('endAngle') / 180 * Math.PI;
+        const axisLineModel = seriesModel.getModel('axisLine');
+
+        const roundCap = axisLineModel.get('roundCap');
+        const MainPath = roundCap ? Sausage : graphic.Sector;

Review comment:
       IMO, `110%` seems not to be a normal value in gauge. Why and when will the percentage exceed 100%?

   If we have to display a percentage that exceeds 100%, as you said, maybe it's better to use sausage instead of sector.


----------------------------------------------------------------
This is an automated message from the Apache Git Service.
To respond to the message, please log on to GitHub and use the
URL above to go to the specific comment.

For queries about this service, please contact Infrastructure at:
users@infra.apache.org


---------------------------------------------------------------------
To unsubscribe, e-mail: commits-unsubscribe@echarts.apache.org
For additional commands, e-mail: commits-help@echarts.apache.org
[GitHub] [incubator-echarts] pissang commented on a change in pull request #13416: feat(gauge): modify some default values, support svg pointer, add axisLine.distance/splitLine.distance/progress/anchor/data[i].title/data[i].detail #13216
Posted by GitBox <gi...@apache.org>.
pissang commented on a change in pull request #13416:
URL: https://github.com/apache/incubator-echarts/pull/13416#discussion_r506262241
##########
File path: src/chart/gauge/GaugeView.ts
##########
@@ -312,165 +324,296 @@ class GaugeView extends ChartView {
posInfo: PosInfo,
startAngle: number,
endAngle: number,
- clockwise: boolean
+ clockwise: boolean,
+ axisLineWidth: number
) {
const group = this.group;
const oldData = this._data;
+ const oldProgressData = this._progressData;
+ const progressList = [] as graphic.Path[];
- if (!seriesModel.get(['pointer', 'show'])) {
- // Remove old element
- oldData && oldData.eachItemGraphicEl(function (el) {
- group.remove(el);
- });
- return;
- }
-
- const valueExtent = [+seriesModel.get('min'), +seriesModel.get('max')];
- const angleExtent = [startAngle, endAngle];
+ const showPointer = seriesModel.get(['pointer', 'show']);
+ const progressModel = seriesModel.getModel('progress');
+ const showProgress = progressModel.get('show');
const data = seriesModel.getData();
const valueDim = data.mapDimension('value');
+ const minVal = +seriesModel.get('min');
+ const maxVal = +seriesModel.get('max');
+ const valueExtent = [minVal, maxVal];
+ const angleExtent = [startAngle, endAngle];
- data.diff(oldData)
- .add(function (idx) {
- const pointer = new PointerPath({
+ function createPointer(idx: number, angle: number) {
+ const itemModel = data.getItemModel<GaugeDataItemOption>(idx);
+ const pointerModel = itemModel.getModel('pointer');
+ const pointerWidth = parsePercent(pointerModel.get('width'), posInfo.r);
+ const pointerLength = parsePercent(pointerModel.get('length'), posInfo.r);
+
+ const pointerStr = seriesModel.get(['pointer', 'icon']);
+ const pointerOffset = pointerModel.get('offsetCenter');
+ const pointerKeepAspect = pointerModel.get('keepAspect');
+ let pointer;
+ if (pointerStr.indexOf('path://') === 0) {
+ pointer = createSymbol(
+ pointerStr,
+ parsePercent(pointerOffset[0], posInfo.r) - pointerWidth / 2,
+ parsePercent(pointerOffset[1], posInfo.r) - pointerLength,
+ pointerWidth,
+ pointerLength,
+ null,
+ pointerKeepAspect
+ ) as graphic.Path;
+ }
+ else {
+ pointer = new PointerPath({
shape: {
- angle: startAngle
+ angle: -Math.PI / 2,
+ width: parsePercent(pointerModel.get('width'), posInfo.r),
+ r: parsePercent(pointerModel.get('length'), posInfo.r)
}
- });
+ })
+ }
+ pointer.rotation = -(angle + Math.PI / 2);
+ pointer.x = posInfo.cx;
+ pointer.y = posInfo.cy;
+ return pointer;
+ }
- graphic.initProps(pointer, {
- shape: {
- angle: linearMap(data.get(valueDim, idx) as number, valueExtent, angleExtent, true)
- }
- }, seriesModel);
+ function createProgress(idx: number, endAngle: number) {
+ const roundCap = progressModel.get('roundCap');
+ const ProgressPath = roundCap ? Sausage : graphic.Sector;
- group.add(pointer);
- data.setItemGraphicEl(idx, pointer);
- })
- .update(function (newIdx, oldIdx) {
- const pointer = oldData.getItemGraphicEl(oldIdx) as PointerPath;
+ const isOverlap = progressModel.get('overlap');
+ const progressWidth = isOverlap ? progressModel.get('width') : axisLineWidth / data.count();
+ const r0 = isOverlap ? posInfo.r - progressWidth : posInfo.r - (idx + 1) * progressWidth;
+ const r = isOverlap ? posInfo.r : posInfo.r - idx * progressWidth;
+ const progressSilent = progressModel.get('silent');
+ const progress = new ProgressPath({
+ shape: {
+ startAngle: startAngle,
+ endAngle: endAngle,
+ cx: posInfo.cx,
+ cy: posInfo.cy,
+ clockwise: clockwise,
+ r0: r0,
+ r: r
+ },
+ // 是否相应鼠标事件
+ silent: progressSilent
+ });
+ isOverlap && (progress.z2 = maxVal - (data.get(valueDim, idx) as number) % maxVal);
+ return progress;
+ }
- graphic.updateProps(pointer, {
- shape: {
- angle: linearMap(data.get(valueDim, newIdx) as number, valueExtent, angleExtent, true)
+ if (showProgress || showPointer) {
+ data.diff(oldData)
+ .add(function (idx) {
+ if (showPointer) {
+ const pointer = createPointer(idx, startAngle);
+ graphic.initProps(pointer, {
+ rotation: -(linearMap(data.get(valueDim, idx) as number, valueExtent, angleExtent, true) + Math.PI / 2)
+ }, seriesModel);
+ group.add(pointer);
+ data.setItemGraphicEl(idx, pointer);
}
- }, seriesModel);
-
- group.add(pointer);
- data.setItemGraphicEl(newIdx, pointer);
- })
- .remove(function (idx) {
- const pointer = oldData.getItemGraphicEl(idx);
- group.remove(pointer);
- })
- .execute();
-
- data.eachItemGraphicEl(function (pointer: PointerPath, idx) {
- const itemModel = data.getItemModel<GaugeDataItemOption>(idx);
- const pointerModel = itemModel.getModel('pointer');
- const emphasisModel = itemModel.getModel('emphasis');
-
- pointer.setShape({
- x: posInfo.cx,
- y: posInfo.cy,
- width: parsePercent(
- pointerModel.get('width'), posInfo.r
- ),
- r: parsePercent(pointerModel.get('length'), posInfo.r)
- });
- pointer.useStyle(itemModel.getModel('itemStyle').getItemStyle());
+ if (showProgress) {
+ const progress = createProgress(idx, startAngle) as graphic.Sector;
+ const isClip = progressModel.get('clip');
+ graphic.initProps(progress, {
+ shape: {
+ endAngle: linearMap(data.get(valueDim, idx) as number, valueExtent, angleExtent, isClip)
+ }
+ }, seriesModel);
+ group.add(progress);
+ progressList[idx] = progress;
+ }
+ })
+ .update(function (newIdx, oldIdx) {
+ if (showPointer) {
+ const previousPointer = oldData.getItemGraphicEl(oldIdx) as PointerPath;
+ const previousRotate = previousPointer.rotation;
+ group.remove(previousPointer);
+ const pointer = createPointer(newIdx, previousRotate);
+ pointer.rotation = previousRotate;
+ graphic.updateProps(pointer, {
+ rotation: -(linearMap(data.get(valueDim, newIdx) as number, valueExtent, angleExtent, true) + Math.PI / 2)
+ }, seriesModel);
+ group.add(pointer);
+ data.setItemGraphicEl(newIdx, pointer);
+ }
- if (pointer.style.fill === 'auto') {
- pointer.setStyle('fill', getColor(
- linearMap(data.get(valueDim, idx) as number, valueExtent, [0, 1], true)
- ));
- }
+ if (showProgress) {
+ const previousProgress = oldProgressData[oldIdx];
+ const previousEndAngle = previousProgress.shape.endAngle;
Review comment:
Same issues with above.
##########
File path: src/chart/gauge/GaugeSeries.ts
##########
@@ -40,14 +40,54 @@ interface LabelFormatter {
}
interface PointerOption {
+ icon?: string
show?: boolean
+ keepAspect?: boolean
+ itemStyle?: ItemStyleOption
/**
* Can be percent
*/
+ offsetCenter?: (number | string)[]
length?: number | string
width?: number
}
+interface AnchorOption {
+ show?: boolean
+ showAbove?: boolean
+ anchorSize?: number
+ icon?: string
Review comment:
It can be `size` instead of `anchorSize` here. Since it's already in the `anchor` option.
##########
File path: src/chart/gauge/GaugeView.ts
##########
@@ -312,165 +324,296 @@ class GaugeView extends ChartView {
posInfo: PosInfo,
startAngle: number,
endAngle: number,
- clockwise: boolean
+ clockwise: boolean,
+ axisLineWidth: number
) {
const group = this.group;
const oldData = this._data;
+ const oldProgressData = this._progressData;
+ const progressList = [] as graphic.Path[];
- if (!seriesModel.get(['pointer', 'show'])) {
- // Remove old element
- oldData && oldData.eachItemGraphicEl(function (el) {
- group.remove(el);
- });
- return;
- }
-
- const valueExtent = [+seriesModel.get('min'), +seriesModel.get('max')];
- const angleExtent = [startAngle, endAngle];
+ const showPointer = seriesModel.get(['pointer', 'show']);
+ const progressModel = seriesModel.getModel('progress');
+ const showProgress = progressModel.get('show');
const data = seriesModel.getData();
const valueDim = data.mapDimension('value');
+ const minVal = +seriesModel.get('min');
+ const maxVal = +seriesModel.get('max');
+ const valueExtent = [minVal, maxVal];
+ const angleExtent = [startAngle, endAngle];
- data.diff(oldData)
- .add(function (idx) {
- const pointer = new PointerPath({
+ function createPointer(idx: number, angle: number) {
+ const itemModel = data.getItemModel<GaugeDataItemOption>(idx);
+ const pointerModel = itemModel.getModel('pointer');
+ const pointerWidth = parsePercent(pointerModel.get('width'), posInfo.r);
+ const pointerLength = parsePercent(pointerModel.get('length'), posInfo.r);
+
+ const pointerStr = seriesModel.get(['pointer', 'icon']);
+ const pointerOffset = pointerModel.get('offsetCenter');
+ const pointerKeepAspect = pointerModel.get('keepAspect');
+ let pointer;
+ if (pointerStr.indexOf('path://') === 0) {
+ pointer = createSymbol(
Review comment:
pointerStr can starts with 'image://'. Or being `rect`, `triangle`.
I think set `icon: null` can use the default `PointerPath` icon. Otherwise use `createSymbol`.
##########
File path: src/chart/gauge/GaugeView.ts
##########
@@ -312,165 +324,296 @@ class GaugeView extends ChartView {
posInfo: PosInfo,
startAngle: number,
endAngle: number,
- clockwise: boolean
+ clockwise: boolean,
+ axisLineWidth: number
) {
const group = this.group;
const oldData = this._data;
+ const oldProgressData = this._progressData;
+ const progressList = [] as graphic.Path[];
- if (!seriesModel.get(['pointer', 'show'])) {
- // Remove old element
- oldData && oldData.eachItemGraphicEl(function (el) {
- group.remove(el);
- });
- return;
- }
-
- const valueExtent = [+seriesModel.get('min'), +seriesModel.get('max')];
- const angleExtent = [startAngle, endAngle];
+ const showPointer = seriesModel.get(['pointer', 'show']);
+ const progressModel = seriesModel.getModel('progress');
+ const showProgress = progressModel.get('show');
const data = seriesModel.getData();
const valueDim = data.mapDimension('value');
+ const minVal = +seriesModel.get('min');
+ const maxVal = +seriesModel.get('max');
+ const valueExtent = [minVal, maxVal];
+ const angleExtent = [startAngle, endAngle];
- data.diff(oldData)
- .add(function (idx) {
- const pointer = new PointerPath({
+ function createPointer(idx: number, angle: number) {
+ const itemModel = data.getItemModel<GaugeDataItemOption>(idx);
+ const pointerModel = itemModel.getModel('pointer');
+ const pointerWidth = parsePercent(pointerModel.get('width'), posInfo.r);
+ const pointerLength = parsePercent(pointerModel.get('length'), posInfo.r);
+
+ const pointerStr = seriesModel.get(['pointer', 'icon']);
+ const pointerOffset = pointerModel.get('offsetCenter');
+ const pointerKeepAspect = pointerModel.get('keepAspect');
+ let pointer;
+ if (pointerStr.indexOf('path://') === 0) {
+ pointer = createSymbol(
+ pointerStr,
+ parsePercent(pointerOffset[0], posInfo.r) - pointerWidth / 2,
+ parsePercent(pointerOffset[1], posInfo.r) - pointerLength,
+ pointerWidth,
+ pointerLength,
+ null,
+ pointerKeepAspect
+ ) as graphic.Path;
+ }
+ else {
+ pointer = new PointerPath({
shape: {
- angle: startAngle
+ angle: -Math.PI / 2,
+ width: parsePercent(pointerModel.get('width'), posInfo.r),
+ r: parsePercent(pointerModel.get('length'), posInfo.r)
}
- });
+ })
+ }
+ pointer.rotation = -(angle + Math.PI / 2);
+ pointer.x = posInfo.cx;
+ pointer.y = posInfo.cy;
+ return pointer;
+ }
- graphic.initProps(pointer, {
- shape: {
- angle: linearMap(data.get(valueDim, idx) as number, valueExtent, angleExtent, true)
- }
- }, seriesModel);
+ function createProgress(idx: number, endAngle: number) {
+ const roundCap = progressModel.get('roundCap');
+ const ProgressPath = roundCap ? Sausage : graphic.Sector;
- group.add(pointer);
- data.setItemGraphicEl(idx, pointer);
- })
- .update(function (newIdx, oldIdx) {
- const pointer = oldData.getItemGraphicEl(oldIdx) as PointerPath;
+ const isOverlap = progressModel.get('overlap');
+ const progressWidth = isOverlap ? progressModel.get('width') : axisLineWidth / data.count();
+ const r0 = isOverlap ? posInfo.r - progressWidth : posInfo.r - (idx + 1) * progressWidth;
+ const r = isOverlap ? posInfo.r : posInfo.r - idx * progressWidth;
+ const progressSilent = progressModel.get('silent');
+ const progress = new ProgressPath({
+ shape: {
+ startAngle: startAngle,
+ endAngle: endAngle,
+ cx: posInfo.cx,
+ cy: posInfo.cy,
+ clockwise: clockwise,
+ r0: r0,
+ r: r
+ },
+ // 是否相应鼠标事件
+ silent: progressSilent
+ });
+ isOverlap && (progress.z2 = maxVal - (data.get(valueDim, idx) as number) % maxVal);
+ return progress;
+ }
- graphic.updateProps(pointer, {
- shape: {
- angle: linearMap(data.get(valueDim, newIdx) as number, valueExtent, angleExtent, true)
+ if (showProgress || showPointer) {
+ data.diff(oldData)
+ .add(function (idx) {
+ if (showPointer) {
+ const pointer = createPointer(idx, startAngle);
+ graphic.initProps(pointer, {
+ rotation: -(linearMap(data.get(valueDim, idx) as number, valueExtent, angleExtent, true) + Math.PI / 2)
+ }, seriesModel);
+ group.add(pointer);
+ data.setItemGraphicEl(idx, pointer);
}
- }, seriesModel);
-
- group.add(pointer);
- data.setItemGraphicEl(newIdx, pointer);
- })
- .remove(function (idx) {
- const pointer = oldData.getItemGraphicEl(idx);
- group.remove(pointer);
- })
- .execute();
-
- data.eachItemGraphicEl(function (pointer: PointerPath, idx) {
- const itemModel = data.getItemModel<GaugeDataItemOption>(idx);
- const pointerModel = itemModel.getModel('pointer');
- const emphasisModel = itemModel.getModel('emphasis');
-
- pointer.setShape({
- x: posInfo.cx,
- y: posInfo.cy,
- width: parsePercent(
- pointerModel.get('width'), posInfo.r
- ),
- r: parsePercent(pointerModel.get('length'), posInfo.r)
- });
- pointer.useStyle(itemModel.getModel('itemStyle').getItemStyle());
+ if (showProgress) {
+ const progress = createProgress(idx, startAngle) as graphic.Sector;
+ const isClip = progressModel.get('clip');
+ graphic.initProps(progress, {
+ shape: {
+ endAngle: linearMap(data.get(valueDim, idx) as number, valueExtent, angleExtent, isClip)
+ }
+ }, seriesModel);
+ group.add(progress);
+ progressList[idx] = progress;
+ }
+ })
+ .update(function (newIdx, oldIdx) {
+ if (showPointer) {
+ const previousPointer = oldData.getItemGraphicEl(oldIdx) as PointerPath;
+ const previousRotate = previousPointer.rotation;
+ group.remove(previousPointer);
+ const pointer = createPointer(newIdx, previousRotate);
+ pointer.rotation = previousRotate;
+ graphic.updateProps(pointer, {
+ rotation: -(linearMap(data.get(valueDim, newIdx) as number, valueExtent, angleExtent, true) + Math.PI / 2)
+ }, seriesModel);
+ group.add(pointer);
+ data.setItemGraphicEl(newIdx, pointer);
+ }
- if (pointer.style.fill === 'auto') {
- pointer.setStyle('fill', getColor(
- linearMap(data.get(valueDim, idx) as number, valueExtent, [0, 1], true)
- ));
- }
+ if (showProgress) {
+ const previousProgress = oldProgressData[oldIdx];
+ const previousEndAngle = previousProgress.shape.endAngle;
+ group.remove(previousProgress);
+ const progress = createProgress(newIdx, previousEndAngle) as graphic.Sector;
+ const isClip = progressModel.get('clip');
+ graphic.updateProps(progress, {
+ shape: {
+ endAngle: linearMap(data.get(valueDim, newIdx) as number, valueExtent, angleExtent, isClip)
+ }
+ }, seriesModel);
+ group.add(progress);
+ progressList[newIdx] = progress;
+ }
+ })
+ .remove(function (idx) {
+ if (showPointer) {
+ const pointer = oldData.getItemGraphicEl(idx);
+ group.remove(pointer);
+ }
+ if (showProgress) {
+ const progress = oldProgressData[idx];
+ group.remove(progress);
+ }
+ })
+ .execute();
+
+ data.each(function (idx) {
+ const itemModel = data.getItemModel<GaugeDataItemOption>(idx);
+ const emphasisModel = itemModel.getModel('emphasis');
+ if (showPointer) {
+ const pointer = data.getItemGraphicEl(idx) as PointerPath;
+ pointer.useStyle(data.getItemVisual(idx, 'style'));
+ pointer.setStyle(itemModel.getModel(['pointer', 'itemStyle']).getItemStyle());
+ if (pointer.style.fill === 'auto') {
+ pointer.setStyle('fill', getColor(
+ linearMap(data.get(valueDim, idx) as number, valueExtent, [0, 1], true)
+ ));
+ }
+
+ (pointer as ECElement).z2EmphasisLift = 0
+ setStatesStylesFromModel(pointer, itemModel);
+ enableHoverEmphasis(pointer, emphasisModel.get('focus'), emphasisModel.get('blurScope'));
+ }
- setStatesStylesFromModel(pointer, itemModel);
- enableHoverEmphasis(pointer, emphasisModel.get('focus'), emphasisModel.get('blurScope'));
- });
+ if (showProgress) {
+ const progress = progressList[idx];
+ progress.useStyle(data.getItemVisual(idx, 'style'));
+ progress.setStyle(itemModel.getModel(['progress', 'itemStyle']).getItemStyle());
+ setStatesStylesFromModel(progress, itemModel);
+ enableHoverEmphasis(progress, emphasisModel.get('focus'), emphasisModel.get('blurScope'));
+ }
+ });
- this._data = data;
+ this._data = data;
+ this._progressData = progressList;
+ }
+ else {
+ if (!showPointer) {
Review comment:
I think there is no need to check `if (!showPointer)` here. Since in this branch, `showPointer` and `showProgress` are all false.
Also, there is a `removeAll` code above. All the elements have been removed already. Also same issue in the above `add` `update`, `remove` callback
##########
File path: src/chart/gauge/GaugeView.ts
##########
@@ -312,165 +324,296 @@ class GaugeView extends ChartView {
posInfo: PosInfo,
startAngle: number,
endAngle: number,
- clockwise: boolean
+ clockwise: boolean,
+ axisLineWidth: number
) {
const group = this.group;
const oldData = this._data;
+ const oldProgressData = this._progressData;
+ const progressList = [] as graphic.Path[];
- if (!seriesModel.get(['pointer', 'show'])) {
- // Remove old element
- oldData && oldData.eachItemGraphicEl(function (el) {
- group.remove(el);
- });
- return;
- }
-
- const valueExtent = [+seriesModel.get('min'), +seriesModel.get('max')];
- const angleExtent = [startAngle, endAngle];
+ const showPointer = seriesModel.get(['pointer', 'show']);
+ const progressModel = seriesModel.getModel('progress');
+ const showProgress = progressModel.get('show');
const data = seriesModel.getData();
const valueDim = data.mapDimension('value');
+ const minVal = +seriesModel.get('min');
+ const maxVal = +seriesModel.get('max');
+ const valueExtent = [minVal, maxVal];
+ const angleExtent = [startAngle, endAngle];
- data.diff(oldData)
- .add(function (idx) {
- const pointer = new PointerPath({
+ function createPointer(idx: number, angle: number) {
+ const itemModel = data.getItemModel<GaugeDataItemOption>(idx);
+ const pointerModel = itemModel.getModel('pointer');
+ const pointerWidth = parsePercent(pointerModel.get('width'), posInfo.r);
+ const pointerLength = parsePercent(pointerModel.get('length'), posInfo.r);
+
+ const pointerStr = seriesModel.get(['pointer', 'icon']);
+ const pointerOffset = pointerModel.get('offsetCenter');
+ const pointerKeepAspect = pointerModel.get('keepAspect');
+ let pointer;
+ if (pointerStr.indexOf('path://') === 0) {
+ pointer = createSymbol(
+ pointerStr,
+ parsePercent(pointerOffset[0], posInfo.r) - pointerWidth / 2,
+ parsePercent(pointerOffset[1], posInfo.r) - pointerLength,
+ pointerWidth,
+ pointerLength,
+ null,
+ pointerKeepAspect
+ ) as graphic.Path;
+ }
+ else {
+ pointer = new PointerPath({
shape: {
- angle: startAngle
+ angle: -Math.PI / 2,
+ width: parsePercent(pointerModel.get('width'), posInfo.r),
+ r: parsePercent(pointerModel.get('length'), posInfo.r)
}
- });
+ })
+ }
+ pointer.rotation = -(angle + Math.PI / 2);
+ pointer.x = posInfo.cx;
+ pointer.y = posInfo.cy;
+ return pointer;
+ }
- graphic.initProps(pointer, {
- shape: {
- angle: linearMap(data.get(valueDim, idx) as number, valueExtent, angleExtent, true)
- }
- }, seriesModel);
+ function createProgress(idx: number, endAngle: number) {
+ const roundCap = progressModel.get('roundCap');
+ const ProgressPath = roundCap ? Sausage : graphic.Sector;
- group.add(pointer);
- data.setItemGraphicEl(idx, pointer);
- })
- .update(function (newIdx, oldIdx) {
- const pointer = oldData.getItemGraphicEl(oldIdx) as PointerPath;
+ const isOverlap = progressModel.get('overlap');
+ const progressWidth = isOverlap ? progressModel.get('width') : axisLineWidth / data.count();
+ const r0 = isOverlap ? posInfo.r - progressWidth : posInfo.r - (idx + 1) * progressWidth;
+ const r = isOverlap ? posInfo.r : posInfo.r - idx * progressWidth;
+ const progressSilent = progressModel.get('silent');
+ const progress = new ProgressPath({
Review comment:
series already has a `silent` configuration. There is no need to add `silent` in the progress option.
##########
File path: src/chart/gauge/GaugeView.ts
##########
@@ -312,165 +324,296 @@ class GaugeView extends ChartView {
posInfo: PosInfo,
startAngle: number,
endAngle: number,
- clockwise: boolean
+ clockwise: boolean,
+ axisLineWidth: number
) {
const group = this.group;
const oldData = this._data;
+ const oldProgressData = this._progressData;
+ const progressList = [] as graphic.Path[];
- if (!seriesModel.get(['pointer', 'show'])) {
- // Remove old element
- oldData && oldData.eachItemGraphicEl(function (el) {
- group.remove(el);
- });
- return;
- }
-
- const valueExtent = [+seriesModel.get('min'), +seriesModel.get('max')];
- const angleExtent = [startAngle, endAngle];
+ const showPointer = seriesModel.get(['pointer', 'show']);
+ const progressModel = seriesModel.getModel('progress');
+ const showProgress = progressModel.get('show');
const data = seriesModel.getData();
const valueDim = data.mapDimension('value');
+ const minVal = +seriesModel.get('min');
+ const maxVal = +seriesModel.get('max');
+ const valueExtent = [minVal, maxVal];
+ const angleExtent = [startAngle, endAngle];
- data.diff(oldData)
- .add(function (idx) {
- const pointer = new PointerPath({
+ function createPointer(idx: number, angle: number) {
+ const itemModel = data.getItemModel<GaugeDataItemOption>(idx);
+ const pointerModel = itemModel.getModel('pointer');
+ const pointerWidth = parsePercent(pointerModel.get('width'), posInfo.r);
+ const pointerLength = parsePercent(pointerModel.get('length'), posInfo.r);
+
+ const pointerStr = seriesModel.get(['pointer', 'icon']);
+ const pointerOffset = pointerModel.get('offsetCenter');
+ const pointerKeepAspect = pointerModel.get('keepAspect');
+ let pointer;
+ if (pointerStr.indexOf('path://') === 0) {
+ pointer = createSymbol(
+ pointerStr,
+ parsePercent(pointerOffset[0], posInfo.r) - pointerWidth / 2,
+ parsePercent(pointerOffset[1], posInfo.r) - pointerLength,
+ pointerWidth,
+ pointerLength,
+ null,
+ pointerKeepAspect
+ ) as graphic.Path;
+ }
+ else {
+ pointer = new PointerPath({
shape: {
- angle: startAngle
+ angle: -Math.PI / 2,
+ width: parsePercent(pointerModel.get('width'), posInfo.r),
+ r: parsePercent(pointerModel.get('length'), posInfo.r)
}
- });
+ })
+ }
+ pointer.rotation = -(angle + Math.PI / 2);
+ pointer.x = posInfo.cx;
+ pointer.y = posInfo.cy;
+ return pointer;
+ }
- graphic.initProps(pointer, {
- shape: {
- angle: linearMap(data.get(valueDim, idx) as number, valueExtent, angleExtent, true)
- }
- }, seriesModel);
+ function createProgress(idx: number, endAngle: number) {
+ const roundCap = progressModel.get('roundCap');
+ const ProgressPath = roundCap ? Sausage : graphic.Sector;
- group.add(pointer);
- data.setItemGraphicEl(idx, pointer);
- })
- .update(function (newIdx, oldIdx) {
- const pointer = oldData.getItemGraphicEl(oldIdx) as PointerPath;
+ const isOverlap = progressModel.get('overlap');
+ const progressWidth = isOverlap ? progressModel.get('width') : axisLineWidth / data.count();
+ const r0 = isOverlap ? posInfo.r - progressWidth : posInfo.r - (idx + 1) * progressWidth;
+ const r = isOverlap ? posInfo.r : posInfo.r - idx * progressWidth;
+ const progressSilent = progressModel.get('silent');
+ const progress = new ProgressPath({
+ shape: {
+ startAngle: startAngle,
+ endAngle: endAngle,
+ cx: posInfo.cx,
+ cy: posInfo.cy,
+ clockwise: clockwise,
+ r0: r0,
+ r: r
+ },
+ // 是否相应鼠标事件
+ silent: progressSilent
+ });
+ isOverlap && (progress.z2 = maxVal - (data.get(valueDim, idx) as number) % maxVal);
+ return progress;
+ }
- graphic.updateProps(pointer, {
- shape: {
- angle: linearMap(data.get(valueDim, newIdx) as number, valueExtent, angleExtent, true)
+ if (showProgress || showPointer) {
+ data.diff(oldData)
+ .add(function (idx) {
+ if (showPointer) {
+ const pointer = createPointer(idx, startAngle);
+ graphic.initProps(pointer, {
+ rotation: -(linearMap(data.get(valueDim, idx) as number, valueExtent, angleExtent, true) + Math.PI / 2)
+ }, seriesModel);
+ group.add(pointer);
+ data.setItemGraphicEl(idx, pointer);
}
- }, seriesModel);
-
- group.add(pointer);
- data.setItemGraphicEl(newIdx, pointer);
- })
- .remove(function (idx) {
- const pointer = oldData.getItemGraphicEl(idx);
- group.remove(pointer);
- })
- .execute();
-
- data.eachItemGraphicEl(function (pointer: PointerPath, idx) {
- const itemModel = data.getItemModel<GaugeDataItemOption>(idx);
- const pointerModel = itemModel.getModel('pointer');
- const emphasisModel = itemModel.getModel('emphasis');
-
- pointer.setShape({
- x: posInfo.cx,
- y: posInfo.cy,
- width: parsePercent(
- pointerModel.get('width'), posInfo.r
- ),
- r: parsePercent(pointerModel.get('length'), posInfo.r)
- });
- pointer.useStyle(itemModel.getModel('itemStyle').getItemStyle());
+ if (showProgress) {
+ const progress = createProgress(idx, startAngle) as graphic.Sector;
+ const isClip = progressModel.get('clip');
+ graphic.initProps(progress, {
+ shape: {
+ endAngle: linearMap(data.get(valueDim, idx) as number, valueExtent, angleExtent, isClip)
+ }
+ }, seriesModel);
+ group.add(progress);
+ progressList[idx] = progress;
+ }
+ })
+ .update(function (newIdx, oldIdx) {
+ if (showPointer) {
+ const previousPointer = oldData.getItemGraphicEl(oldIdx) as PointerPath;
+ const previousRotate = previousPointer.rotation;
+ group.remove(previousPointer);
Review comment:
Should check if `previousPointer` exists. It's possible to have error when switching the `show` property from false to true.
----------------------------------------------------------------
This is an automated message from the Apache Git Service.
To respond to the message, please log on to GitHub and use the
URL above to go to the specific comment.
For queries about this service, please contact Infrastructure at:
users@infra.apache.org
---------------------------------------------------------------------
To unsubscribe, e-mail: commits-unsubscribe@echarts.apache.org
For additional commands, e-mail: commits-help@echarts.apache.org
[GitHub] [incubator-echarts] echarts-bot[bot] commented on pull request #13416: feat(gauge): modify some default values, support svg pointer, add axisLine.distance/splitLine.distance/progress/anchor/data[i].title/data[i].detail #13216
Posted by GitBox <gi...@apache.org>.
echarts-bot[bot] commented on pull request #13416:
URL: https://github.com/apache/incubator-echarts/pull/13416#issuecomment-706486599


   Thanks for your contribution!
   The community will review it ASAP. In the meanwhile, please checkout [the coding standard](https://echarts.apache.org/en/coding-standard.html) and Wiki about [How to make a pull request](https://github.com/apache/incubator-echarts/wiki/How-to-make-a-pull-request).

   The pull request is marked to be `PR: author is committer` because you are a committer of this project.


----------------------------------------------------------------
This is an automated message from the Apache Git Service.
To respond to the message, please log on to GitHub and use the
URL above to go to the specific comment.

For queries about this service, please contact Infrastructure at:
users@infra.apache.org


---------------------------------------------------------------------
To unsubscribe, e-mail: commits-unsubscribe@echarts.apache.org
For additional commands, e-mail: commits-help@echarts.apache.org
[GitHub] [incubator-echarts] plainheart commented on a change in pull request #13416: feat(gauge): modify some default values, support svg pointer, add axisLine.distance/splitLine.distance/progress/anchor/data[i].title/data[i].detail #13216
Posted by GitBox <gi...@apache.org>.
plainheart commented on a change in pull request #13416:
URL: https://github.com/apache/incubator-echarts/pull/13416#discussion_r502866061


##########
File path: src/chart/gauge/GaugeView.ts
##########
@@ -95,25 +99,26 @@ class GaugeView extends ChartView {
         posInfo: PosInfo
     ) {
         const group = this.group;
-
-        const axisLineModel = seriesModel.getModel('axisLine');
-        const lineStyleModel = axisLineModel.getModel('lineStyle');
-
         const clockwise = seriesModel.get('clockwise');
         let startAngle = -seriesModel.get('startAngle') / 180 * Math.PI;
         let endAngle = -seriesModel.get('endAngle') / 180 * Math.PI;
+        const axisLineModel = seriesModel.getModel('axisLine');
+
+        const roundCap = axisLineModel.get('roundCap');
+        const MainPath = roundCap ? Sausage : graphic.Sector;

Review comment:
       Currently, the `Sector` shape has provided supports to draw corner radius. Using `Sector` should be enough.
   Setting `shape.cornerRadius` and  `shape.innerCornerRadius` to the half of the difference between `shape.r` and `shape.r0` is identical to `roundCap`(Sausage).

   I'm not sure if we should use `Sector` instead of `Sausage`.


----------------------------------------------------------------
This is an automated message from the Apache Git Service.
To respond to the message, please log on to GitHub and use the
URL above to go to the specific comment.

For queries about this service, please contact Infrastructure at:
users@infra.apache.org


---------------------------------------------------------------------
To unsubscribe, e-mail: commits-unsubscribe@echarts.apache.org
For additional commands, e-mail: commits-help@echarts.apache.org
[GitHub] [incubator-echarts] plainheart commented on a change in pull request #13416: feat(gauge): modify some default values, support svg pointer, add axisLine.distance/splitLine.distance/progress/anchor/data[i].title/data[i].detail #13216
Posted by GitBox <gi...@apache.org>.
plainheart commented on a change in pull request #13416:
URL: https://github.com/apache/incubator-echarts/pull/13416#discussion_r503077856


##########
File path: src/chart/gauge/GaugeView.ts
##########
@@ -95,25 +99,26 @@ class GaugeView extends ChartView {
         posInfo: PosInfo
     ) {
         const group = this.group;
-
-        const axisLineModel = seriesModel.getModel('axisLine');
-        const lineStyleModel = axisLineModel.getModel('lineStyle');
-
         const clockwise = seriesModel.get('clockwise');
         let startAngle = -seriesModel.get('startAngle') / 180 * Math.PI;
         let endAngle = -seriesModel.get('endAngle') / 180 * Math.PI;
+        const axisLineModel = seriesModel.getModel('axisLine');
+
+        const roundCap = axisLineModel.get('roundCap');
+        const MainPath = roundCap ? Sausage : graphic.Sector;

Review comment:
       Looks like the arc angle is not 360 degrees(a circle)? Is there something wrong with the startAngle and endAngle?
   If it's a circle, the path should be closed.


----------------------------------------------------------------
This is an automated message from the Apache Git Service.
To respond to the message, please log on to GitHub and use the
URL above to go to the specific comment.

For queries about this service, please contact Infrastructure at:
users@infra.apache.org


---------------------------------------------------------------------
To unsubscribe, e-mail: commits-unsubscribe@echarts.apache.org
For additional commands, e-mail: commits-help@echarts.apache.org