You are viewing a plain text version of this content. The canonical link for it is here.
Posted to commits@echarts.apache.org by GitBox <gi...@apache.org> on 2020/01/13 08:46:29 UTC
[GitHub] [incubator-echarts] Leesson opened a new issue #12030: dataZoom在X轴为time类型的曲线图展示错误
Leesson opened a new issue #12030: dataZoom在X轴为time类型的曲线图展示错误
URL: https://github.com/apache/incubator-echarts/issues/12030
### Version
4.6.0
### Steps to reproduce
https://codepen.io/Leesson/pen/rNaKLXm
### What is expected?
dataZoom中数据分布与表中曲线保持一致,按照时间分布。而不是根据传入的data数量平均分布
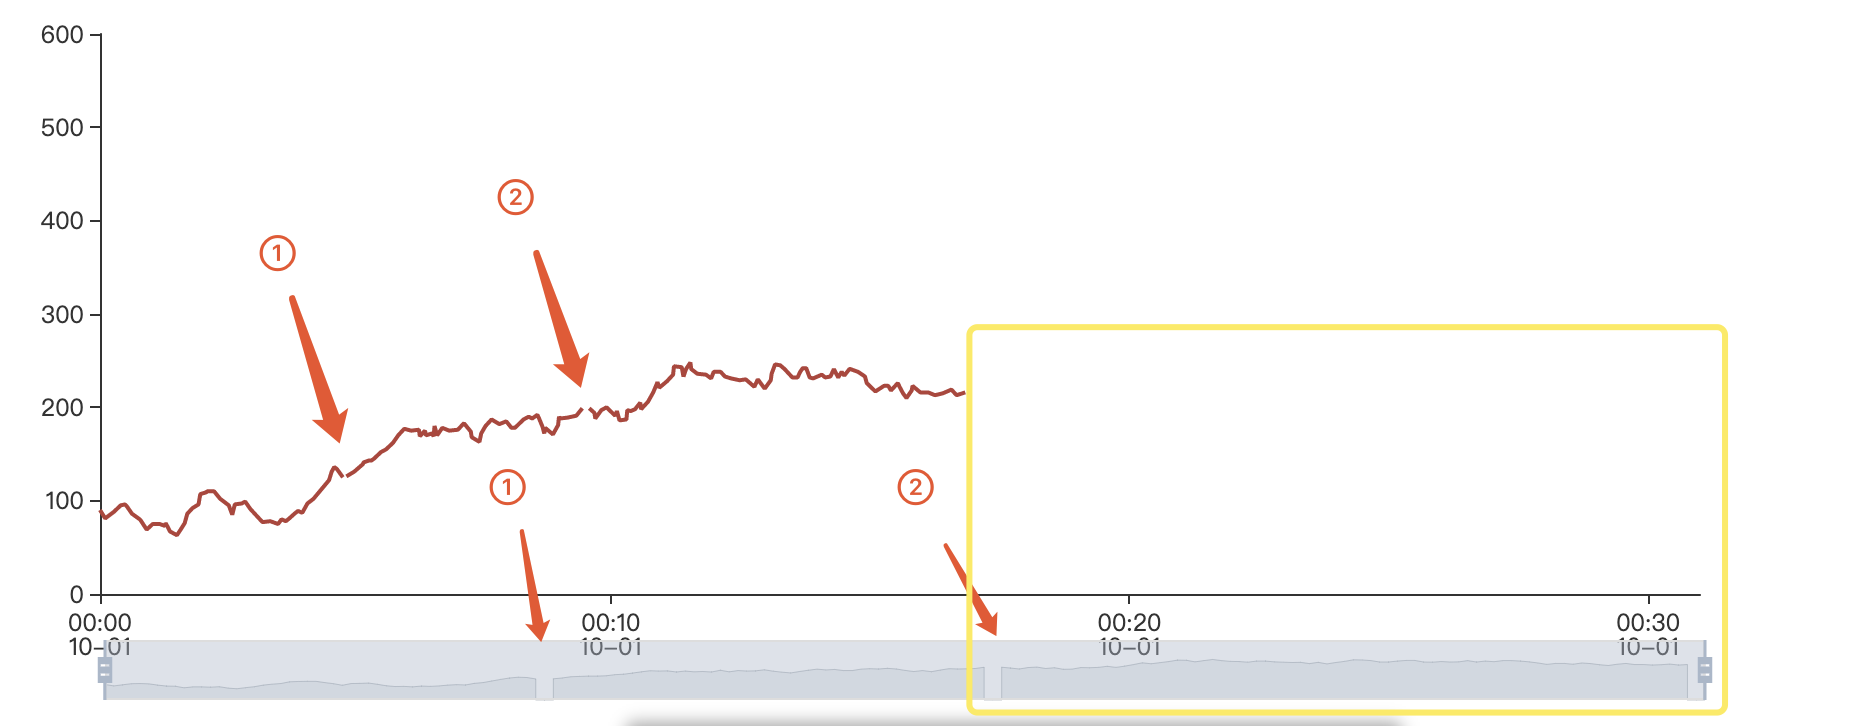
### What is actually happening?
dataZoom的数据分布和曲线图不一致,不是按照时间分布。看效果像是dataZoom将传入的data根据数量平均分布在X方向,导致数据和时间不对应。曲线图后边没有数据的部分占据了X轴将近二分之一,但在dataZoom中只占据了很短一段(dataZoom中value和时间的对应关系错误)
<!-- This issue is generated by echarts-issue-helper. DO NOT REMOVE -->
----------------------------------------------------------------
This is an automated message from the Apache Git Service.
To respond to the message, please log on to GitHub and use the
URL above to go to the specific comment.
For queries about this service, please contact Infrastructure at:
users@infra.apache.org
With regards,
Apache Git Services
---------------------------------------------------------------------
To unsubscribe, e-mail: commits-unsubscribe@echarts.apache.org
For additional commands, e-mail: commits-help@echarts.apache.org
[GitHub] [incubator-echarts] echarts-bot[bot] commented on issue #12030: dataZoom在X轴为time类型的曲线图展示错误
Posted by GitBox <gi...@apache.org>.
echarts-bot[bot] commented on issue #12030: dataZoom在X轴为time类型的曲线图展示错误
URL: https://github.com/apache/incubator-echarts/issues/12030#issuecomment-573560965


   Hi! We've received your issue and please be patient to get responded. 🎉
   The average response time is expected to be within one day for weekdays.

   In the meanwhile, please make sure that **you have posted enough image to demo your request**. You may also check out the [API](http://echarts.apache.org/api.html) and [chart option](http://echarts.apache.org/option.html) to get the answer.

   If you don't get helped for a long time (over a week) or have an urgent question to ask, you may also send an email to dev@echarts.apache.org. Please attach the issue link if it's a technical questions.

   If you are interested in the project, you may also subscribe our [mail list](https://echarts.apache.org/en/maillist.html).

   Have a nice day! 🍵

----------------------------------------------------------------
This is an automated message from the Apache Git Service.
To respond to the message, please log on to GitHub and use the
URL above to go to the specific comment.

For queries about this service, please contact Infrastructure at:
users@infra.apache.org


With regards,
Apache Git Services

---------------------------------------------------------------------
To unsubscribe, e-mail: commits-unsubscribe@echarts.apache.org
For additional commands, e-mail: commits-help@echarts.apache.org
[GitHub] [echarts] zhenghuihuang commented on issue #12030: dataZoom在X轴为time类型的曲线图展示错误
Posted by GitBox <gi...@apache.org>.
zhenghuihuang commented on issue #12030:
URL: https://github.com/apache/echarts/issues/12030#issuecomment-924015775


   请问您后来解决了吗,我也遇到相同的问题


--
This is an automated message from the Apache Git Service.
To respond to the message, please log on to GitHub and use the
URL above to go to the specific comment.

To unsubscribe, e-mail: commits-unsubscribe@echarts.apache.org

For queries about this service, please contact Infrastructure at:
users@infra.apache.org


---------------------------------------------------------------------
To unsubscribe, e-mail: commits-unsubscribe@echarts.apache.org
For additional commands, e-mail: commits-help@echarts.apache.org