You are viewing a plain text version of this content. The canonical link for it is here.
Posted to notifications@apisix.apache.org by yi...@apache.org on 2022/03/02 10:52:23 UTC
[apisix-website] branch master updated: docs: add opentelemetry plugin blog. (#922)
This is an automated email from the ASF dual-hosted git repository.
yilinzeng pushed a commit to branch master
in repository https://gitbox.apache.org/repos/asf/apisix-website.git
The following commit(s) were added to refs/heads/master by this push:
new 0845217 docs: add opentelemetry plugin blog. (#922)
0845217 is described below
commit 0845217b55f8f9207768ec35c66c93e524bebb10
Author: homeward <97...@users.noreply.github.com>
AuthorDate: Wed Mar 2 18:52:17 2022 +0800
docs: add opentelemetry plugin blog. (#922)
---
.../28/apisix-integration-opentelemetry-plugin.md | 329 +++++++++++++++++++++
.../28/apisix-integration-opentelemetry-plugin.md | 329 +++++++++++++++++++++
2 files changed, 658 insertions(+)
diff --git a/website/blog/2022/02/28/apisix-integration-opentelemetry-plugin.md b/website/blog/2022/02/28/apisix-integration-opentelemetry-plugin.md
new file mode 100644
index 0000000..d3f0911
--- /dev/null
+++ b/website/blog/2022/02/28/apisix-integration-opentelemetry-plugin.md
@@ -0,0 +1,329 @@
+---
+title: "Upgrade of observability capabilities, API Gateway Apache APISIX integrates OpenTelemetry"
+authors:
+ - name: "Haochao Zhuang"
+ title: "Author"
+ url: "https://github.com/dmsolr"
+ image_url: "https://avatars.githubusercontent.com/u/29735230?v=4"
+ - name: "Fei Han"
+ title: "Technical Writer"
+ url: "https://github.com/hf400159"
+ image_url: "https://avatars.githubusercontent.com/u/97138894?v=4"
+keywords:
+- Apache APISIX
+- API Gateway
+- OpenTelemetry
+- Observability
+- Ecosystem
+description: This article introduces you to the Apache APISIX `opentelemetry` plugin concept and how to enable and deploy the `opentelemetry` plugin.
+tags: [Technology,Ecosystem,Observability]
+---
+
+> This article introduces you to the Apache APISIX `opentelemetry` plugin concept and how to enable and deploy the `opentelemetry` plugin.
+
+<!--truncate-->
+
+## Background Information
+
+Apache APISIX is a dynamic, real-time, high-performance API gateway that provides rich traffic management features such as load balancing, dynamic upstream, canary release, circuit breaking, authentication, observability, and more. It not only has many useful plugins, but also supports plugin dynamic change and hot swap.
+
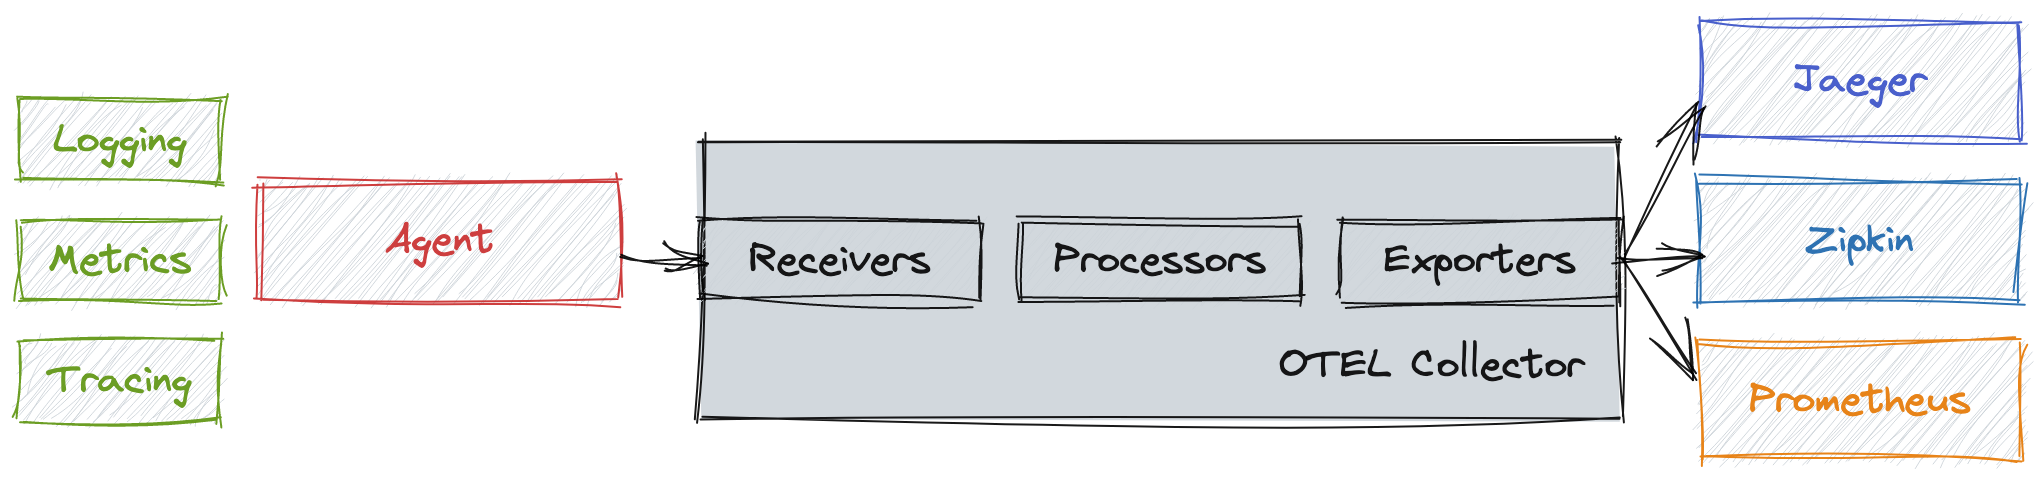
+OpenTelemetry is an open source telemetry data acquisition and processing system. It not only provides various SDKS for application side telemetry data collection and reporting, but also data collection side for data receiving, processing and exporting. Export to any or more OpenTelemetry backends, such as Jaeger, Zipkin, and OpenCensus, by configuration. You can view the list of plug-ins that have adapted the OpenTelemetry Collector in the opentelemetry collector contrib library.
+
+
+
+## Plugin Introduction
+
+The `opentelemetry` plugin of Apache APISIX implements Tracing data collection based on OpenTelemetry native standard ([OTLP/HTTP](https://github.com/open-telemetry/opentelemetry-specification/blob/main/specification/protocol/otlp.md#otlphttp-request)), and sends it to OpenTelemetry Collector through HTTP protocol. This feature will be supported online in Apache APISIX 2.13.0.
+
+Since the Agent/SDK of OpenTelemetry has nothing to do with the back-end implementation, when the application integrates the Agent/SDK of OpenTelemetry, the user can easily and freely change the observability backend service without any perception on the application side, such as switching from Zipkin into Jaeger.
+
+The `opentelemetry`plug-in integrates the OpenTelemetry Agent/SDK in Apache APISIX, which can collect traced requests, generate trace and forward them to the OpenTelemetry Collector.
+
+The `opentelemetry` plugin is located on the Agent side in the above figure, but currently only supports the `trace` part, and does not support the `logs` and `metrics` protocols of OpenTelemetry.
+
+## How to Use
+
+### Enable Plugin
+
+You need to enable `opentelemetry` plugin and modify collector configuration in `conf/config.yaml` configuration file.
+
+It is assumed that you have already deployed the OpenTelemetry Collector and enabled the [OTLP HTTP Receiver](https://github.com/open-telemetry/opentelemetry-collector/blob/main/receiver/otlpreceiver/README.md).
+
+> If you have not completed the deployment, you can refer to the Scenario Example section in the next section to complete the deployment of OpenTelemetry Collector.
+
+The default port of the OTLP HTTP Receiver is `4318`, and the address of `collector` is the HTTP Receiver address of the OpenTelemetry Collector. For related fields, please refer to the [Apache APISIX official documentation](https://apisix.apache.org/zh/docs/apisix/next/plugins/opentelemetry/).
+
+ ```YAML
+ plugins
+ ... # Other plugins that have been enabled
+ - opentelemetry
+plugin_attr:
+ ...
+ opentelemetry:
+ trace_id_source: x-request-id
+ resource:
+ service.name: APISIX
+ collector:
+ address: 127.0.0.1:4318 # OTLP HTTP Receiver address
+ request_timeout: 3
+ ```
+
+#### Method 1: Bind the plugin to the specified route
+
+In order to show the test effect more conveniently, `sampler` is temporarily set to full sampling in the example to ensure that `trace` data is generated after each request is traced, so that you can view `trace` related data on the Web UI. You can also set relevant parameters according to the actual situation.
+
+ ```Shell
+ curl http://127.0.0.1:9080/apisix/admin/routes/1 \
+ -H 'X-API-KEY: edd1c9f034335f136f87ad84b625c8f1' \
+ -X PUT -d '
+{
+ "uri": "/get",
+ "plugins": {
+ "opentelemetry": {
+ "sampler": {
+ "name": "always_on"
+ }
+ }
+ },
+ "upstream": {
+ "type": "roundrobin",
+ "nodes": {
+ "httpbin.org:80": 1
+ }
+ }
+}'
+ ```
+
+#### Method 2: Set Global Rules
+
+You can also enable `opentelemetry` plugin through the Apache APISIX Plugins feature. After the global configuration is complete, you still need to create the route, otherwise it will not be possible to test.
+
+ ```Shell
+ curl 'http://127.0.0.1:9080/apisix/admin/global_rules/1' \
+-H 'X-API-KEY: edd1c9f034335f136f87ad84b625c8f1' \
+-X PUT -d '{
+ "plugins": {
+ "opentelemetry": {
+ "sampler": {
+ "name": "always_on"
+ }
+ }
+ }
+}'
+ ```
+
+#### Method 3: Customize labels for Span through `additional_attributes`
+
+For the configuration of `sampler` and `additional_attributes`, you can refer to the [Apache APISIX official documentation](https://apisix.apache.org/docs/apisix/next/plugins/opentelemetry/#attributes), where `additional_attributes` is a series of `Key:Value` key value pairs, you can use it to customize the label for Span, and can follow Span to display on the Web UI. Add `route_id` and `http_x-custom-ot-key` to the span of a route through `additional_attributes`, you can refer to the fo [...]
+
+ ```Shell
+curl http://127.0.0.1:9080/apisix/admin/routes/1001 \
+ -H 'X-API-KEY: edd1c9f034335f136f87ad84b625c8f1' \
+ -X PUT -d '
+{
+ "uri": "/put",
+ "plugins": {
+ "opentelemetry": {
+ "sampler": {
+ "name": "always_on"
+ },
+ "additional_attributes":[
+ "route_id",
+ "http_x-custom-ot-key"
+ ]
+ }
+ },
+ "upstream": {
+ "type": "roundrobin",
+ "nodes": {
+ "httpbin.org:80": 1
+ }
+ }
+}'
+ ```
+
+### Test Example
+
+You can enable `opentelemetry` plugin in any of the above three methods. The following example uses the example of method three to create a route. After the creation is successful, you can refer to the following commands to access the route:
+
+```Shell
+curl -X PUT -H `x-custom-ot-key: test-ot-val` http://127.0.0.1:9080/put
+```
+
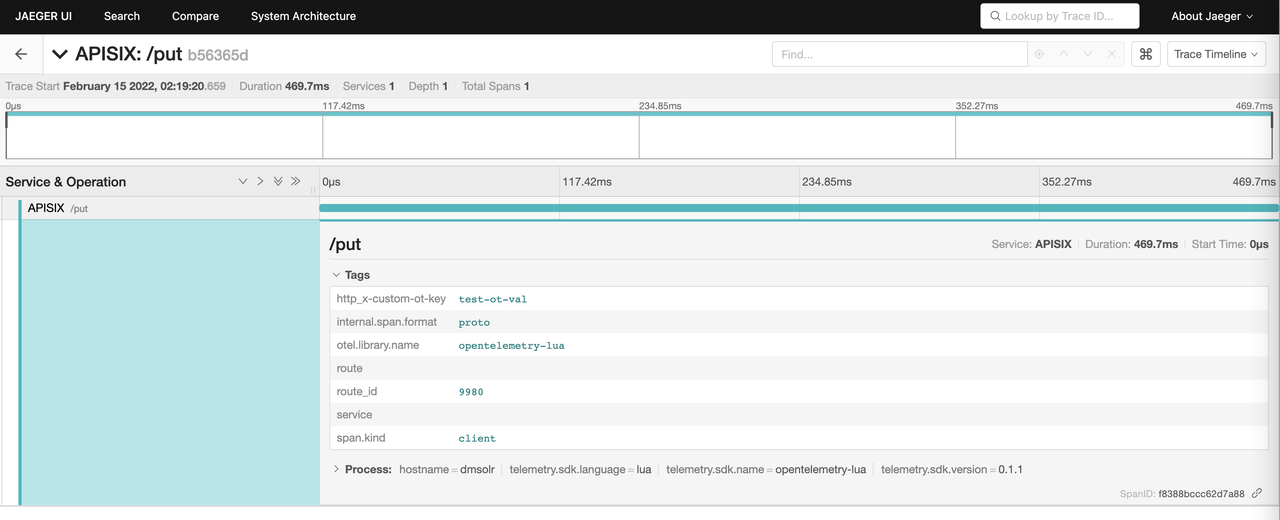
+After the access is successful, you can see the details of the span similar to `/put` in the Jaeger UI, and you can see that the custom tags in the route are displayed in the Tags list: `http_x-custom-ot-key` and `route_id`.
+
+
+
+You need to note that the `additional_attributes` configuration is set to take values from Apache APISIX and Nginx variables as `attribute` values, so `additional_attributes` must be a valid Apache APISIX or Nginx variable. It also includes HTTP Header, but when fetching `http_header`, you need to add `http_` as the prefix of the variable name. If the variable does not exist, the `tag` will not be displayed.
+
+### Scenario Example
+
+This scenario example deploys Collector, Jaeger, and Zipkin as backend services by simply modifying the official example of OpenTelemetry Collector, and starts two sample applications (Client and Server), where Server provides an HTTP service, and Client will cyclically call the server provided by the server. HTTP interface, resulting in a call chain consisting of two spans.
+
+#### Step 1: Deploy OpenTelemetry
+
+The following uses `docker-compose` as an example. For other deployments, please refer to the [OpenTelemetry official documentation](https://opentelemetry.io/docs/collector/getting-started/).
+
+You can refer to the following command to deploy:
+
+ ```Shell
+git clone https://github.com/open-telemetry/opentelemetry-collector-contrib.git
+cd opentelemetry-collector-contrib/examples/demo
+docker-compose up -d
+ ```
+
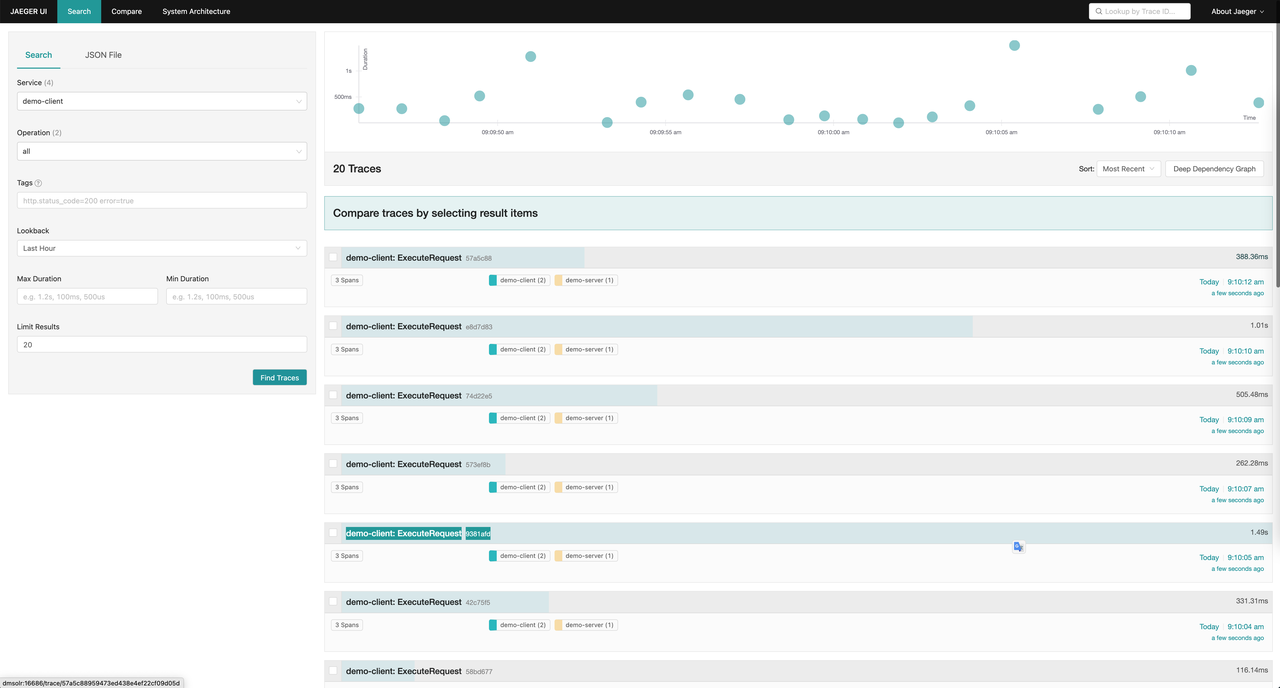
+Enter `http://127.0.0.1:16886` (Jaeger UI) or `http://127.0.0.1:9411/zipkin` (Zipkin UI) in the browser. If it can be accessed normally, the deployment is successful.
+
+The following figure shows an example of successful access:
+
+
+
+
+
+#### Step 2: Configure the Test Environment
+
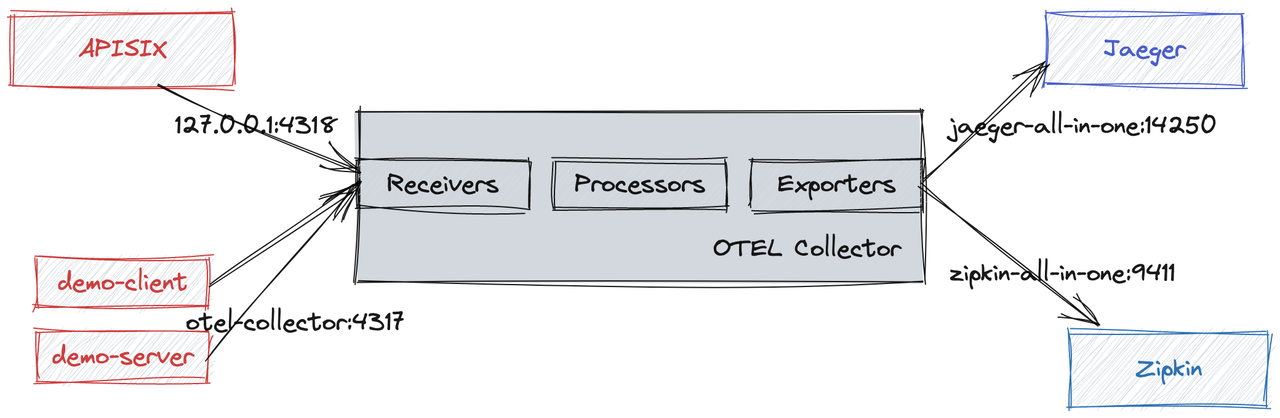
+The Apache APISIX service is introduced, and the topology of the final application is shown in the following figure:
+
+
+
+The Trace data reporting process is as follows. Among them, since Apache APISIX is deployed separately and not in the network of docker-compose, Apache APISIX accesses the OTLP HTTP Receiver of OpenTelemetery Collector through the locally mapped port (`127.0.0.1:4138`).
+
+
+
+You need to make sure you have enabled the `opentelemetry` plugin and reload Apache APISIX.
+
+1. You can refer to the following example to create a route and enable the `opentelemetry` plugin for sampling:
+
+ ```Shell
+ curl http://127.0.0.1:9080/apisix/admin/routes/1 \
+ -H 'X-API-KEY: edd1c9f034335f136f87ad84b625c8f1' \
+ -X PUT -d '
+ {
+ "uri": "/hello",
+ "plugins": {
+ "opentelemetry": {
+ "sampler": {
+ "name": "always_on",
+ }
+ }
+ },
+ "upstream": {
+ "type": "roundrobin",
+ "nodes": {
+ "127.0.0.1:7080": 1
+ }
+ }
+ }'
+ ```
+
+2. Modify the `./examples/demo/otel-collector-config.yaml` file and add the OTLP HTTP Receiver as follows:
+
+ ```Shell
+ receivers:
+ otlp:
+ protocols:
+ grpc:
+ http:${ip:port} # add OTLP HTTP Receiver,default port is 4318
+ ```
+
+3. Modify `docker-compose.yaml`.
+
+You need to modify the configuration file, change the interface address of Client calling Server to the address of Apache APISIX, and map the ports of OTLP HTTP Receiver and Server services to local.
+
+The following example is the complete docker-compose.yaml after the configuration is modified:
+
+ ```YAML
+version: "2"
+services:
+
+ # Jaeger
+ jaeger-all-in-one:
+ image: jaegertracing/all-in-one:latest
+ ports:
+ - "16686:16686" # jaeger ui port
+ - "14268"
+ - "14250"
+
+ # Zipkin
+ zipkin-all-in-one:
+ image: openzipkin/zipkin:latest
+ ports:
+ - "9411:9411"
+
+ # Collector
+ otel-collector:
+ image: ${OTELCOL_IMG}
+ command: ["--config=/etc/otel-collector-config.yaml", "${OTELCOL_ARGS}"]
+ volumes:
+ - ./otel-collector-config.yaml:/etc/otel-collector-config.yaml
+ ports:
+ - "1888:1888" # pprof extension
+ - "8888:8888" # Prometheus metrics exposed by the collector
+ - "8889:8889" # Prometheus exporter metrics
+ - "13133:13133" # health_check extension
+ - "4317" # OTLP gRPC receiver
+ - "4318:4318" # Add OTLP HTTP Receiver port mapping
+ - "55670:55679" # zpages extension
+ depends_on:
+ - jaeger-all-in-one
+ - zipkin-all-in-one
+
+ demo-client:
+ build:
+ dockerfile: Dockerfile
+ context: ./client
+ environment:
+ - OTEL_EXPORTER_OTLP_ENDPOINT=otel-collector:4317
+ - DEMO_SERVER_ENDPOINT=http://172.17.0.1:9080/hello # APISIX address
+ depends_on:
+ - demo-server
+
+ demo-server:
+ build:
+ dockerfile: Dockerfile
+ context: ./server
+ environment:
+ - OTEL_EXPORTER_OTLP_ENDPOINT=otel-collector:4317
+ ports:
+ - "7080:7080" # Map the Server port to the host
+ depends_on:
+ - otel-collector
+
+ prometheus:
+ container_name: prometheus
+ image: prom/prometheus:latest
+ volumes:
+ - ./prometheus.yaml:/etc/prometheus/prometheus.yml
+ ports:
+ - "9090:9090"
+ ```
+
+It should be noted that demo-client.environment.DEMO_SERVER_ENDPOINT needs to be changed to your Apache APISIX address, and ensure that it can be accessed normally in the container.
+
+Of course, you can also deploy Apache APISIX through docekr-compose.yaml. For details, please refer to the [Apache APISIX official documentation](https://github.com/apache/apisix-docker/blob/master/docs/en/latest/example.md).
+
+#### Step 3: Test
+
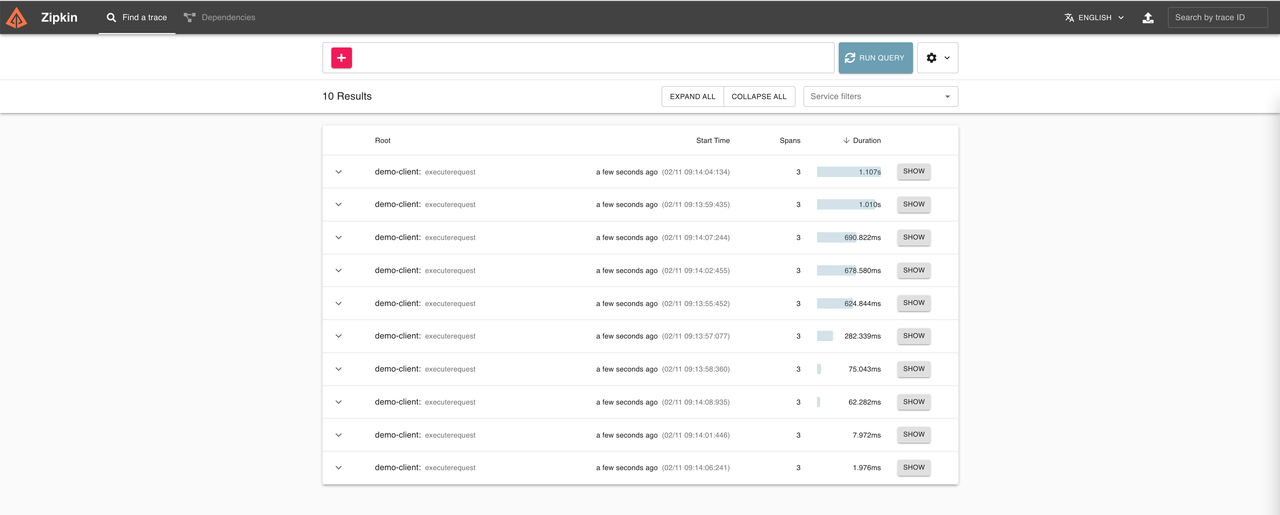
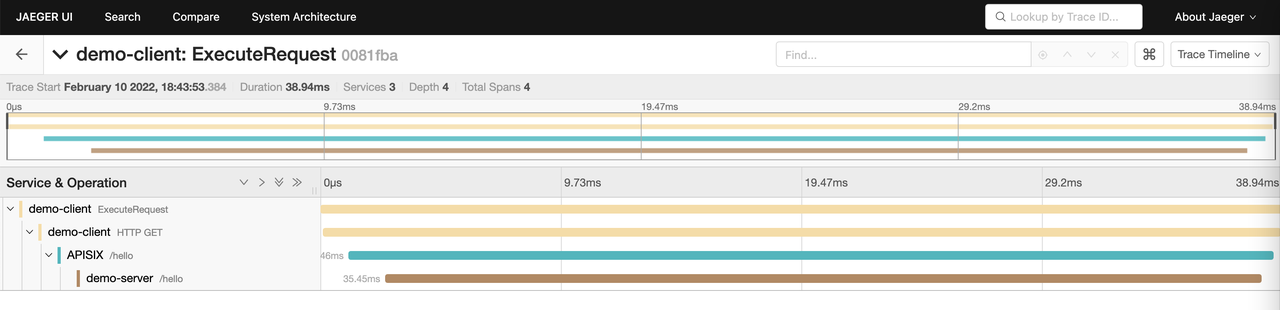
+After the redeployment is completed, you can access the Jaeger UI or Zipkin UI to see that the Span of APISIX is included in the Trace, as shown below:
+
+
+
+
+
+## Disable Plugin
+
+If you do not need trace collection of a route temporarily, you only need to modify the route configuration and delete the related configuration of `opentelemetry` under `plugins` in the configuration.
+
+You can only remove the configuration of the `opentelemetry` global plugin if you enabled it globally by binding Global Rules.
+
+## Summary
+
+After Apache APISIX integrates OpenTelemetery, it can easily connect with most mainstream Trace systems on the market with the help of OpenTelemetry's rich plug-ins. In addition, Apache APISIX has also implemented SkyWalking and Zipkin native standard protocol plug-ins, and is also actively cooperating with major communities to create a more powerful ecosystem.
+
+Apache APISIX is also currently working on additional plugins to support integration with more services, so if you're interested, feel free to start a discussion thread in our GitHub Discussion or communicate via the mailing list.
+
+## Related articles
+
+- [The observability of Apache APISIX](https://apisix.apache.org/blog/2021/11/04/skywalking/)
+
+- [Integrating Splunk HTTP Event Collector with API Gateway](https://apisix.apache.org/blog/2022/02/10/apisix-splunk-integration/)
diff --git a/website/i18n/zh/docusaurus-plugin-content-blog/2022/02/28/apisix-integration-opentelemetry-plugin.md b/website/i18n/zh/docusaurus-plugin-content-blog/2022/02/28/apisix-integration-opentelemetry-plugin.md
new file mode 100644
index 0000000..a683037
--- /dev/null
+++ b/website/i18n/zh/docusaurus-plugin-content-blog/2022/02/28/apisix-integration-opentelemetry-plugin.md
@@ -0,0 +1,329 @@
+---
+title: "可观测性能力升级,API 网关 Apache APISIX 集成 OpenTelemetry"
+authors:
+ - name: "庄浩潮"
+ title: "Author"
+ url: "https://github.com/dmsolr"
+ image_url: "https://avatars.githubusercontent.com/u/29735230?v=4"
+ - name: "韩飞"
+ title: "Technical Writer"
+ url: "https://github.com/hf400159"
+ image_url: "https://avatars.githubusercontent.com/u/97138894?v=4"
+keywords:
+- Apache APISIX
+- API Gateway
+- OpenTelemetry
+- Observability
+- Ecosystem
+description: 本文为您介绍了 API 网关 Apache APISIX 中的 opentelemetry 插件的概念以及如何部署 opentelemetry 插件。
+tags: [Technology,Ecosystem,Observability]
+---
+
+> 本文为您介绍了 API 网关 Apache APISIX 中的 `opentelemetry` 插件的概念以及如何部署 `opentelemetry` 插件。
+
+<!--truncate-->
+
+## 背景信息
+
+Apache APISIX 是一个动态、实时、高性能的 API 网关,提供负载均衡、动态上游、灰度发布、服务熔断、身份认证、可观测性等丰富的流量管理功能。作为 API 网关,Apache APISIX 不仅拥有众多实用的插件,而且支持插件动态变更和热插拔。
+
+OpenTelemetry 是一个开源的遥测数据采集和处理系统,它不仅提供了各种 SDK 用于应用端遥测数据的收集和上报,以及数据收集端用于数据接收、加工和导出,还支持通过配置导出到任意一个或者多个已经适配 OpenTelemetry Exporter 的后端,比如 Jaeger、Zipkin、OpenCensus 等。您可以在 opentelemetry collector contrib 库中查看已经适配 OpenTelemetry Collector 的插件列表。
+
+
+
+## 插件介绍
+
+Apache APISIX `opentelemetry` 插件是基于 OpenTelemetry 原生标准([OTLP/HTTP](https://github.com/open-telemetry/opentelemetry-specification/blob/main/specification/protocol/otlp.md#otlphttp-request))实现的 Tracing 数据采集,并通过 HTTP 协议发送至 OpenTelemetry Collector。该功能将在 Apache APISIX 2.13.0 版本中上线支持。
+
+由于 OpenTelemetry 的 Agent/SDK 与后端实现无关,当应用集成了 OpenTelemetry 的 Agent/SDK 之后,用户能够在应用侧无感知的情况下轻松地、自由地变更可观测性后端服务,比如从 Zipkin 切换成 Jaeger。
+
+`opentelemetry` 插件在 Apache APISIX 中集成了 OpenTelemetry Agent/SDK,可以实现采集被追踪的请求生成 trace 后转发到 OpenTelemetry Collector。
+
+`opentelemetry` 插件位于上图中的 Agent 侧,但目前仅支持 `trace` 协议,还不支持 OpenTelemetry 的 `logs` 和 `metrics` 协议。
+
+## 如何使用
+
+### 启用插件
+
+您需要在 `conf/config.yaml` 配置文件中启用 `opentelemetry` 插件并修改 `collector` 配置。
+
+假设您已经完成 OpenTelemetry Collector 的部署,并且启用了 [OTLP HTTP Receiver](https://github.com/open-telemetry/opentelemetry-collector/blob/main/receiver/otlpreceiver/README.md)。
+
+> 如果您未完成部署,可参考下一节的场景示例部分,完成 OpenTelemetry Collector 的部署。
+
+其中 OTLP HTTP Receiver 的默认端口为`4318`,`collector` 的地址为 OpenTelemetry Collector 的 HTTP Receiver 地址,相关字段可参考 [Apache APISIX 官方文档](https://apisix.apache.org/zh/docs/apisix/next/plugins/opentelemetry/)。
+
+ ```YAML
+ plugins
+ ... # 已经启用的其它插件
+ - opentelemetry
+plugin_attr:
+ ...
+ opentelemetry:
+ trace_id_source: x-request-id
+ resource:
+ service.name: APISIX
+ collector:
+ address: 127.0.0.1:4318 # OTLP HTTP Receiver 地址
+ request_timeout: 3
+ ```
+
+#### 方法一:将插件绑定到指定路由
+
+为了更方便的展示测试效果,示例中暂时将 `sampler` 设置为全采样,以确保每次请求都被追踪后产生 `trace` 数据,方便您在 Web UI 上查看 `trace` 的相关数据。您也可以根据实际情况,设置相关参数。
+
+ ```Shell
+ curl http://127.0.0.1:9080/apisix/admin/routes/1 \
+ -H 'X-API-KEY: edd1c9f034335f136f87ad84b625c8f1' \
+ -X PUT -d '
+{
+ "uri": "/get",
+ "plugins": {
+ "opentelemetry": {
+ "sampler": {
+ "name": "always_on"
+ }
+ }
+ },
+ "upstream": {
+ "type": "roundrobin",
+ "nodes": {
+ "httpbin.org:80": 1
+ }
+ }
+}'
+ ```
+
+#### 方式二:设置 Global Rules
+
+您也可以通过 Apache APISIX Plugins 功能启用 `opentelemetry` 插件。完成全局配置后,您仍然需要创建路由,否则将无法进行测试。
+
+ ```Shell
+ curl 'http://127.0.0.1:9080/apisix/admin/global_rules/1' \
+-H 'X-API-KEY: edd1c9f034335f136f87ad84b625c8f1' \
+-X PUT -d '{
+ "plugins": {
+ "opentelemetry": {
+ "sampler": {
+ "name": "always_on"
+ }
+ }
+ }
+}'
+ ```
+
+#### 方式三:通过 `additional_attributes` 为 Span 自定义标签
+
+关于 `sampler` 和 `additional_attributes` 的配置您可以参考 [Apache APISIX 官方文档](https://apisix.apache.org/zh/docs/apisix/next/plugins/opentelemetry/),其中 `additional_attributes` 是一系列的 `Key:Value` 键值对,您可以使用它为 Span 自定义标签,并且可以跟随 Span 在 Web UI 上展示。通过 `additional_attributes` 为某个路由的 Span 增加 `route_id` 和 `http_x-custom-ot-key`,可以参考如下配置:
+
+ ```Shell
+curl http://127.0.0.1:9080/apisix/admin/routes/1001 \
+ -H 'X-API-KEY: edd1c9f034335f136f87ad84b625c8f1' \
+ -X PUT -d '
+{
+ "uri": "/put",
+ "plugins": {
+ "opentelemetry": {
+ "sampler": {
+ "name": "always_on"
+ },
+ "additional_attributes":[
+ "route_id",
+ "http_x-custom-ot-key"
+ ]
+ }
+ },
+ "upstream": {
+ "type": "roundrobin",
+ "nodes": {
+ "httpbin.org:80": 1
+ }
+ }
+}'
+ ```
+
+### 测试示例
+
+您可以通过以上三种方式中的任意一种方式启用 `opentelemetry`,以下示例使用方式三的方法创建路由,创建成功后,您可以参考如下命令访问路由:
+
+```Shell
+curl -X PUT -H `x-custom-ot-key: test-ot-val` http://127.0.0.1:9080/put
+```
+
+访问成功之后,您可以在 Jaeger UI 中看到类似如下图所示 /put 的 Span 详情,并可以看到 Tags 列表中展示了路由中自定义的 tag:`http_x-custom-ot-key` 和 `route_id`。
+
+
+
+您需要注意,`additional_attributes` 配置的设定是从 Apache APISIX 和 Nginx 变量取值作为 `attribute` 的值,因此 `additional_attributes` 必须是 Apache APISIX 或者 Nginx 的有效变量。其中也包括 HTTP Header,但是在取 `http_header` 时,需要添加 `http_` 作为变量名的前缀。如果变量不存在,就不会展示这个 `tag` 了。
+
+### 场景示例
+
+本场景示例通过简单修改 OpenTelemetry Collector 官方示例部署 Collector、Jaeger 和 Zipkin 作为后端服务,并且启动两个示例应用程序(Client 和 Server),其中 Server 提供了一个 HTTP 服务,而 Client 会循环调用 Server 提供的 HTTP 接口,从而产生包括两个 Span 的调用链。
+
+#### 步骤一:部署 OpenTelemetry
+
+以下使用 `docker-compose` 作为示例,其它部署可以参考 [OpenTelemetry 官方文档](https://opentelemetry.io/docs/collector/getting-started/)。
+
+您可以参考如下命令部署:
+
+ ```Shell
+git clone https://github.com/open-telemetry/opentelemetry-collector-contrib.git
+cd opentelemetry-collector-contrib/examples/demo
+docker-compose up -d
+ ```
+
+在浏览器中输入 `http://127.0.0.1:16886`(Jaeger UI)或者 `http://127.0.0.1:9411/zipkin`(Zipkin UI),如果可以正常访问,则表示部署成功。
+
+下图为访问成功示例:
+
+
+
+
+
+#### 步骤二:配置测试环境
+
+引入 Apache APISIX 服务,最终应用的拓扑如下图所示:
+
+
+
+Trace 数据上报流程如下。其中由于 Apache APISIX 是单独部署的,并不在 `docker-compose` 的网络内,所以 Apache APISIX 是通过本地映射的端口(即 `127.0.0.1:4138`)访问到 OpenTelemetery Collector 的 OTLP HTTP Receiver 的。
+
+
+
+您需要确保已经启用 `opentelemetry` 插件,并重新加载 Apache APISIX。
+
+1. 您可以参考如下示例创建一个路由,并且启用 `opentelemetry` 插件进行采样:
+
+ ```Shell
+ curl http://127.0.0.1:9080/apisix/admin/routes/1 \
+ -H 'X-API-KEY: edd1c9f034335f136f87ad84b625c8f1' \
+ -X PUT -d '
+ {
+ "uri": "/hello",
+ "plugins": {
+ "opentelemetry": {
+ "sampler": {
+ "name": "always_on",
+ }
+ }
+ },
+ "upstream": {
+ "type": "roundrobin",
+ "nodes": {
+ "127.0.0.1:7080": 1
+ }
+ }
+ }'
+ ```
+
+2. 修改 `./examples/demo/otel-collector-config.yaml` 文件,并添加 OTLP HTTP Receiver,如下所示:
+
+ ```Shell
+ receivers:
+ otlp:
+ protocols:
+ grpc:
+ http:${ip:port} # 添加 OTLP HTTP Receiver,默认端口为 4318
+ ```
+
+3. 修改 `docker-compose.yaml`。
+
+您需要修改配置文件,把 Client 调用 Server 的接口地址修改为 Apache APISIX 的地址,将 OTLP HTTP Receiver 和 Server 服务的端口映射到本地。
+
+以下示例是修改配置后完整的 `docker-compose.yaml`:
+
+ ```YAML
+version: "2"
+services:
+
+ # Jaeger
+ jaeger-all-in-one:
+ image: jaegertracing/all-in-one:latest
+ ports:
+ - "16686:16686" # jaeger ui 的端口
+ - "14268"
+ - "14250"
+
+ # Zipkin
+ zipkin-all-in-one:
+ image: openzipkin/zipkin:latest
+ ports:
+ - "9411:9411"
+
+ # Collector
+ otel-collector:
+ image: ${OTELCOL_IMG}
+ command: ["--config=/etc/otel-collector-config.yaml", "${OTELCOL_ARGS}"]
+ volumes:
+ - ./otel-collector-config.yaml:/etc/otel-collector-config.yaml
+ ports:
+ - "1888:1888" # pprof extension
+ - "8888:8888" # Prometheus metrics exposed by the collector
+ - "8889:8889" # Prometheus exporter metrics
+ - "13133:13133" # health_check extension
+ - "4317" # OTLP gRPC receiver
+ - "4318:4318" # 添加 OTLP HTTP Receiver 端口映射
+ - "55670:55679" # zpages extension
+ depends_on:
+ - jaeger-all-in-one
+ - zipkin-all-in-one
+
+ demo-client:
+ build:
+ dockerfile: Dockerfile
+ context: ./client
+ environment:
+ - OTEL_EXPORTER_OTLP_ENDPOINT=otel-collector:4317
+ - DEMO_SERVER_ENDPOINT=http://172.17.0.1:9080/hello # APISIX 的地址
+ depends_on:
+ - demo-server
+
+ demo-server:
+ build:
+ dockerfile: Dockerfile
+ context: ./server
+ environment:
+ - OTEL_EXPORTER_OTLP_ENDPOINT=otel-collector:4317
+ ports:
+ - "7080:7080" # 将 Server 端口映射到宿主机
+ depends_on:
+ - otel-collector
+
+ prometheus:
+ container_name: prometheus
+ image: prom/prometheus:latest
+ volumes:
+ - ./prometheus.yaml:/etc/prometheus/prometheus.yml
+ ports:
+ - "9090:9090"
+ ```
+
+需要注意,`demo-client.environment.DEMO_SERVER_ENDPOINT` 处需要改为您的 Apache APISIX 地址,且保证在容器内可以正常访问。
+
+当然,您也可以通过 `docekr-compose.yaml` 部署 Apache APISIX ,具体可以参考 [Apache APISIX 官方文档](https://github.com/apache/apisix-docker/blob/master/docs/en/latest/example.md)。
+
+#### 步骤三:测试
+
+重新部署完成后,访问 Jaeger UI 或者 Zipkin UI 即可看到 Trace 中包含了 APISIX 的 Span,如下图:
+
+
+
+
+
+## 禁用插件
+
+如果您暂时不需要某个路由的 Trace 采集,则仅需修改路由配置,将配置中的 `plugins` 下的 `opentelemetry` 相关配置删除即可。
+
+如果您是通过绑定 Global Rules 全局启用的,则只能删除 `opentelemetry` 全局插件的配置。得益于 Apache APISIX 的动态化优势,开启关闭插件的过程都不需要重启 Apache APISIX,十分方便。
+
+## 总结
+
+Apache APISIX 在集成 OpenTelemetery 之后,借助 OpenTelemetry 丰富的插件能够与市场上大部分主流的 Trace 系统轻松实现对接。此外,Apache APISIX 也实现了 SkyWalking 和 Zipkin 原生标准协议插件,也在积极与各大社区合作打造更加强大的生态。
+
+Apache APISIX 项目目前正在开发其他插件以支持集成更多服务,如果您对此有兴趣,您可以通过 [GitHub Discussions](https://github.com/apache/apisix/discussions) 发起讨论,或通过[邮件列表](https://apisix.apache.org/docs/general/subscribe-guide)进行交流.
+
+## 相关阅读
+
+- [浅谈 Apache APISIX 的可观测性](https://apisix.apache.org/zh/blog/2021/11/04/skywalking)
+
+- [生态扩大进行中!API 网关集成 Splunk HTTP Event Collector](https://apisix.apache.org/zh/blog/2022/02/10/apisix-splunk-integration)