You are viewing a plain text version of this content. The canonical link for it is here.
Posted to notifications@skywalking.apache.org by "innerpeacez (via GitHub)" <gi...@apache.org> on 2023/04/14 10:32:03 UTC
[GitHub] [skywalking] innerpeacez opened a new pull request, #10690: Support Elasticsearch monitoring
innerpeacez opened a new pull request, #10690:
URL: https://github.com/apache/skywalking/pull/10690
<!--
⚠️ Please make sure to read this template first, pull requests that don't accord with this template
maybe closed without notice.
Texts surrounded by `<` and `>` are meant to be replaced by you, e.g. <framework name>, <issue number>.
Put an `x` in the `[ ]` to mark the item as CHECKED. `[x]`
-->
<!-- ==== 🐛 Remove this line WHEN AND ONLY WHEN you're fixing a bug, follow the checklist 👇 ====
### Fix <bug description or the bug issue number or bug issue link>
- [ ] Add a unit test to verify that the fix works.
- [ ] Explain briefly why the bug exists and how to fix it.
==== 🐛 Remove this line WHEN AND ONLY WHEN you're fixing a bug, follow the checklist 👆 ==== -->
<!-- ==== 📈 Remove this line WHEN AND ONLY WHEN you're improving the performance, follow the checklist 👇 ====
### Improve the performance of <class or module or ...>
- [ ] Add a benchmark for the improvement, refer to [the existing ones](https://github.com/apache/skywalking/blob/master/apm-commons/apm-datacarrier/src/test/java/org/apache/skywalking/apm/commons/datacarrier/LinkedArrayBenchmark.java)
- [ ] The benchmark result.
```text
<Paste the benchmark results here>
```
- [ ] Links/URLs to the theory proof or discussion articles/blogs. <links/URLs here>
==== 📈 Remove this line WHEN AND ONLY WHEN you're improving the performance, follow the checklist 👆 ==== -->
### <Feature description>
- [ ] If this is non-trivial feature, paste the links/URLs to the design doc.
- [x] Update the documentation to include this new feature.
- [ ] Tests(including UT, IT, E2E) are added to verify the new feature.
- [x] If it's UI related, attach the screenshots below.
- [x] If this pull request closes/resolves/fixes an existing issue, replace the issue number. Closes #10681 .
- [x] Update the [`CHANGES` log](https://github.com/apache/skywalking/blob/master/docs/en/changes/changes.md).
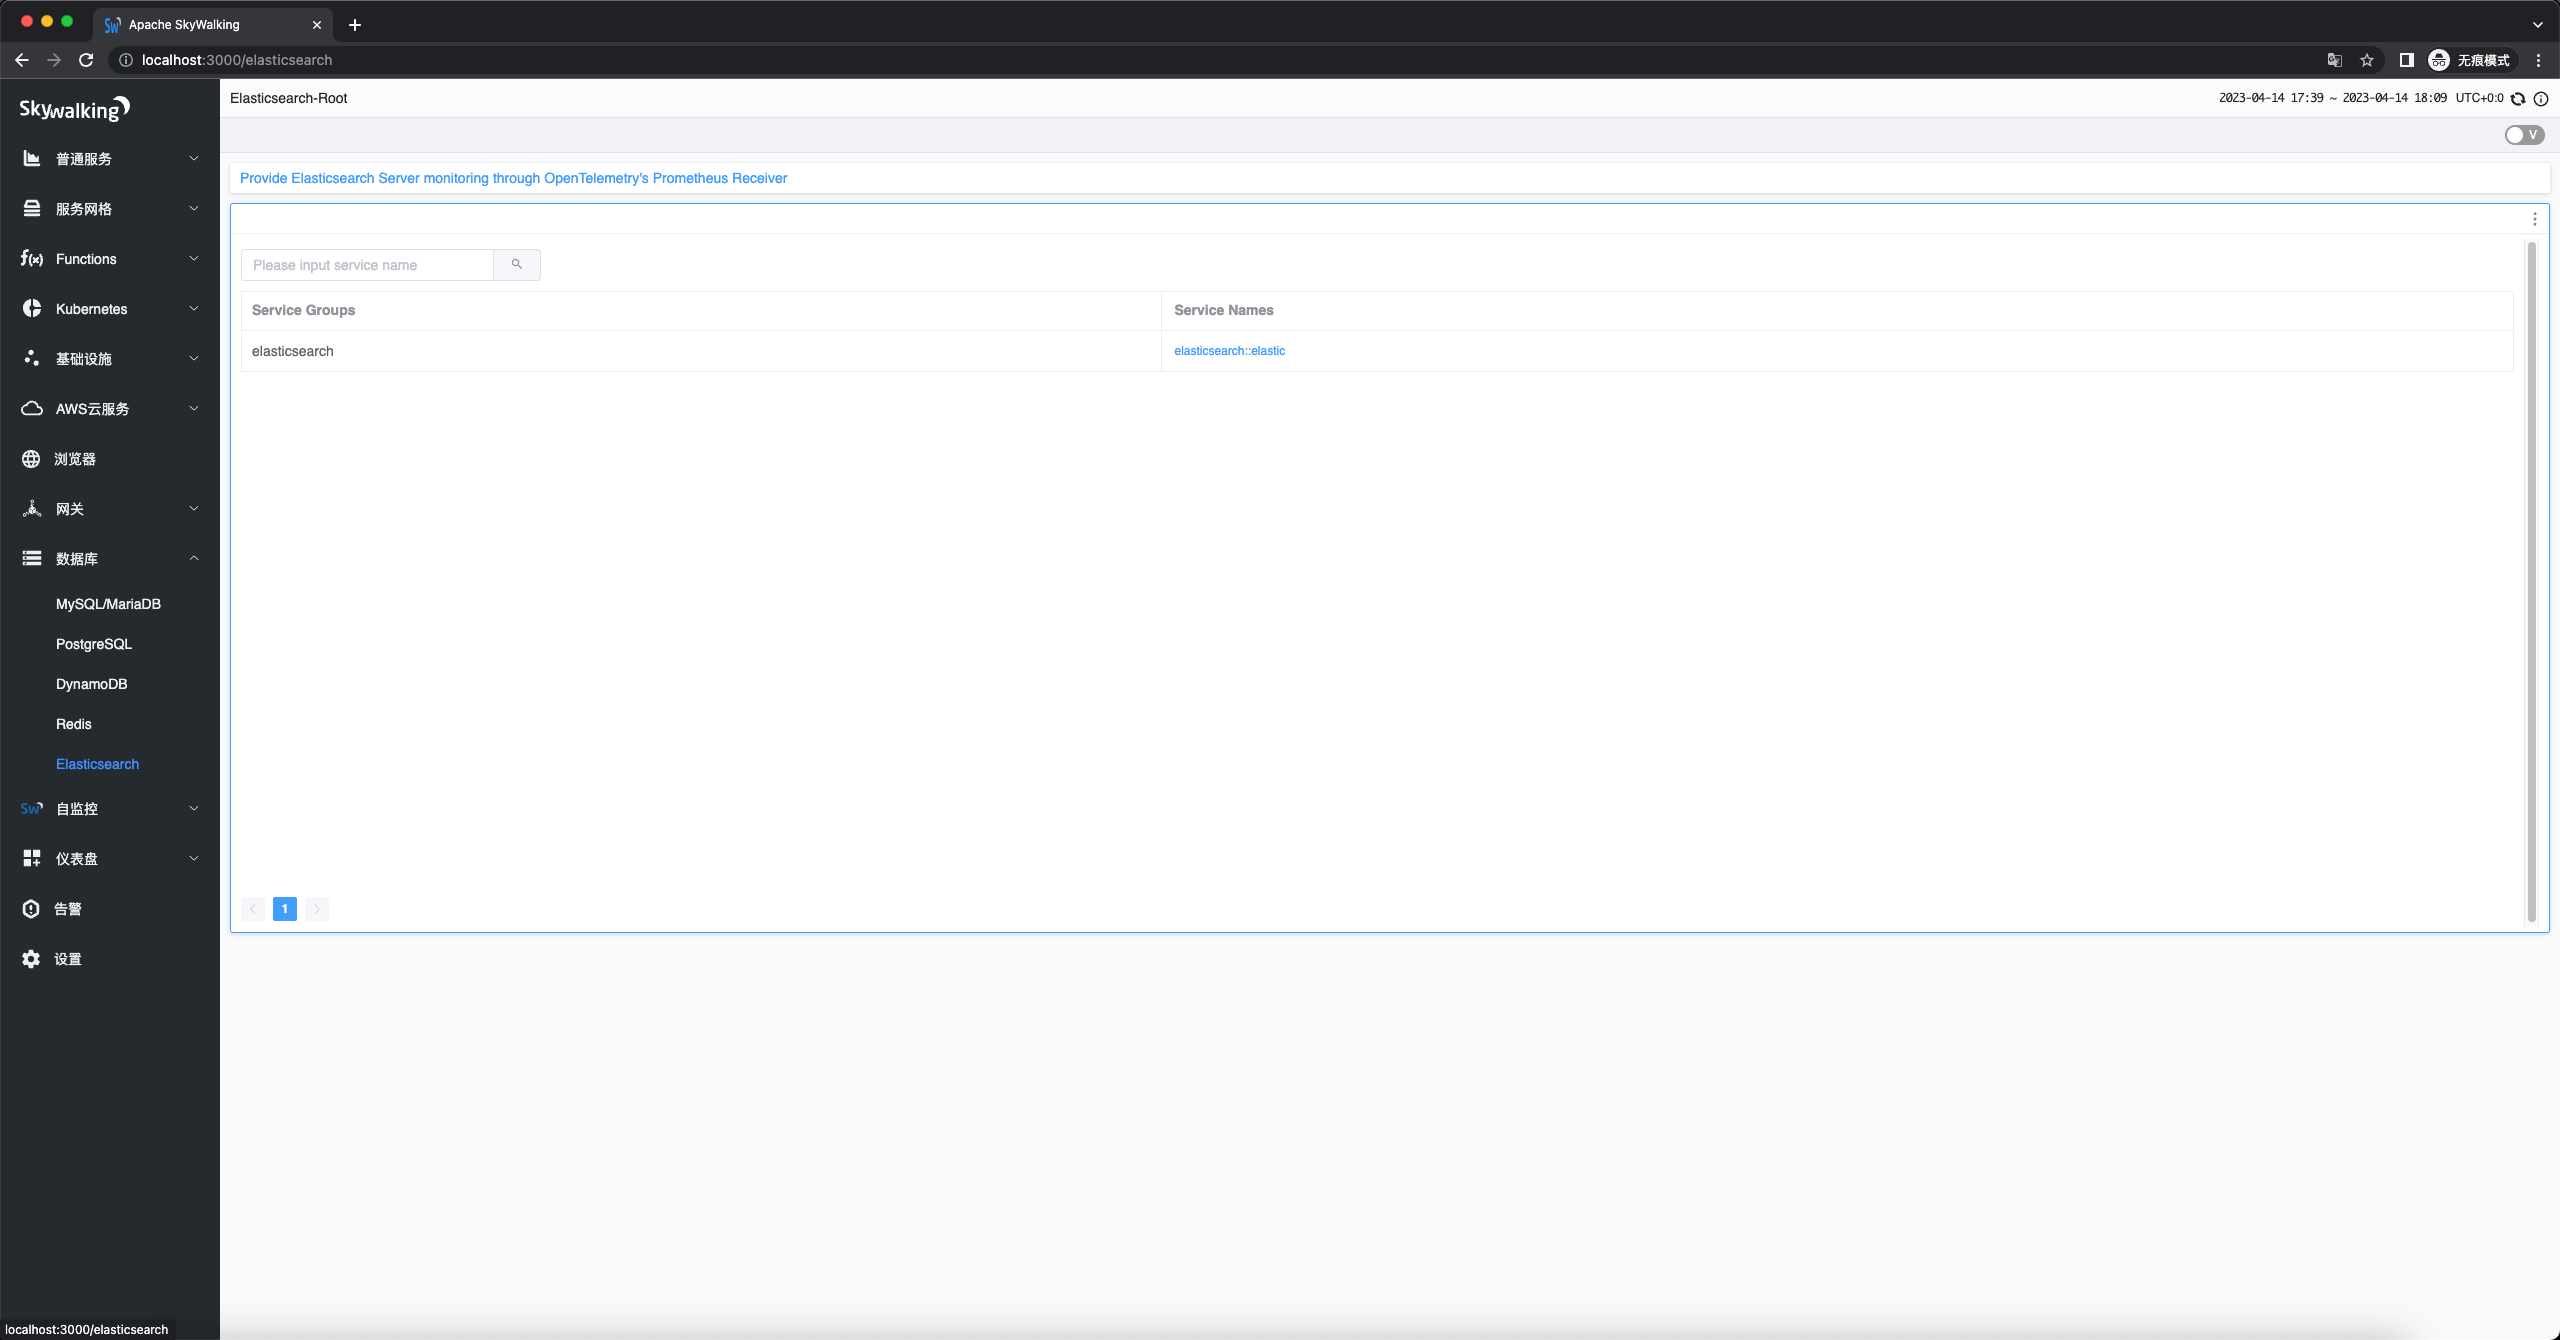
Elasticsearch Root Dashboard:
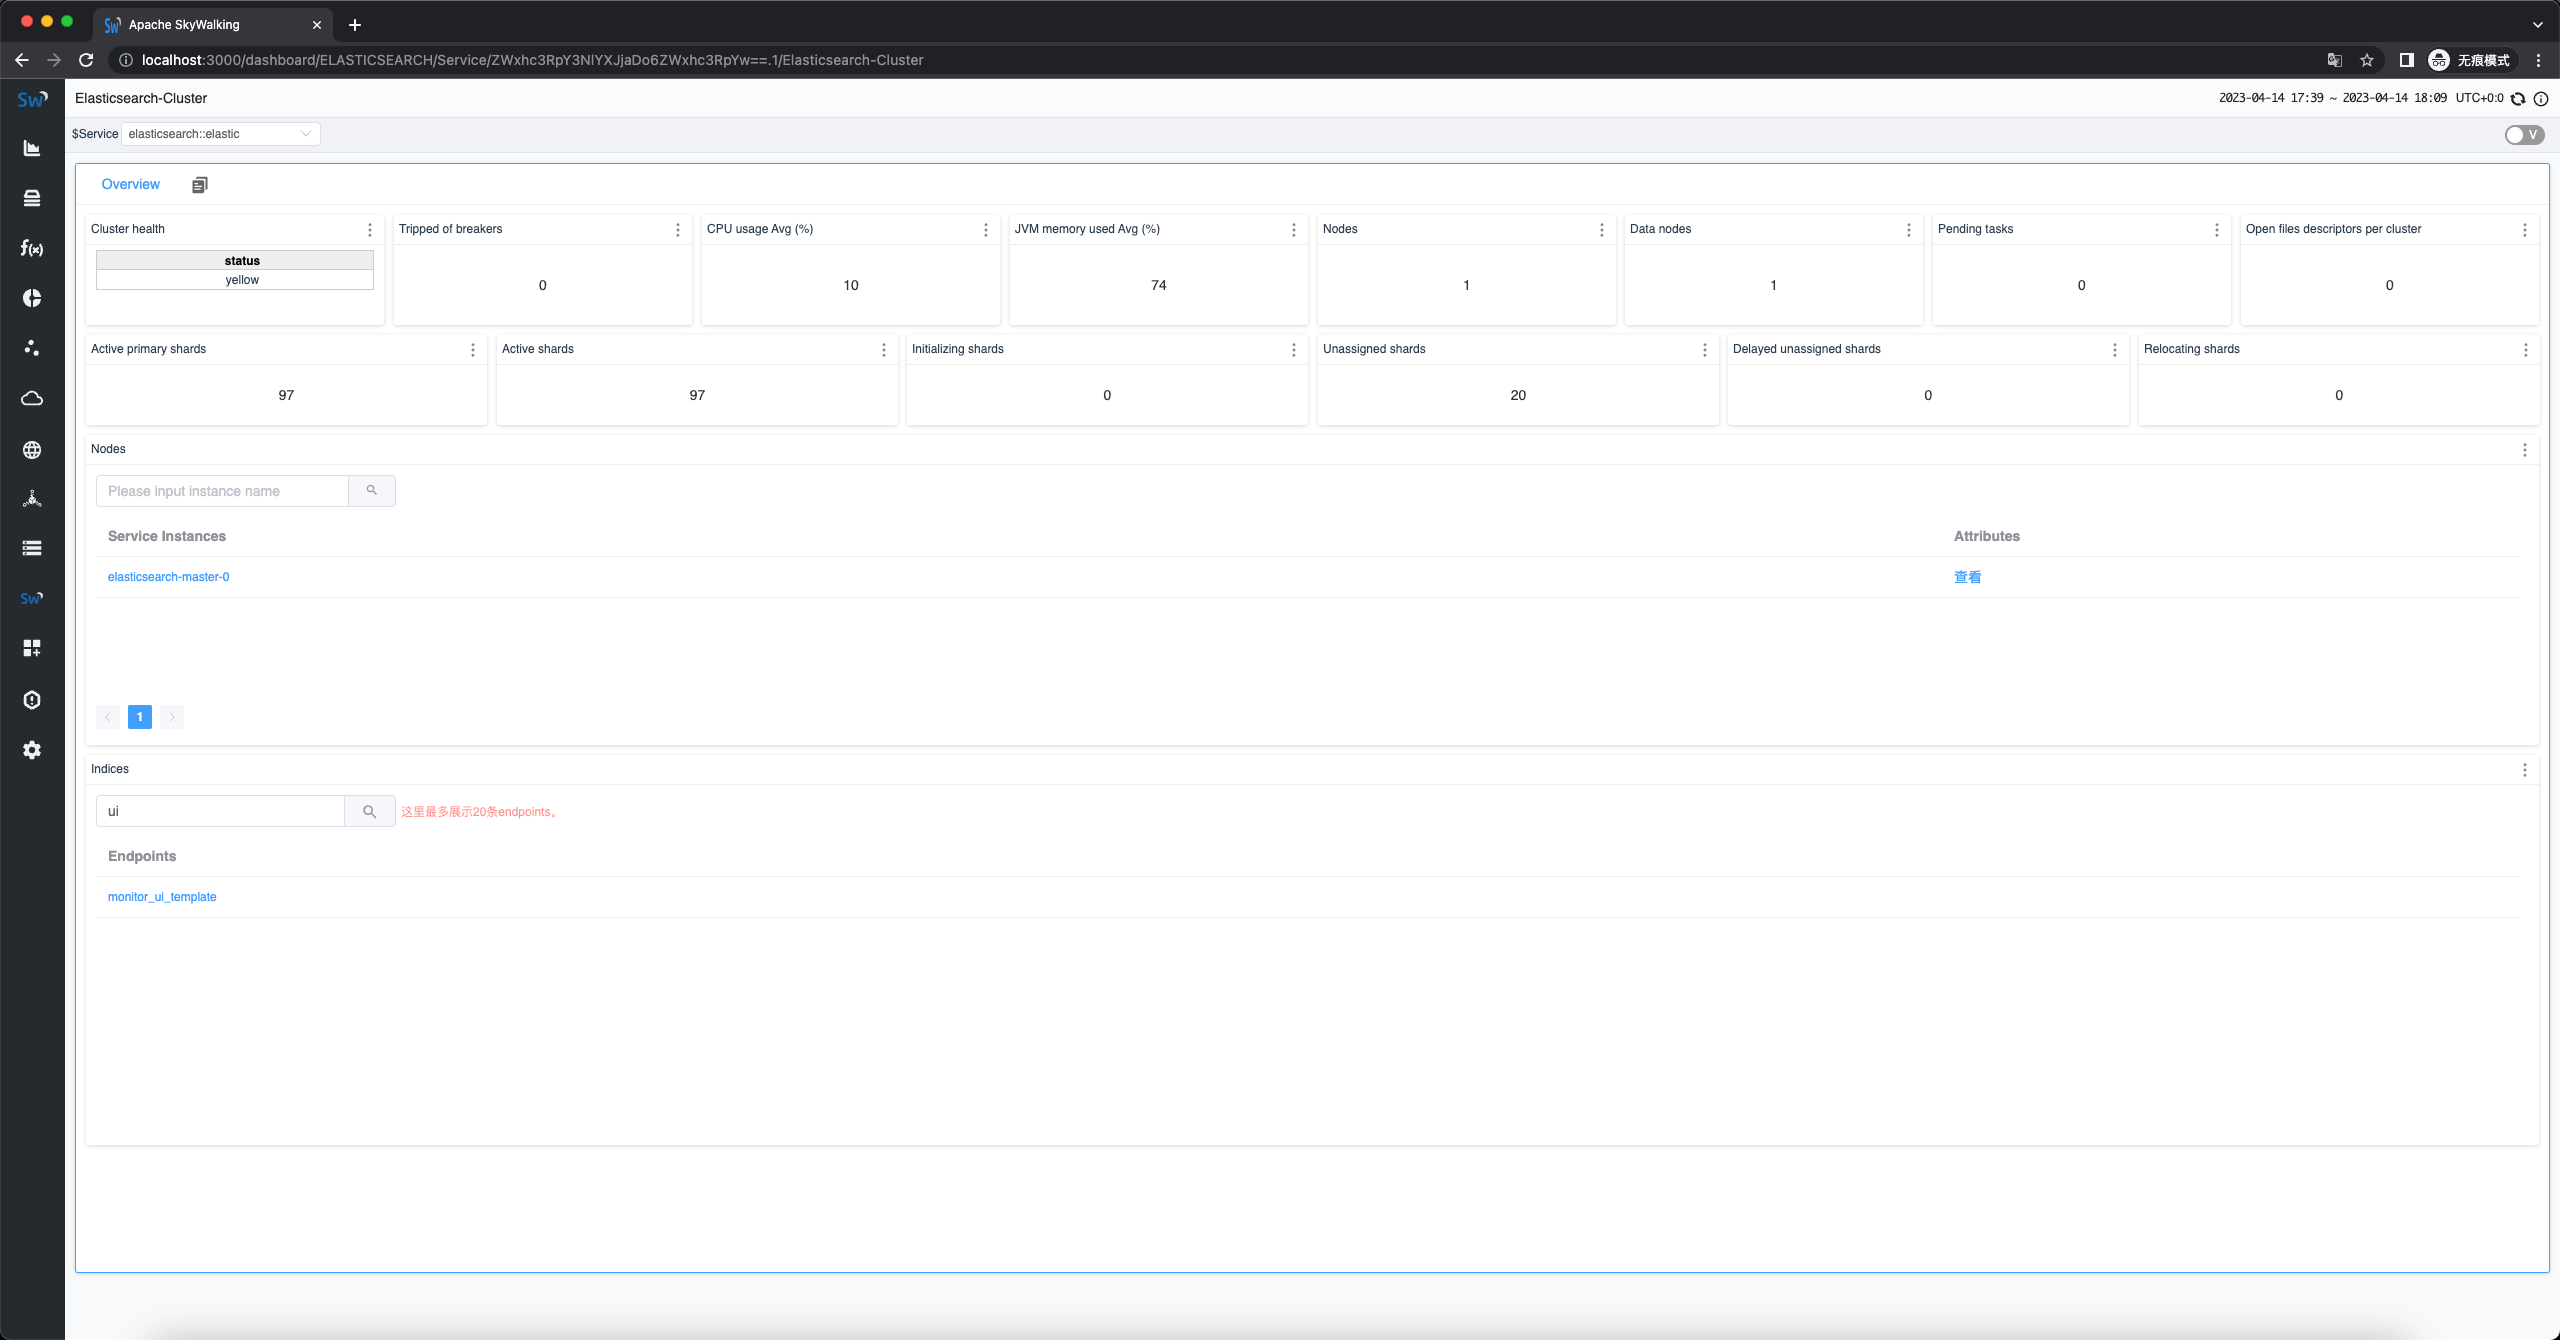
Elasticsearch Cluster Dashboard:
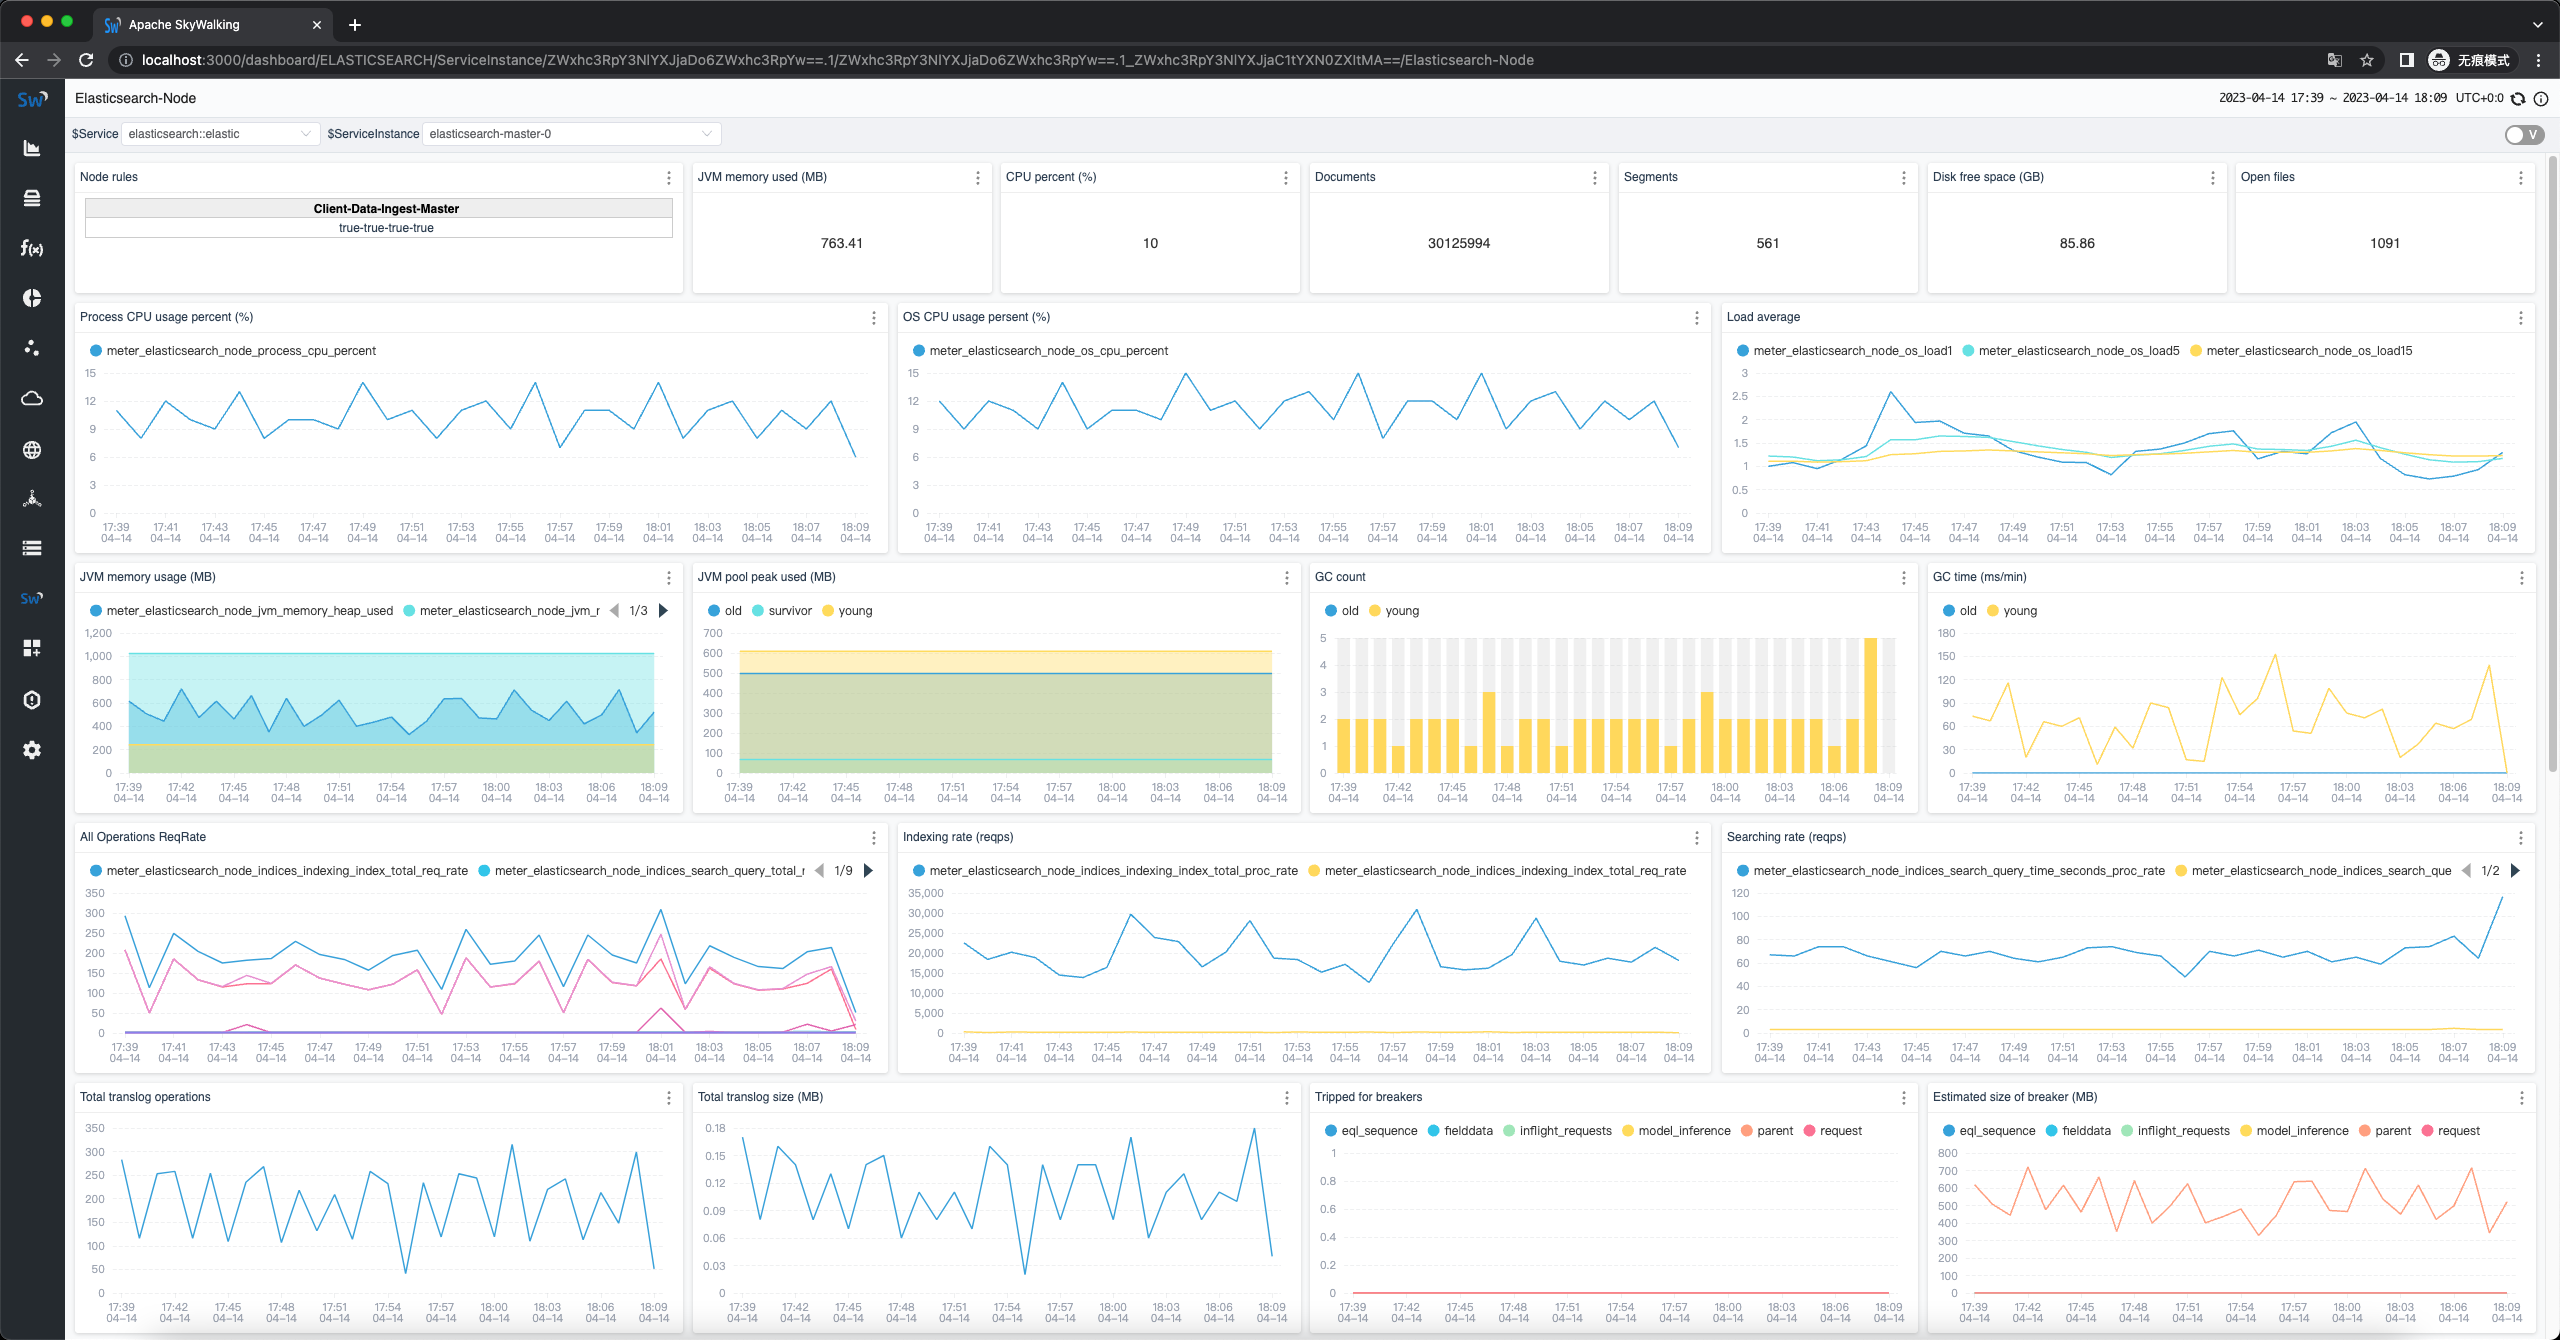
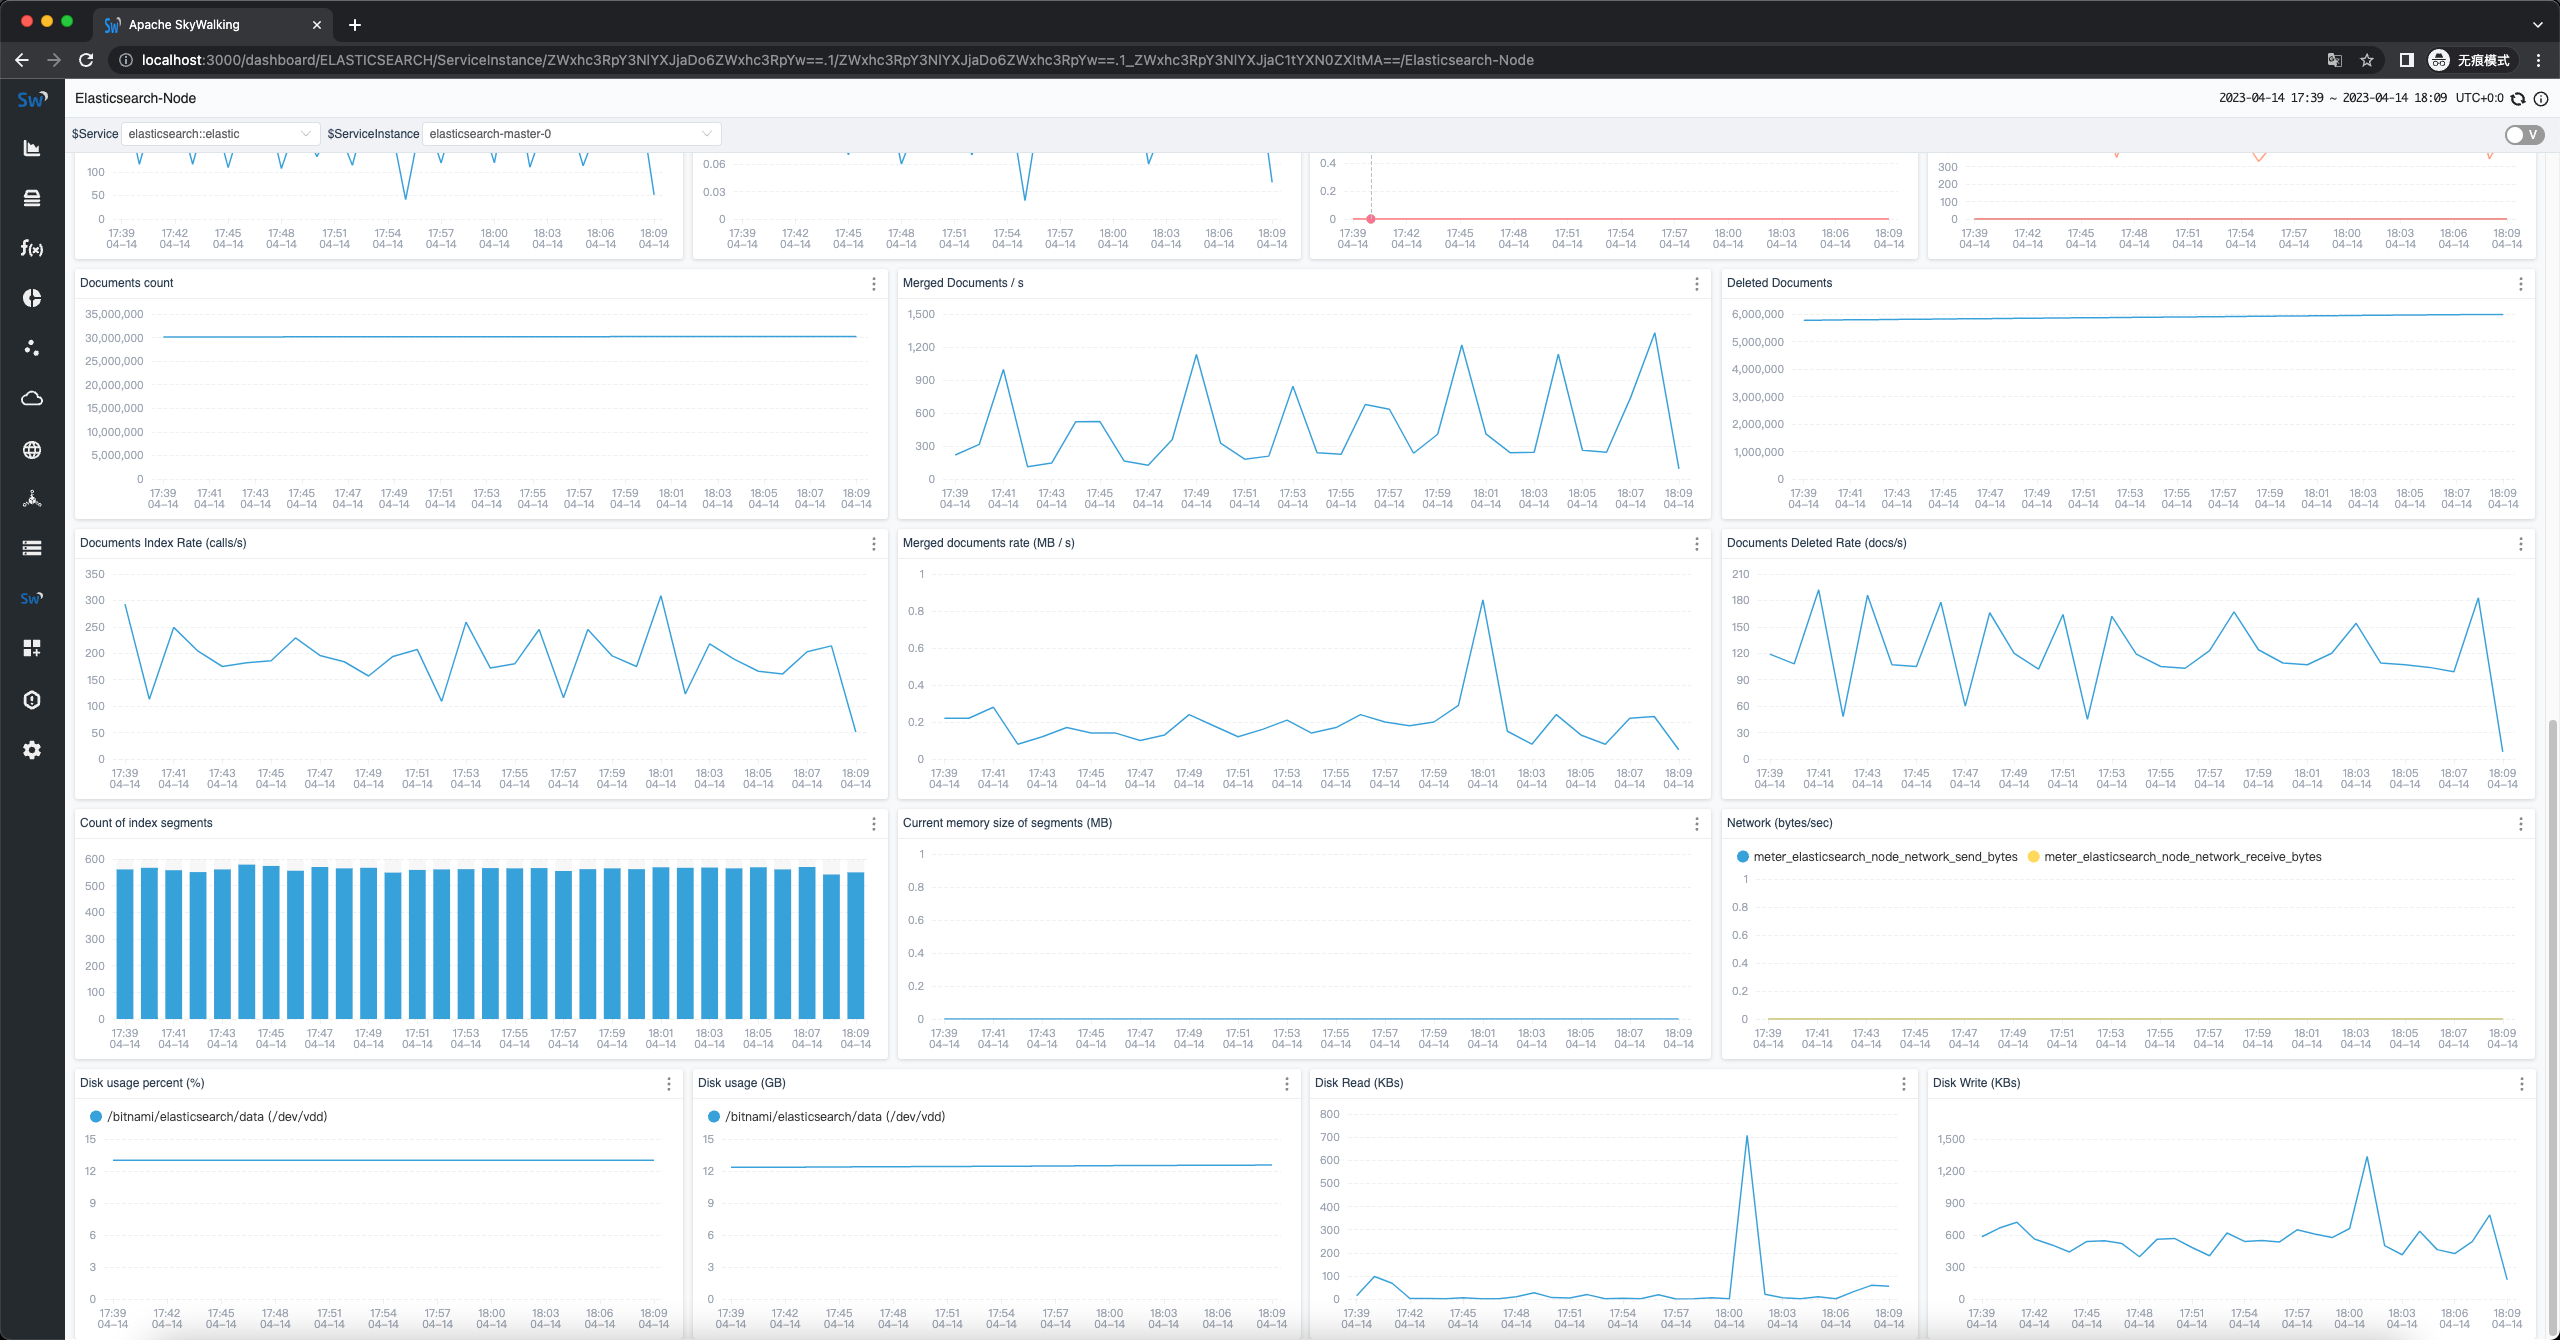
Elasticsearch Node Dashboard:
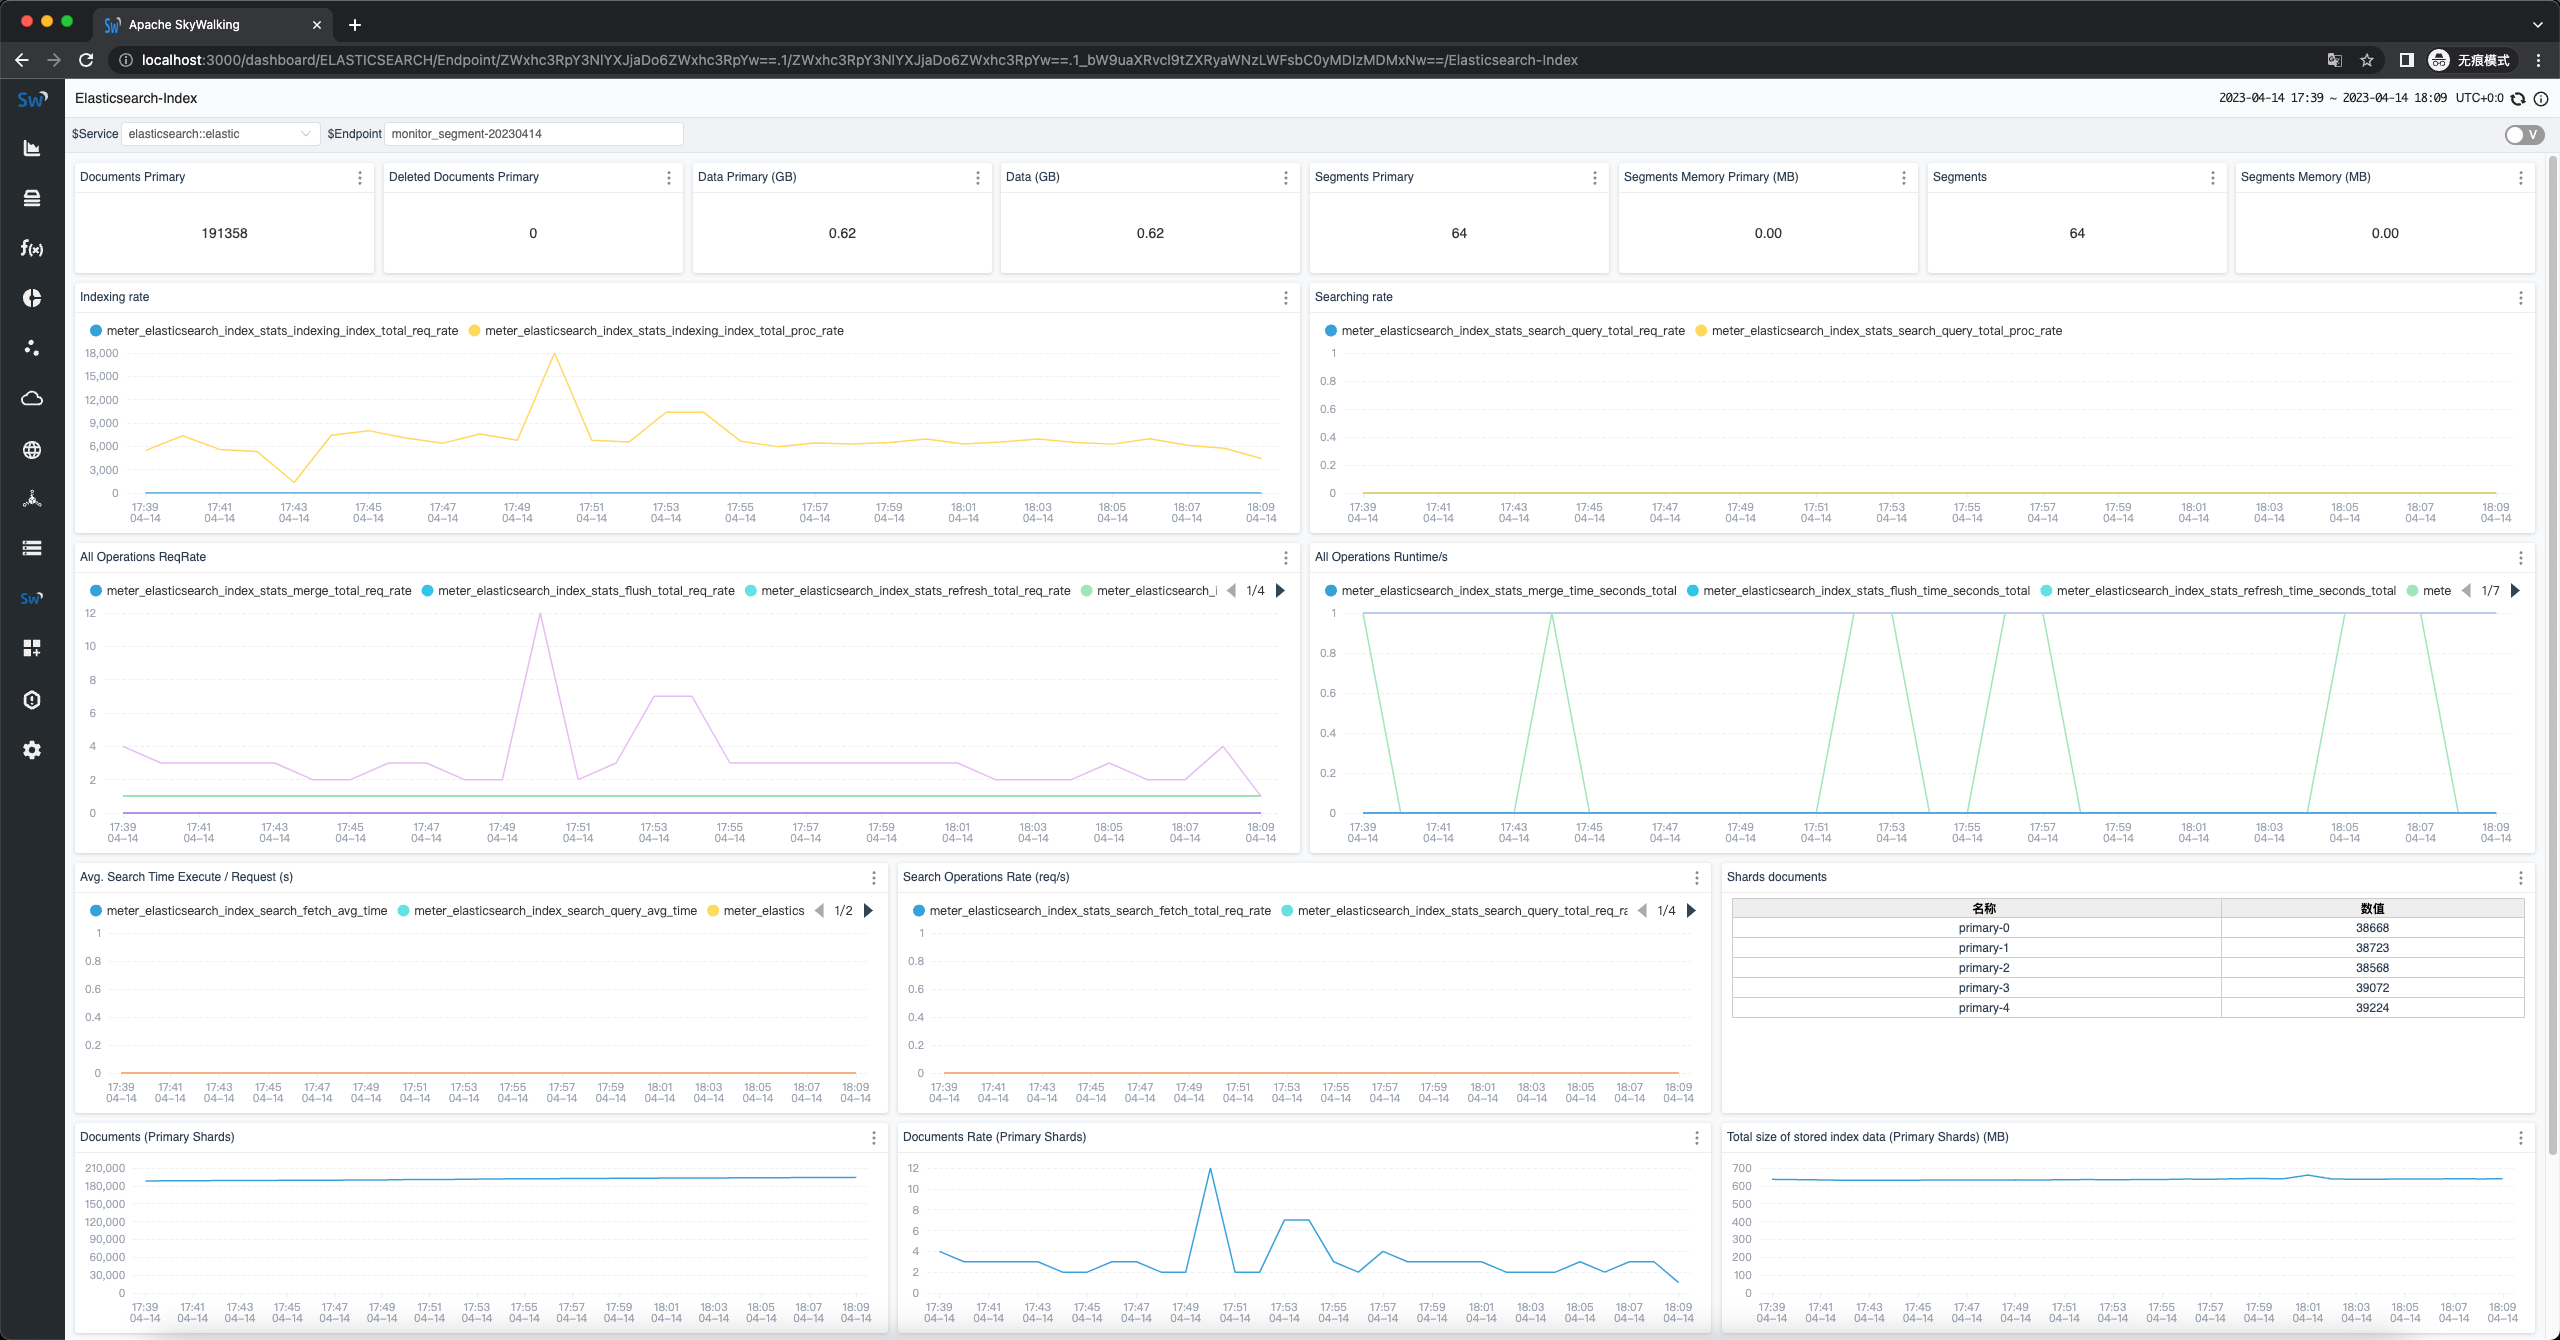
Elasticsearch Index Dashboard:

--
This is an automated message from the Apache Git Service.
To respond to the message, please log on to GitHub and use the
URL above to go to the specific comment.
To unsubscribe, e-mail: notifications-unsubscribe@skywalking.apache.org
For queries about this service, please contact Infrastructure at:
users@infra.apache.org
[GitHub] [skywalking] wu-sheng commented on a diff in pull request #10690: Support Elasticsearch monitoring
Posted by "wu-sheng (via GitHub)" <gi...@apache.org>.
wu-sheng commented on code in PR #10690:
URL: https://github.com/apache/skywalking/pull/10690#discussion_r1168060542
##########
oap-server/server-starter/src/main/resources/ui-initialized-templates/elasticsearch/elasticsearch-index.json:
##########
@@ -0,0 +1,674 @@
+/**
+ * Licensed to the Apache Software Foundation (ASF) under one or more
+ * contributor license agreements. See the NOTICE file distributed with
+ * this work for additional information regarding copyright ownership.
+ * The ASF licenses this file to You under the Apache License, Version 2.0
+ * (the "License"); you may not use this file except in compliance with
+ * the License. You may obtain a copy of the License at
+ *
+ * http://www.apache.org/licenses/LICENSE-2.0
+ *
+ * Unless required by applicable law or agreed to in writing, software
+ * distributed under the License is distributed on an "AS IS" BASIS,
+ * WITHOUT WARRANTIES OR CONDITIONS OF ANY KIND, either express or implied.
+ * See the License for the specific language governing permissions and
+ * limitations under the License.
+ */
+[
+ {
+ "id": "Elasticsearch-Index",
+ "configuration": {
+ "children":[
+ {
+ "x":0,
+ "y":6,
+ "w":12,
+ "h":13,
+ "i":"0",
+ "type":"Widget",
+ "id":"0",
+ "metricTypes":[
+ "readMetricsValues",
+ "readMetricsValues"
+ ],
+ "metrics":[
+ "meter_elasticsearch_index_stats_indexing_index_total_req_rate",
+ "meter_elasticsearch_index_stats_indexing_index_total_proc_rate"
+ ],
+ "moved":false,
+ "graph":{
+ "type":"Line",
+ "step":false,
+ "smooth":false,
+ "showSymbol":false,
+ "showXAxis":true,
+ "showYAxis":true
+ },
+ "widget":{
+ "title":"Indexing rate"
+ }
+ },
+ {
+ "x":12,
+ "y":6,
+ "w":12,
+ "h":13,
+ "i":"1",
+ "type":"Widget",
+ "id":"1",
+ "metricTypes":[
+ "readMetricsValues",
+ "readMetricsValues"
+ ],
+ "metrics":[
+ "meter_elasticsearch_index_stats_search_query_total_req_rate",
+ "meter_elasticsearch_index_stats_search_query_total_proc_rate"
+ ],
+ "moved":false,
+ "graph":{
+ "type":"Line",
+ "step":false,
+ "smooth":false,
+ "showSymbol":false,
+ "showXAxis":true,
+ "showYAxis":true
+ },
+ "widget":{
+ "title":"Searching rate"
+ }
+ },
+ {
+ "x":0,
+ "y":19,
+ "w":12,
+ "h":16,
+ "i":"2",
+ "type":"Widget",
+ "id":"2",
+ "metricTypes":[
+ "readMetricsValues",
+ "readMetricsValues",
+ "readMetricsValues",
+ "readMetricsValues",
+ "readMetricsValues",
+ "readMetricsValues",
+ "readMetricsValues",
+ "readMetricsValues",
+ "readMetricsValues",
+ "readMetricsValues",
+ "readMetricsValues"
+ ],
+ "metrics":[
+ "meter_elasticsearch_index_stats_merge_total_req_rate",
+ "meter_elasticsearch_index_stats_flush_total_req_rate",
+ "meter_elasticsearch_index_stats_refresh_total_req_rate",
+ "meter_elasticsearch_index_stats_warmer_total_req_rate",
+ "meter_elasticsearch_index_stats_indexing_delete_total_req_rate",
+ "meter_elasticsearch_index_stats_search_fetch_total_req_rate",
+ "meter_elasticsearch_index_stats_search_query_total_req_rate",
+ "meter_elasticsearch_index_stats_search_scroll_total_req_rate",
+ "meter_elasticsearch_index_stats_search_suggest_total_req_rate",
+ "meter_elasticsearch_index_stats_indexing_index_total_req_rate",
+ "meter_elasticsearch_index_stats_get_total_req_rate"
+ ],
+ "moved":false,
+ "graph":{
+ "type":"Line",
+ "step":false,
+ "smooth":false,
+ "showSymbol":false,
+ "showXAxis":true,
+ "showYAxis":true
+ },
+ "widget":{
+ "title":"All Operations ReqRate"
+ }
+ },
+ {
+ "x":12,
+ "y":19,
+ "w":12,
+ "h":16,
+ "i":"3",
+ "type":"Widget",
+ "id":"3",
+ "metricTypes":[
+ "readMetricsValues",
+ "readMetricsValues",
+ "readMetricsValues",
+ "readMetricsValues",
+ "readMetricsValues",
+ "readMetricsValues",
+ "readMetricsValues",
+ "readMetricsValues",
+ "readMetricsValues",
+ "readMetricsValues",
+ "readMetricsValues",
+ "readMetricsValues",
+ "readMetricsValues",
+ "readMetricsValues"
+ ],
+ "metrics":[
+ "meter_elasticsearch_index_stats_merge_time_seconds_total",
+ "meter_elasticsearch_index_stats_flush_time_seconds_total",
+ "meter_elasticsearch_index_stats_refresh_time_seconds_total",
+ "meter_elasticsearch_index_stats_warmer_time_seconds_total",
+ "meter_elasticsearch_index_stats_indexing_delete_time_seconds_total",
+ "meter_elasticsearch_index_stats_search_fetch_time_seconds_total",
+ "meter_elasticsearch_index_stats_search_query_time_seconds_total",
+ "meter_elasticsearch_index_stats_search_scroll_time_seconds_total",
+ "meter_elasticsearch_index_stats_search_suggest_time_seconds_total",
+ "meter_elasticsearch_index_stats_indexing_index_time_seconds_total",
+ "meter_elasticsearch_index_stats_get_time_seconds_total",
+ "meter_elasticsearch_index_stats_merge_stopped_time_seconds_total",
+ "meter_elasticsearch_index_stats_merge_throttle_time_seconds_total",
+ "meter_elasticsearch_index_stats_indexing_throttle_time_seconds_total"
+ ],
+ "moved":false,
+ "graph":{
+ "type":"Line",
+ "step":false,
+ "smooth":false,
+ "showSymbol":false,
+ "showXAxis":true,
+ "showYAxis":true
+ },
+ "widget":{
+ "title":"All Operations Runtime/s"
+ }
+ },
+ {
+ "x":0,
+ "y":35,
+ "w":8,
+ "h":13,
+ "i":"4",
+ "type":"Widget",
+ "id":"4",
+ "metricTypes":[
+ "readMetricsValues",
+ "readMetricsValues",
+ "readMetricsValues",
+ "readMetricsValues"
+ ],
+ "metrics":[
+ "meter_elasticsearch_index_search_fetch_avg_time",
+ "meter_elasticsearch_index_search_query_avg_time",
+ "meter_elasticsearch_index_search_scroll_avg_time",
+ "meter_elasticsearch_index_search_suggest_avg_time"
+ ],
+ "moved":false,
+ "graph":{
+ "type":"Line",
+ "step":false,
+ "smooth":false,
+ "showSymbol":false,
+ "showXAxis":true,
+ "showYAxis":true
+ },
+ "widget":{
+ "title":"Avg. Search Time Execute / Request (s)"
+ }
+ },
+ {
+ "x":8,
+ "y":35,
+ "w":8,
+ "h":13,
+ "i":"5",
+ "type":"Widget",
+ "id":"5",
+ "metricTypes":[
+ "readMetricsValues",
+ "readMetricsValues",
+ "readMetricsValues",
+ "readMetricsValues"
+ ],
+ "metrics":[
+ "meter_elasticsearch_index_stats_search_fetch_total_req_rate",
+ "meter_elasticsearch_index_stats_search_query_total_req_rate",
+ "meter_elasticsearch_index_stats_search_scroll_total_req_rate",
+ "meter_elasticsearch_index_stats_search_suggest_total_req_rate"
+ ],
+ "moved":false,
+ "graph":{
+ "type":"Line",
+ "step":false,
+ "smooth":false,
+ "showSymbol":false,
+ "showXAxis":true,
+ "showYAxis":true
+ },
+ "metricConfig":[
+
+ ],
+ "widget":{
+ "title":"Search Operations Rate (req/s)"
+ }
+ },
+ {
+ "x":16,
+ "y":59,
+ "w":8,
+ "h":11,
+ "i":"6",
+ "type":"Widget",
+ "id":"6",
+ "metricTypes":[
+ "readMetricsValues"
+ ],
+ "metrics":[
+ "meter_elasticsearch_index_indices_store_size_bytes_total"
+ ],
+ "moved":false,
+ "graph":{
+ "type":"Line",
+ "step":false,
+ "smooth":false,
+ "showSymbol":false,
+ "showXAxis":true,
+ "showYAxis":true
+ },
+ "widget":{
+ "title":"Total size of stored index data (All Shards)"
+ },
+ "metricConfig":[
+ {
+ "calculation":"byteToMB"
+ }
+ ]
+ },
+ {
+ "x":0,
+ "y":59,
+ "w":8,
+ "h":11,
+ "i":"7",
+ "type":"Widget",
+ "id":"7",
+ "metricTypes":[
+ "readMetricsValues"
+ ],
+ "metrics":[
+ "meter_elasticsearch_index_indices_docs_total"
+ ],
+ "moved":false,
+ "graph":{
+ "type":"Line",
+ "step":false,
+ "smooth":false,
+ "showSymbol":false,
+ "showXAxis":true,
+ "showYAxis":true
+ },
+ "widget":{
+ "title":"Documents (All Shards)"
+ }
+ },
+ {
+ "x":8,
+ "y":59,
+ "w":8,
+ "h":11,
+ "i":"8",
+ "type":"Widget",
+ "id":"8",
+ "metricTypes":[
+ "readMetricsValues"
+ ],
+ "metrics":[
+ "meter_elasticsearch_index_indices_docs_total_rate"
+ ],
+ "moved":false,
+ "graph":{
+ "type":"Line",
+ "step":false,
+ "smooth":false,
+ "showSymbol":false,
+ "showXAxis":true,
+ "showYAxis":true
+ },
+ "widget":{
+ "title":"Documents Rate (All Shards)"
Review Comment:
What is Documents Rate? I think this is wrong from a grammar perspetive.
##########
oap-server/server-starter/src/main/resources/ui-initialized-templates/elasticsearch/elasticsearch-index.json:
##########
@@ -0,0 +1,674 @@
+/**
+ * Licensed to the Apache Software Foundation (ASF) under one or more
+ * contributor license agreements. See the NOTICE file distributed with
+ * this work for additional information regarding copyright ownership.
+ * The ASF licenses this file to You under the Apache License, Version 2.0
+ * (the "License"); you may not use this file except in compliance with
+ * the License. You may obtain a copy of the License at
+ *
+ * http://www.apache.org/licenses/LICENSE-2.0
+ *
+ * Unless required by applicable law or agreed to in writing, software
+ * distributed under the License is distributed on an "AS IS" BASIS,
+ * WITHOUT WARRANTIES OR CONDITIONS OF ANY KIND, either express or implied.
+ * See the License for the specific language governing permissions and
+ * limitations under the License.
+ */
+[
+ {
+ "id": "Elasticsearch-Index",
+ "configuration": {
+ "children":[
+ {
+ "x":0,
+ "y":6,
+ "w":12,
+ "h":13,
+ "i":"0",
+ "type":"Widget",
+ "id":"0",
+ "metricTypes":[
+ "readMetricsValues",
+ "readMetricsValues"
+ ],
+ "metrics":[
+ "meter_elasticsearch_index_stats_indexing_index_total_req_rate",
+ "meter_elasticsearch_index_stats_indexing_index_total_proc_rate"
+ ],
+ "moved":false,
+ "graph":{
+ "type":"Line",
+ "step":false,
+ "smooth":false,
+ "showSymbol":false,
+ "showXAxis":true,
+ "showYAxis":true
+ },
+ "widget":{
+ "title":"Indexing rate"
+ }
+ },
+ {
+ "x":12,
+ "y":6,
+ "w":12,
+ "h":13,
+ "i":"1",
+ "type":"Widget",
+ "id":"1",
+ "metricTypes":[
+ "readMetricsValues",
+ "readMetricsValues"
+ ],
+ "metrics":[
+ "meter_elasticsearch_index_stats_search_query_total_req_rate",
+ "meter_elasticsearch_index_stats_search_query_total_proc_rate"
+ ],
+ "moved":false,
+ "graph":{
+ "type":"Line",
+ "step":false,
+ "smooth":false,
+ "showSymbol":false,
+ "showXAxis":true,
+ "showYAxis":true
+ },
+ "widget":{
+ "title":"Searching rate"
+ }
+ },
+ {
+ "x":0,
+ "y":19,
+ "w":12,
+ "h":16,
+ "i":"2",
+ "type":"Widget",
+ "id":"2",
+ "metricTypes":[
+ "readMetricsValues",
+ "readMetricsValues",
+ "readMetricsValues",
+ "readMetricsValues",
+ "readMetricsValues",
+ "readMetricsValues",
+ "readMetricsValues",
+ "readMetricsValues",
+ "readMetricsValues",
+ "readMetricsValues",
+ "readMetricsValues"
+ ],
+ "metrics":[
+ "meter_elasticsearch_index_stats_merge_total_req_rate",
+ "meter_elasticsearch_index_stats_flush_total_req_rate",
+ "meter_elasticsearch_index_stats_refresh_total_req_rate",
+ "meter_elasticsearch_index_stats_warmer_total_req_rate",
+ "meter_elasticsearch_index_stats_indexing_delete_total_req_rate",
+ "meter_elasticsearch_index_stats_search_fetch_total_req_rate",
+ "meter_elasticsearch_index_stats_search_query_total_req_rate",
+ "meter_elasticsearch_index_stats_search_scroll_total_req_rate",
+ "meter_elasticsearch_index_stats_search_suggest_total_req_rate",
+ "meter_elasticsearch_index_stats_indexing_index_total_req_rate",
+ "meter_elasticsearch_index_stats_get_total_req_rate"
+ ],
+ "moved":false,
+ "graph":{
+ "type":"Line",
+ "step":false,
+ "smooth":false,
+ "showSymbol":false,
+ "showXAxis":true,
+ "showYAxis":true
+ },
+ "widget":{
+ "title":"All Operations ReqRate"
+ }
+ },
+ {
+ "x":12,
+ "y":19,
+ "w":12,
+ "h":16,
+ "i":"3",
+ "type":"Widget",
+ "id":"3",
+ "metricTypes":[
+ "readMetricsValues",
+ "readMetricsValues",
+ "readMetricsValues",
+ "readMetricsValues",
+ "readMetricsValues",
+ "readMetricsValues",
+ "readMetricsValues",
+ "readMetricsValues",
+ "readMetricsValues",
+ "readMetricsValues",
+ "readMetricsValues",
+ "readMetricsValues",
+ "readMetricsValues",
+ "readMetricsValues"
+ ],
+ "metrics":[
+ "meter_elasticsearch_index_stats_merge_time_seconds_total",
+ "meter_elasticsearch_index_stats_flush_time_seconds_total",
+ "meter_elasticsearch_index_stats_refresh_time_seconds_total",
+ "meter_elasticsearch_index_stats_warmer_time_seconds_total",
+ "meter_elasticsearch_index_stats_indexing_delete_time_seconds_total",
+ "meter_elasticsearch_index_stats_search_fetch_time_seconds_total",
+ "meter_elasticsearch_index_stats_search_query_time_seconds_total",
+ "meter_elasticsearch_index_stats_search_scroll_time_seconds_total",
+ "meter_elasticsearch_index_stats_search_suggest_time_seconds_total",
+ "meter_elasticsearch_index_stats_indexing_index_time_seconds_total",
+ "meter_elasticsearch_index_stats_get_time_seconds_total",
+ "meter_elasticsearch_index_stats_merge_stopped_time_seconds_total",
+ "meter_elasticsearch_index_stats_merge_throttle_time_seconds_total",
+ "meter_elasticsearch_index_stats_indexing_throttle_time_seconds_total"
+ ],
+ "moved":false,
+ "graph":{
+ "type":"Line",
+ "step":false,
+ "smooth":false,
+ "showSymbol":false,
+ "showXAxis":true,
+ "showYAxis":true
+ },
+ "widget":{
+ "title":"All Operations Runtime/s"
+ }
+ },
+ {
+ "x":0,
+ "y":35,
+ "w":8,
+ "h":13,
+ "i":"4",
+ "type":"Widget",
+ "id":"4",
+ "metricTypes":[
+ "readMetricsValues",
+ "readMetricsValues",
+ "readMetricsValues",
+ "readMetricsValues"
+ ],
+ "metrics":[
+ "meter_elasticsearch_index_search_fetch_avg_time",
+ "meter_elasticsearch_index_search_query_avg_time",
+ "meter_elasticsearch_index_search_scroll_avg_time",
+ "meter_elasticsearch_index_search_suggest_avg_time"
+ ],
+ "moved":false,
+ "graph":{
+ "type":"Line",
+ "step":false,
+ "smooth":false,
+ "showSymbol":false,
+ "showXAxis":true,
+ "showYAxis":true
+ },
+ "widget":{
+ "title":"Avg. Search Time Execute / Request (s)"
+ }
+ },
+ {
+ "x":8,
+ "y":35,
+ "w":8,
+ "h":13,
+ "i":"5",
+ "type":"Widget",
+ "id":"5",
+ "metricTypes":[
+ "readMetricsValues",
+ "readMetricsValues",
+ "readMetricsValues",
+ "readMetricsValues"
+ ],
+ "metrics":[
+ "meter_elasticsearch_index_stats_search_fetch_total_req_rate",
+ "meter_elasticsearch_index_stats_search_query_total_req_rate",
+ "meter_elasticsearch_index_stats_search_scroll_total_req_rate",
+ "meter_elasticsearch_index_stats_search_suggest_total_req_rate"
+ ],
+ "moved":false,
+ "graph":{
+ "type":"Line",
+ "step":false,
+ "smooth":false,
+ "showSymbol":false,
+ "showXAxis":true,
+ "showYAxis":true
+ },
+ "metricConfig":[
+
+ ],
+ "widget":{
+ "title":"Search Operations Rate (req/s)"
+ }
+ },
+ {
+ "x":16,
+ "y":59,
+ "w":8,
+ "h":11,
+ "i":"6",
+ "type":"Widget",
+ "id":"6",
+ "metricTypes":[
+ "readMetricsValues"
+ ],
+ "metrics":[
+ "meter_elasticsearch_index_indices_store_size_bytes_total"
+ ],
+ "moved":false,
+ "graph":{
+ "type":"Line",
+ "step":false,
+ "smooth":false,
+ "showSymbol":false,
+ "showXAxis":true,
+ "showYAxis":true
+ },
+ "widget":{
+ "title":"Total size of stored index data (All Shards)"
+ },
+ "metricConfig":[
+ {
+ "calculation":"byteToMB"
+ }
+ ]
+ },
+ {
+ "x":0,
+ "y":59,
+ "w":8,
+ "h":11,
+ "i":"7",
+ "type":"Widget",
+ "id":"7",
+ "metricTypes":[
+ "readMetricsValues"
+ ],
+ "metrics":[
+ "meter_elasticsearch_index_indices_docs_total"
+ ],
+ "moved":false,
+ "graph":{
+ "type":"Line",
+ "step":false,
+ "smooth":false,
+ "showSymbol":false,
+ "showXAxis":true,
+ "showYAxis":true
+ },
+ "widget":{
+ "title":"Documents (All Shards)"
+ }
+ },
+ {
+ "x":8,
+ "y":59,
+ "w":8,
+ "h":11,
+ "i":"8",
+ "type":"Widget",
+ "id":"8",
+ "metricTypes":[
+ "readMetricsValues"
+ ],
+ "metrics":[
+ "meter_elasticsearch_index_indices_docs_total_rate"
+ ],
+ "moved":false,
+ "graph":{
+ "type":"Line",
+ "step":false,
+ "smooth":false,
+ "showSymbol":false,
+ "showXAxis":true,
+ "showYAxis":true
+ },
+ "widget":{
+ "title":"Documents Rate (All Shards)"
Review Comment:
What is Documents Rate? I think this is wrong from a grammar perspective.
--
This is an automated message from the Apache Git Service.
To respond to the message, please log on to GitHub and use the
URL above to go to the specific comment.
To unsubscribe, e-mail: notifications-unsubscribe@skywalking.apache.org
For queries about this service, please contact Infrastructure at:
users@infra.apache.org
[GitHub] [skywalking] wu-sheng commented on a diff in pull request #10690: Support Elasticsearch monitoring
Posted by "wu-sheng (via GitHub)" <gi...@apache.org>.
wu-sheng commented on code in PR #10690:
URL: https://github.com/apache/skywalking/pull/10690#discussion_r1168061788


##########
oap-server/server-starter/src/main/resources/ui-initialized-templates/elasticsearch/elasticsearch-index.json:
##########
@@ -0,0 +1,674 @@
+/**
+ * Licensed to the Apache Software Foundation (ASF) under one or more
+ * contributor license agreements.  See the NOTICE file distributed with
+ * this work for additional information regarding copyright ownership.
+ * The ASF licenses this file to You under the Apache License, Version 2.0
+ * (the "License"); you may not use this file except in compliance with
+ * the License.  You may obtain a copy of the License at
+ *
+ *      http://www.apache.org/licenses/LICENSE-2.0
+ *
+ * Unless required by applicable law or agreed to in writing, software
+ * distributed under the License is distributed on an "AS IS" BASIS,
+ * WITHOUT WARRANTIES OR CONDITIONS OF ANY KIND, either express or implied.
+ * See the License for the specific language governing permissions and
+ * limitations under the License.
+ */
+[
+  {
+    "id": "Elasticsearch-Index",
+    "configuration": {
+      "children":[
+        {
+          "x":0,
+          "y":6,
+          "w":12,
+          "h":13,
+          "i":"0",
+          "type":"Widget",
+          "id":"0",
+          "metricTypes":[
+            "readMetricsValues",
+            "readMetricsValues"
+          ],
+          "metrics":[
+            "meter_elasticsearch_index_stats_indexing_index_total_req_rate",
+            "meter_elasticsearch_index_stats_indexing_index_total_proc_rate"
+          ],
+          "moved":false,
+          "graph":{
+            "type":"Line",
+            "step":false,
+            "smooth":false,
+            "showSymbol":false,
+            "showXAxis":true,
+            "showYAxis":true
+          },
+          "widget":{
+            "title":"Indexing rate"
+          }
+        },
+        {
+          "x":12,
+          "y":6,
+          "w":12,
+          "h":13,
+          "i":"1",
+          "type":"Widget",
+          "id":"1",
+          "metricTypes":[
+            "readMetricsValues",
+            "readMetricsValues"
+          ],
+          "metrics":[
+            "meter_elasticsearch_index_stats_search_query_total_req_rate",
+            "meter_elasticsearch_index_stats_search_query_total_proc_rate"
+          ],
+          "moved":false,
+          "graph":{
+            "type":"Line",
+            "step":false,
+            "smooth":false,
+            "showSymbol":false,
+            "showXAxis":true,
+            "showYAxis":true
+          },
+          "widget":{
+            "title":"Searching rate"
+          }
+        },
+        {
+          "x":0,
+          "y":19,
+          "w":12,
+          "h":16,
+          "i":"2",
+          "type":"Widget",
+          "id":"2",
+          "metricTypes":[
+            "readMetricsValues",
+            "readMetricsValues",
+            "readMetricsValues",
+            "readMetricsValues",
+            "readMetricsValues",
+            "readMetricsValues",
+            "readMetricsValues",
+            "readMetricsValues",
+            "readMetricsValues",
+            "readMetricsValues",
+            "readMetricsValues"
+          ],
+          "metrics":[
+            "meter_elasticsearch_index_stats_merge_total_req_rate",
+            "meter_elasticsearch_index_stats_flush_total_req_rate",
+            "meter_elasticsearch_index_stats_refresh_total_req_rate",
+            "meter_elasticsearch_index_stats_warmer_total_req_rate",
+            "meter_elasticsearch_index_stats_indexing_delete_total_req_rate",
+            "meter_elasticsearch_index_stats_search_fetch_total_req_rate",
+            "meter_elasticsearch_index_stats_search_query_total_req_rate",
+            "meter_elasticsearch_index_stats_search_scroll_total_req_rate",
+            "meter_elasticsearch_index_stats_search_suggest_total_req_rate",
+            "meter_elasticsearch_index_stats_indexing_index_total_req_rate",
+            "meter_elasticsearch_index_stats_get_total_req_rate"
+          ],
+          "moved":false,
+          "graph":{
+            "type":"Line",
+            "step":false,
+            "smooth":false,
+            "showSymbol":false,
+            "showXAxis":true,
+            "showYAxis":true
+          },
+          "widget":{
+            "title":"All Operations ReqRate"
+          }
+        },
+        {
+          "x":12,
+          "y":19,
+          "w":12,
+          "h":16,
+          "i":"3",
+          "type":"Widget",
+          "id":"3",
+          "metricTypes":[
+            "readMetricsValues",
+            "readMetricsValues",
+            "readMetricsValues",
+            "readMetricsValues",
+            "readMetricsValues",
+            "readMetricsValues",
+            "readMetricsValues",
+            "readMetricsValues",
+            "readMetricsValues",
+            "readMetricsValues",
+            "readMetricsValues",
+            "readMetricsValues",
+            "readMetricsValues",
+            "readMetricsValues"
+          ],
+          "metrics":[
+            "meter_elasticsearch_index_stats_merge_time_seconds_total",
+            "meter_elasticsearch_index_stats_flush_time_seconds_total",
+            "meter_elasticsearch_index_stats_refresh_time_seconds_total",
+            "meter_elasticsearch_index_stats_warmer_time_seconds_total",
+            "meter_elasticsearch_index_stats_indexing_delete_time_seconds_total",
+            "meter_elasticsearch_index_stats_search_fetch_time_seconds_total",
+            "meter_elasticsearch_index_stats_search_query_time_seconds_total",
+            "meter_elasticsearch_index_stats_search_scroll_time_seconds_total",
+            "meter_elasticsearch_index_stats_search_suggest_time_seconds_total",
+            "meter_elasticsearch_index_stats_indexing_index_time_seconds_total",
+            "meter_elasticsearch_index_stats_get_time_seconds_total",
+            "meter_elasticsearch_index_stats_merge_stopped_time_seconds_total",
+            "meter_elasticsearch_index_stats_merge_throttle_time_seconds_total",
+            "meter_elasticsearch_index_stats_indexing_throttle_time_seconds_total"
+          ],
+          "moved":false,
+          "graph":{
+            "type":"Line",
+            "step":false,
+            "smooth":false,
+            "showSymbol":false,
+            "showXAxis":true,
+            "showYAxis":true
+          },
+          "widget":{
+            "title":"All Operations Runtime/s"
+          }
+        },
+        {
+          "x":0,
+          "y":35,
+          "w":8,
+          "h":13,
+          "i":"4",
+          "type":"Widget",
+          "id":"4",
+          "metricTypes":[
+            "readMetricsValues",
+            "readMetricsValues",
+            "readMetricsValues",
+            "readMetricsValues"
+          ],
+          "metrics":[
+            "meter_elasticsearch_index_search_fetch_avg_time",
+            "meter_elasticsearch_index_search_query_avg_time",
+            "meter_elasticsearch_index_search_scroll_avg_time",
+            "meter_elasticsearch_index_search_suggest_avg_time"
+          ],
+          "moved":false,
+          "graph":{
+            "type":"Line",
+            "step":false,
+            "smooth":false,
+            "showSymbol":false,
+            "showXAxis":true,
+            "showYAxis":true
+          },
+          "widget":{
+            "title":"Avg. Search Time Execute / Request (s)"
+          }
+        },
+        {
+          "x":8,
+          "y":35,
+          "w":8,
+          "h":13,
+          "i":"5",
+          "type":"Widget",
+          "id":"5",
+          "metricTypes":[
+            "readMetricsValues",
+            "readMetricsValues",
+            "readMetricsValues",
+            "readMetricsValues"
+          ],
+          "metrics":[
+            "meter_elasticsearch_index_stats_search_fetch_total_req_rate",
+            "meter_elasticsearch_index_stats_search_query_total_req_rate",
+            "meter_elasticsearch_index_stats_search_scroll_total_req_rate",
+            "meter_elasticsearch_index_stats_search_suggest_total_req_rate"
+          ],
+          "moved":false,
+          "graph":{
+            "type":"Line",
+            "step":false,
+            "smooth":false,
+            "showSymbol":false,
+            "showXAxis":true,
+            "showYAxis":true
+          },
+          "metricConfig":[
+
+          ],
+          "widget":{
+            "title":"Search Operations  Rate (req/s)"
+          }
+        },
+        {
+          "x":16,
+          "y":59,
+          "w":8,
+          "h":11,
+          "i":"6",
+          "type":"Widget",
+          "id":"6",
+          "metricTypes":[
+            "readMetricsValues"
+          ],
+          "metrics":[
+            "meter_elasticsearch_index_indices_store_size_bytes_total"
+          ],
+          "moved":false,
+          "graph":{
+            "type":"Line",
+            "step":false,
+            "smooth":false,
+            "showSymbol":false,
+            "showXAxis":true,
+            "showYAxis":true
+          },
+          "widget":{
+            "title":"Total size of stored index data (All Shards)"
+          },
+          "metricConfig":[
+            {
+              "calculation":"byteToMB"
+            }
+          ]
+        },
+        {
+          "x":0,
+          "y":59,
+          "w":8,
+          "h":11,
+          "i":"7",
+          "type":"Widget",
+          "id":"7",
+          "metricTypes":[
+            "readMetricsValues"
+          ],
+          "metrics":[
+            "meter_elasticsearch_index_indices_docs_total"
+          ],
+          "moved":false,
+          "graph":{
+            "type":"Line",
+            "step":false,
+            "smooth":false,
+            "showSymbol":false,
+            "showXAxis":true,
+            "showYAxis":true
+          },
+          "widget":{
+            "title":"Documents (All Shards)"
+          }
+        },
+        {
+          "x":8,
+          "y":59,
+          "w":8,
+          "h":11,
+          "i":"8",
+          "type":"Widget",
+          "id":"8",
+          "metricTypes":[
+            "readMetricsValues"
+          ],
+          "metrics":[
+            "meter_elasticsearch_index_indices_docs_total_rate"
+          ],
+          "moved":false,
+          "graph":{
+            "type":"Line",
+            "step":false,
+            "smooth":false,
+            "showSymbol":false,
+            "showXAxis":true,
+            "showYAxis":true
+          },
+          "widget":{
+            "title":"Documents Rate (All Shards)"
+          }
+        },
+        {
+          "x":0,
+          "y":48,
+          "w":8,
+          "h":11,
+          "i":"9",
+          "type":"Widget",
+          "id":"9",
+          "metricTypes":[
+            "readMetricsValues"
+          ],
+          "metrics":[
+            "meter_elasticsearch_index_indices_docs_primary"
+          ],
+          "moved":false,
+          "graph":{
+            "type":"Line",
+            "step":false,
+            "smooth":false,
+            "showSymbol":false,
+            "showXAxis":true,
+            "showYAxis":true
+          },
+          "widget":{
+            "title":"Documents (Primary Shards)"
+          }
+        },
+        {
+          "x":8,
+          "y":48,
+          "w":8,
+          "h":11,
+          "i":"10",
+          "type":"Widget",
+          "id":"10",
+          "metricTypes":[
+            "readMetricsValues"
+          ],
+          "metrics":[
+            "meter_elasticsearch_index_indices_docs_primary_rate"
+          ],
+          "moved":false,
+          "graph":{
+            "type":"Line",
+            "step":false,
+            "smooth":false,
+            "showSymbol":false,
+            "showXAxis":true,
+            "showYAxis":true
+          },
+          "widget":{
+            "title":"Documents Rate (Primary Shards)"
+          }
+        },
+        {
+          "x":16,
+          "y":48,
+          "w":8,
+          "h":11,
+          "i":"11",
+          "type":"Widget",
+          "id":"11",
+          "metricTypes":[
+            "readMetricsValues"
+          ],
+          "metrics":[
+            "meter_elasticsearch_index_indices_store_size_bytes_primary"
+          ],
+          "moved":false,
+          "graph":{
+            "type":"Line",
+            "step":false,
+            "smooth":false,
+            "showSymbol":false,
+            "showXAxis":true,
+            "showYAxis":true
+          },
+          "metricConfig":[
+            {
+              "calculation":"byteToMB"
+            }
+          ],
+          "widget":{
+            "title":"Total size of stored index data (Primary Shards) (MB)"
+          }
+        },
+        {
+          "x":0,
+          "y":0,
+          "w":3,
+          "h":6,
+          "i":"12",
+          "type":"Widget",
+          "id":"12",
+          "metricTypes":[
+            "readMetricsValue"
+          ],
+          "metrics":[
+            "meter_elasticsearch_index_indices_docs_primary"
+          ],
+          "moved":false,
+          "graph":{
+            "type":"Card",
+            "fontSize":14,
+            "textAlign":"center",
+            "showUnit":true
+          },
+          "widget":{
+            "title":"Documents Primary"
+          }
+        },
+        {
+          "x":9,
+          "y":0,
+          "w":3,
+          "h":6,
+          "i":"14",
+          "type":"Widget",
+          "id":"14",
+          "metricTypes":[
+            "readMetricsValues"
+          ],
+          "metrics":[
+            "meter_elasticsearch_index_indices_store_size_bytes_total"
+          ],
+          "moved":false,
+          "graph":{
+            "type":"Card",
+            "fontSize":14,
+            "textAlign":"center",
+            "showUnit":true
+          },
+          "metricConfig":[
+            {
+              "calculation":"byteToGB"
+            }
+          ],
+          "widget":{
+            "title":"Data (GB)"
+          }
+        },
+        {
+          "x":6,
+          "y":0,
+          "w":3,
+          "h":6,
+          "i":"15",
+          "type":"Widget",
+          "id":"15",
+          "metricTypes":[
+            "readMetricsValues"
+          ],
+          "metrics":[
+            "meter_elasticsearch_index_indices_store_size_bytes_primary"
+          ],
+          "moved":false,
+          "graph":{
+            "type":"Card",
+            "fontSize":14,
+            "textAlign":"center",
+            "showUnit":true
+          },
+          "metricConfig":[
+            {
+              "calculation":"byteToGB"
+            }
+          ],
+          "widget":{
+            "title":"Data Primary (GB)"
+          }
+        },
+        {
+          "x":18,
+          "y":0,
+          "w":3,
+          "h":6,
+          "i":"16",
+          "type":"Widget",
+          "id":"16",
+          "metricTypes":[
+            "readMetricsValues"
+          ],
+          "metrics":[
+            "meter_elasticsearch_index_indices_segment_count_total"
+          ],
+          "moved":false,
+          "graph":{
+            "type":"Card",
+            "fontSize":14,
+            "textAlign":"center",
+            "showUnit":true
+          },
+          "widget":{
+            "title":"Segments"

Review Comment:
   ```suggestion
               "title":"Segments Count"
   ```


--
This is an automated message from the Apache Git Service.
To respond to the message, please log on to GitHub and use the
URL above to go to the specific comment.

To unsubscribe, e-mail: notifications-unsubscribe@skywalking.apache.org

For queries about this service, please contact Infrastructure at:
users@infra.apache.org
[GitHub] [skywalking] innerpeacez commented on pull request #10690: Support Elasticsearch monitoring
Posted by "innerpeacez (via GitHub)" <gi...@apache.org>.
innerpeacez commented on PR #10690:
URL: https://github.com/apache/skywalking/pull/10690#issuecomment-1510342544

   > After the e2e tests added and merged, you should update showcase to add ElasticSearch monitoring too.

   Sure, I will write a showcase.


--
This is an automated message from the Apache Git Service.
To respond to the message, please log on to GitHub and use the
URL above to go to the specific comment.

To unsubscribe, e-mail: notifications-unsubscribe@skywalking.apache.org

For queries about this service, please contact Infrastructure at:
users@infra.apache.org
[GitHub] [skywalking] innerpeacez commented on a diff in pull request #10690: Support Elasticsearch monitoring
Posted by "innerpeacez (via GitHub)" <gi...@apache.org>.
innerpeacez commented on code in PR #10690:
URL: https://github.com/apache/skywalking/pull/10690#discussion_r1168099694


##########
oap-server/server-starter/src/main/resources/ui-initialized-templates/elasticsearch/elasticsearch-index.json:
##########
@@ -0,0 +1,674 @@
+/**
+ * Licensed to the Apache Software Foundation (ASF) under one or more
+ * contributor license agreements.  See the NOTICE file distributed with
+ * this work for additional information regarding copyright ownership.
+ * The ASF licenses this file to You under the Apache License, Version 2.0
+ * (the "License"); you may not use this file except in compliance with
+ * the License.  You may obtain a copy of the License at
+ *
+ *      http://www.apache.org/licenses/LICENSE-2.0
+ *
+ * Unless required by applicable law or agreed to in writing, software
+ * distributed under the License is distributed on an "AS IS" BASIS,
+ * WITHOUT WARRANTIES OR CONDITIONS OF ANY KIND, either express or implied.
+ * See the License for the specific language governing permissions and
+ * limitations under the License.
+ */
+[
+  {
+    "id": "Elasticsearch-Index",
+    "configuration": {
+      "children":[
+        {
+          "x":0,
+          "y":6,
+          "w":12,
+          "h":13,
+          "i":"0",
+          "type":"Widget",
+          "id":"0",
+          "metricTypes":[
+            "readMetricsValues",
+            "readMetricsValues"
+          ],
+          "metrics":[
+            "meter_elasticsearch_index_stats_indexing_index_total_req_rate",
+            "meter_elasticsearch_index_stats_indexing_index_total_proc_rate"
+          ],
+          "moved":false,
+          "graph":{
+            "type":"Line",
+            "step":false,
+            "smooth":false,
+            "showSymbol":false,
+            "showXAxis":true,
+            "showYAxis":true
+          },
+          "widget":{
+            "title":"Indexing rate"
+          }
+        },
+        {
+          "x":12,
+          "y":6,
+          "w":12,
+          "h":13,
+          "i":"1",
+          "type":"Widget",
+          "id":"1",
+          "metricTypes":[
+            "readMetricsValues",
+            "readMetricsValues"
+          ],
+          "metrics":[
+            "meter_elasticsearch_index_stats_search_query_total_req_rate",
+            "meter_elasticsearch_index_stats_search_query_total_proc_rate"
+          ],
+          "moved":false,
+          "graph":{
+            "type":"Line",
+            "step":false,
+            "smooth":false,
+            "showSymbol":false,

Review Comment:
   I am using this repo (https://github.com/apache/skywalking-booster-ui) directly and did not use the submodule webapp.


--
This is an automated message from the Apache Git Service.
To respond to the message, please log on to GitHub and use the
URL above to go to the specific comment.

To unsubscribe, e-mail: notifications-unsubscribe@skywalking.apache.org

For queries about this service, please contact Infrastructure at:
users@infra.apache.org
[GitHub] [skywalking] wu-sheng commented on a diff in pull request #10690: Support Elasticsearch monitoring
Posted by "wu-sheng (via GitHub)" <gi...@apache.org>.
wu-sheng commented on code in PR #10690:
URL: https://github.com/apache/skywalking/pull/10690#discussion_r1168061665


##########
oap-server/server-starter/src/main/resources/ui-initialized-templates/elasticsearch/elasticsearch-index.json:
##########
@@ -0,0 +1,674 @@
+/**
+ * Licensed to the Apache Software Foundation (ASF) under one or more
+ * contributor license agreements.  See the NOTICE file distributed with
+ * this work for additional information regarding copyright ownership.
+ * The ASF licenses this file to You under the Apache License, Version 2.0
+ * (the "License"); you may not use this file except in compliance with
+ * the License.  You may obtain a copy of the License at
+ *
+ *      http://www.apache.org/licenses/LICENSE-2.0
+ *
+ * Unless required by applicable law or agreed to in writing, software
+ * distributed under the License is distributed on an "AS IS" BASIS,
+ * WITHOUT WARRANTIES OR CONDITIONS OF ANY KIND, either express or implied.
+ * See the License for the specific language governing permissions and
+ * limitations under the License.
+ */
+[
+  {
+    "id": "Elasticsearch-Index",
+    "configuration": {
+      "children":[
+        {
+          "x":0,
+          "y":6,
+          "w":12,
+          "h":13,
+          "i":"0",
+          "type":"Widget",
+          "id":"0",
+          "metricTypes":[
+            "readMetricsValues",
+            "readMetricsValues"
+          ],
+          "metrics":[
+            "meter_elasticsearch_index_stats_indexing_index_total_req_rate",
+            "meter_elasticsearch_index_stats_indexing_index_total_proc_rate"
+          ],
+          "moved":false,
+          "graph":{
+            "type":"Line",
+            "step":false,
+            "smooth":false,
+            "showSymbol":false,
+            "showXAxis":true,
+            "showYAxis":true
+          },
+          "widget":{
+            "title":"Indexing rate"
+          }
+        },
+        {
+          "x":12,
+          "y":6,
+          "w":12,
+          "h":13,
+          "i":"1",
+          "type":"Widget",
+          "id":"1",
+          "metricTypes":[
+            "readMetricsValues",
+            "readMetricsValues"
+          ],
+          "metrics":[
+            "meter_elasticsearch_index_stats_search_query_total_req_rate",
+            "meter_elasticsearch_index_stats_search_query_total_proc_rate"
+          ],
+          "moved":false,
+          "graph":{
+            "type":"Line",
+            "step":false,
+            "smooth":false,
+            "showSymbol":false,
+            "showXAxis":true,
+            "showYAxis":true
+          },
+          "widget":{
+            "title":"Searching rate"
+          }
+        },
+        {
+          "x":0,
+          "y":19,
+          "w":12,
+          "h":16,
+          "i":"2",
+          "type":"Widget",
+          "id":"2",
+          "metricTypes":[
+            "readMetricsValues",
+            "readMetricsValues",
+            "readMetricsValues",
+            "readMetricsValues",
+            "readMetricsValues",
+            "readMetricsValues",
+            "readMetricsValues",
+            "readMetricsValues",
+            "readMetricsValues",
+            "readMetricsValues",
+            "readMetricsValues"
+          ],
+          "metrics":[
+            "meter_elasticsearch_index_stats_merge_total_req_rate",
+            "meter_elasticsearch_index_stats_flush_total_req_rate",
+            "meter_elasticsearch_index_stats_refresh_total_req_rate",
+            "meter_elasticsearch_index_stats_warmer_total_req_rate",
+            "meter_elasticsearch_index_stats_indexing_delete_total_req_rate",
+            "meter_elasticsearch_index_stats_search_fetch_total_req_rate",
+            "meter_elasticsearch_index_stats_search_query_total_req_rate",
+            "meter_elasticsearch_index_stats_search_scroll_total_req_rate",
+            "meter_elasticsearch_index_stats_search_suggest_total_req_rate",
+            "meter_elasticsearch_index_stats_indexing_index_total_req_rate",
+            "meter_elasticsearch_index_stats_get_total_req_rate"
+          ],
+          "moved":false,
+          "graph":{
+            "type":"Line",
+            "step":false,
+            "smooth":false,
+            "showSymbol":false,
+            "showXAxis":true,
+            "showYAxis":true
+          },
+          "widget":{
+            "title":"All Operations ReqRate"
+          }
+        },
+        {
+          "x":12,
+          "y":19,
+          "w":12,
+          "h":16,
+          "i":"3",
+          "type":"Widget",
+          "id":"3",
+          "metricTypes":[
+            "readMetricsValues",
+            "readMetricsValues",
+            "readMetricsValues",
+            "readMetricsValues",
+            "readMetricsValues",
+            "readMetricsValues",
+            "readMetricsValues",
+            "readMetricsValues",
+            "readMetricsValues",
+            "readMetricsValues",
+            "readMetricsValues",
+            "readMetricsValues",
+            "readMetricsValues",
+            "readMetricsValues"
+          ],
+          "metrics":[
+            "meter_elasticsearch_index_stats_merge_time_seconds_total",
+            "meter_elasticsearch_index_stats_flush_time_seconds_total",
+            "meter_elasticsearch_index_stats_refresh_time_seconds_total",
+            "meter_elasticsearch_index_stats_warmer_time_seconds_total",
+            "meter_elasticsearch_index_stats_indexing_delete_time_seconds_total",
+            "meter_elasticsearch_index_stats_search_fetch_time_seconds_total",
+            "meter_elasticsearch_index_stats_search_query_time_seconds_total",
+            "meter_elasticsearch_index_stats_search_scroll_time_seconds_total",
+            "meter_elasticsearch_index_stats_search_suggest_time_seconds_total",
+            "meter_elasticsearch_index_stats_indexing_index_time_seconds_total",
+            "meter_elasticsearch_index_stats_get_time_seconds_total",
+            "meter_elasticsearch_index_stats_merge_stopped_time_seconds_total",
+            "meter_elasticsearch_index_stats_merge_throttle_time_seconds_total",
+            "meter_elasticsearch_index_stats_indexing_throttle_time_seconds_total"
+          ],
+          "moved":false,
+          "graph":{
+            "type":"Line",
+            "step":false,
+            "smooth":false,
+            "showSymbol":false,
+            "showXAxis":true,
+            "showYAxis":true
+          },
+          "widget":{
+            "title":"All Operations Runtime/s"
+          }
+        },
+        {
+          "x":0,
+          "y":35,
+          "w":8,
+          "h":13,
+          "i":"4",
+          "type":"Widget",
+          "id":"4",
+          "metricTypes":[
+            "readMetricsValues",
+            "readMetricsValues",
+            "readMetricsValues",
+            "readMetricsValues"
+          ],
+          "metrics":[
+            "meter_elasticsearch_index_search_fetch_avg_time",
+            "meter_elasticsearch_index_search_query_avg_time",
+            "meter_elasticsearch_index_search_scroll_avg_time",
+            "meter_elasticsearch_index_search_suggest_avg_time"
+          ],
+          "moved":false,
+          "graph":{
+            "type":"Line",
+            "step":false,
+            "smooth":false,
+            "showSymbol":false,
+            "showXAxis":true,
+            "showYAxis":true
+          },
+          "widget":{
+            "title":"Avg. Search Time Execute / Request (s)"
+          }
+        },
+        {
+          "x":8,
+          "y":35,
+          "w":8,
+          "h":13,
+          "i":"5",
+          "type":"Widget",
+          "id":"5",
+          "metricTypes":[
+            "readMetricsValues",
+            "readMetricsValues",
+            "readMetricsValues",
+            "readMetricsValues"
+          ],
+          "metrics":[
+            "meter_elasticsearch_index_stats_search_fetch_total_req_rate",
+            "meter_elasticsearch_index_stats_search_query_total_req_rate",
+            "meter_elasticsearch_index_stats_search_scroll_total_req_rate",
+            "meter_elasticsearch_index_stats_search_suggest_total_req_rate"
+          ],
+          "moved":false,
+          "graph":{
+            "type":"Line",
+            "step":false,
+            "smooth":false,
+            "showSymbol":false,
+            "showXAxis":true,
+            "showYAxis":true
+          },
+          "metricConfig":[
+
+          ],
+          "widget":{
+            "title":"Search Operations  Rate (req/s)"
+          }
+        },
+        {
+          "x":16,
+          "y":59,
+          "w":8,
+          "h":11,
+          "i":"6",
+          "type":"Widget",
+          "id":"6",
+          "metricTypes":[
+            "readMetricsValues"
+          ],
+          "metrics":[
+            "meter_elasticsearch_index_indices_store_size_bytes_total"
+          ],
+          "moved":false,
+          "graph":{
+            "type":"Line",
+            "step":false,
+            "smooth":false,
+            "showSymbol":false,
+            "showXAxis":true,
+            "showYAxis":true
+          },
+          "widget":{
+            "title":"Total size of stored index data (All Shards)"
+          },
+          "metricConfig":[
+            {
+              "calculation":"byteToMB"
+            }
+          ]
+        },
+        {
+          "x":0,
+          "y":59,
+          "w":8,
+          "h":11,
+          "i":"7",
+          "type":"Widget",
+          "id":"7",
+          "metricTypes":[
+            "readMetricsValues"
+          ],
+          "metrics":[
+            "meter_elasticsearch_index_indices_docs_total"
+          ],
+          "moved":false,
+          "graph":{
+            "type":"Line",
+            "step":false,
+            "smooth":false,
+            "showSymbol":false,
+            "showXAxis":true,
+            "showYAxis":true
+          },
+          "widget":{
+            "title":"Documents (All Shards)"
+          }
+        },
+        {
+          "x":8,
+          "y":59,
+          "w":8,
+          "h":11,
+          "i":"8",
+          "type":"Widget",
+          "id":"8",
+          "metricTypes":[
+            "readMetricsValues"
+          ],
+          "metrics":[
+            "meter_elasticsearch_index_indices_docs_total_rate"
+          ],
+          "moved":false,
+          "graph":{
+            "type":"Line",
+            "step":false,
+            "smooth":false,
+            "showSymbol":false,
+            "showXAxis":true,
+            "showYAxis":true
+          },
+          "widget":{
+            "title":"Documents Rate (All Shards)"
+          }
+        },
+        {
+          "x":0,
+          "y":48,
+          "w":8,
+          "h":11,
+          "i":"9",
+          "type":"Widget",
+          "id":"9",
+          "metricTypes":[
+            "readMetricsValues"
+          ],
+          "metrics":[
+            "meter_elasticsearch_index_indices_docs_primary"
+          ],
+          "moved":false,
+          "graph":{
+            "type":"Line",
+            "step":false,
+            "smooth":false,
+            "showSymbol":false,
+            "showXAxis":true,
+            "showYAxis":true
+          },
+          "widget":{
+            "title":"Documents (Primary Shards)"
+          }
+        },
+        {
+          "x":8,
+          "y":48,
+          "w":8,
+          "h":11,
+          "i":"10",
+          "type":"Widget",
+          "id":"10",
+          "metricTypes":[
+            "readMetricsValues"
+          ],
+          "metrics":[
+            "meter_elasticsearch_index_indices_docs_primary_rate"
+          ],
+          "moved":false,
+          "graph":{
+            "type":"Line",
+            "step":false,
+            "smooth":false,
+            "showSymbol":false,
+            "showXAxis":true,
+            "showYAxis":true
+          },
+          "widget":{
+            "title":"Documents Rate (Primary Shards)"
+          }
+        },
+        {
+          "x":16,
+          "y":48,
+          "w":8,
+          "h":11,
+          "i":"11",
+          "type":"Widget",
+          "id":"11",
+          "metricTypes":[
+            "readMetricsValues"
+          ],
+          "metrics":[
+            "meter_elasticsearch_index_indices_store_size_bytes_primary"
+          ],
+          "moved":false,
+          "graph":{
+            "type":"Line",
+            "step":false,
+            "smooth":false,
+            "showSymbol":false,
+            "showXAxis":true,
+            "showYAxis":true
+          },
+          "metricConfig":[
+            {
+              "calculation":"byteToMB"
+            }
+          ],
+          "widget":{
+            "title":"Total size of stored index data (Primary Shards) (MB)"
+          }
+        },
+        {
+          "x":0,
+          "y":0,
+          "w":3,
+          "h":6,
+          "i":"12",
+          "type":"Widget",
+          "id":"12",
+          "metricTypes":[
+            "readMetricsValue"
+          ],
+          "metrics":[
+            "meter_elasticsearch_index_indices_docs_primary"
+          ],
+          "moved":false,
+          "graph":{
+            "type":"Card",
+            "fontSize":14,
+            "textAlign":"center",
+            "showUnit":true
+          },
+          "widget":{
+            "title":"Documents Primary"

Review Comment:
   ```suggestion
               "title":"Documents Count (Primary Shard)"
   ```

   Meanwhile, the letter case is not consistent yet.


--
This is an automated message from the Apache Git Service.
To respond to the message, please log on to GitHub and use the
URL above to go to the specific comment.

To unsubscribe, e-mail: notifications-unsubscribe@skywalking.apache.org

For queries about this service, please contact Infrastructure at:
users@infra.apache.org
[GitHub] [skywalking] innerpeacez commented on a diff in pull request #10690: Support Elasticsearch monitoring
Posted by "innerpeacez (via GitHub)" <gi...@apache.org>.
innerpeacez commented on code in PR #10690:
URL: https://github.com/apache/skywalking/pull/10690#discussion_r1167878169


##########
oap-server/server-starter/src/main/resources/otel-rules/elasticsearch/elasticsearch-index.yaml:
##########
@@ -0,0 +1,127 @@
+# Licensed to the Apache Software Foundation (ASF) under one or more
+# contributor license agreements.  See the NOTICE file distributed with
+# this work for additional information regarding copyright ownership.
+# The ASF licenses this file to You under the Apache License, Version 2.0
+# (the "License"); you may not use this file except in compliance with
+# the License.  You may obtain a copy of the License at
+#
+#     http://www.apache.org/licenses/LICENSE-2.0
+#
+# Unless required by applicable law or agreed to in writing, software
+# distributed under the License is distributed on an "AS IS" BASIS,
+# WITHOUT WARRANTIES OR CONDITIONS OF ANY KIND, either express or implied.
+# See the License for the specific language governing permissions and
+# limitations under the License.
+
+# This will parse a textual representation of a duration. The formats
+# accepted are based on the ISO-8601 duration format {@code PnDTnHnMn.nS}
+# with days considered to be exactly 24 hours.
+# <p>
+# Examples:
+# <pre>
+#    "PT20.345S" -- parses as "20.345 seconds"
+#    "PT15M"     -- parses as "15 minutes" (where a minute is 60 seconds)
+#    "PT10H"     -- parses as "10 hours" (where an hour is 3600 seconds)
+#    "P2D"       -- parses as "2 days" (where a day is 24 hours or 86400 seconds)
+#    "P2DT3H4M"  -- parses as "2 days, 3 hours and 4 minutes"
+#    "P-6H3M"    -- parses as "-6 hours and +3 minutes"
+#    "-P6H3M"    -- parses as "-6 hours and -3 minutes"
+#    "-P-6H+3M"  -- parses as "+6 hours and -3 minutes"
+# </pre>
+filter: "{ tags -> tags.job_name == 'elasticsearch-monitoring' }" # The OpenTelemetry job name
+expSuffix: tag({tags -> tags.cluster = 'elasticsearch::' + tags.cluster}).endpoint(['cluster'], ['index'], Layer.ELASTICSEARCH)
+metricPrefix: meter_elasticsearch_index
+metricsRules:
+  - name: stats_indexing_index_total_req_rate
+    exp: elasticsearch_index_stats_indexing_index_total.sum(['cluster' , 'index']).rate('PT1M')

Review Comment:
   > After the e2e tests added and merged, you should update showcase to add ElasticSearch monitoring too.

   Sure, I will write a showcase.


--
This is an automated message from the Apache Git Service.
To respond to the message, please log on to GitHub and use the
URL above to go to the specific comment.

To unsubscribe, e-mail: notifications-unsubscribe@skywalking.apache.org

For queries about this service, please contact Infrastructure at:
users@infra.apache.org
[GitHub] [skywalking] wankai123 commented on a diff in pull request #10690: Support Elasticsearch monitoring
Posted by "wankai123 (via GitHub)" <gi...@apache.org>.
wankai123 commented on code in PR #10690:
URL: https://github.com/apache/skywalking/pull/10690#discussion_r1172122824


##########
oap-server/server-starter/src/main/resources/ui-initialized-templates/elasticsearch/elasticsearch-index.json:
##########
@@ -0,0 +1,796 @@
+/**
+ * Licensed to the Apache Software Foundation (ASF) under one or more
+ * contributor license agreements.  See the NOTICE file distributed with
+ * this work for additional information regarding copyright ownership.
+ * The ASF licenses this file to You under the Apache License, Version 2.0
+ * (the "License"); you may not use this file except in compliance with
+ * the License.  You may obtain a copy of the License at
+ *
+ *      http://www.apache.org/licenses/LICENSE-2.0
+ *
+ * Unless required by applicable law or agreed to in writing, software
+ * distributed under the License is distributed on an "AS IS" BASIS,
+ * WITHOUT WARRANTIES OR CONDITIONS OF ANY KIND, either express or implied.
+ * See the License for the specific language governing permissions and
+ * limitations under the License.
+ */
+[
+  {
+    "id": "Elasticsearch-Index",
+    "configuration": {
+      "children":[
+        {
+          "x":0,
+          "y":6,
+          "w":12,
+          "h":13,
+          "i":"0",
+          "type":"Widget",
+          "id":"0",
+          "metricTypes":[
+            "readMetricsValues",
+            "readMetricsValues"
+          ],
+          "metrics":[
+            "meter_elasticsearch_index_stats_indexing_index_total_req_rate",
+            "meter_elasticsearch_index_stats_indexing_index_total_proc_rate"
+          ],
+          "moved":false,
+          "graph":{
+            "type":"Line",
+            "step":false,
+            "smooth":false,
+            "showSymbol":true,
+            "showXAxis":true,
+            "showYAxis":true
+          },
+          "widget":{
+            "title":"Indexing Rate",
+            "tips":"`proc rate`: processing ability, which is the number of requests that Elasticsearch can handle. Estimation is based on the processed requests and processed time for these requests."
+          },
+          "metricConfig":[
+            {
+              "label":"req rate"

Review Comment:
   ```suggestion
                 "label":"req_rate"
   ```
   Can we connect the words with `_`, then could try to keep all styles with others as consistent as possible


--
This is an automated message from the Apache Git Service.
To respond to the message, please log on to GitHub and use the
URL above to go to the specific comment.

To unsubscribe, e-mail: notifications-unsubscribe@skywalking.apache.org

For queries about this service, please contact Infrastructure at:
users@infra.apache.org
[GitHub] [skywalking] wu-sheng merged pull request #10690: Support Elasticsearch monitoring
Posted by "wu-sheng (via GitHub)" <gi...@apache.org>.
wu-sheng merged PR #10690:
URL: https://github.com/apache/skywalking/pull/10690


--
This is an automated message from the Apache Git Service.
To respond to the message, please log on to GitHub and use the
URL above to go to the specific comment.

To unsubscribe, e-mail: notifications-unsubscribe@skywalking.apache.org

For queries about this service, please contact Infrastructure at:
users@infra.apache.org
[GitHub] [skywalking] innerpeacez commented on pull request #10690: Support Elasticsearch monitoring
Posted by "innerpeacez (via GitHub)" <gi...@apache.org>.
innerpeacez commented on PR #10690:
URL: https://github.com/apache/skywalking/pull/10690#issuecomment-1515762878

   I have modified the label of the metric name and updated the screenshot again.


--
This is an automated message from the Apache Git Service.
To respond to the message, please log on to GitHub and use the
URL above to go to the specific comment.

To unsubscribe, e-mail: notifications-unsubscribe@skywalking.apache.org

For queries about this service, please contact Infrastructure at:
users@infra.apache.org
[GitHub] [skywalking] innerpeacez commented on a diff in pull request #10690: Support Elasticsearch monitoring
Posted by "innerpeacez (via GitHub)" <gi...@apache.org>.
innerpeacez commented on code in PR #10690:
URL: https://github.com/apache/skywalking/pull/10690#discussion_r1168099694


##########
oap-server/server-starter/src/main/resources/ui-initialized-templates/elasticsearch/elasticsearch-index.json:
##########
@@ -0,0 +1,674 @@
+/**
+ * Licensed to the Apache Software Foundation (ASF) under one or more
+ * contributor license agreements.  See the NOTICE file distributed with
+ * this work for additional information regarding copyright ownership.
+ * The ASF licenses this file to You under the Apache License, Version 2.0
+ * (the "License"); you may not use this file except in compliance with
+ * the License.  You may obtain a copy of the License at
+ *
+ *      http://www.apache.org/licenses/LICENSE-2.0
+ *
+ * Unless required by applicable law or agreed to in writing, software
+ * distributed under the License is distributed on an "AS IS" BASIS,
+ * WITHOUT WARRANTIES OR CONDITIONS OF ANY KIND, either express or implied.
+ * See the License for the specific language governing permissions and
+ * limitations under the License.
+ */
+[
+  {
+    "id": "Elasticsearch-Index",
+    "configuration": {
+      "children":[
+        {
+          "x":0,
+          "y":6,
+          "w":12,
+          "h":13,
+          "i":"0",
+          "type":"Widget",
+          "id":"0",
+          "metricTypes":[
+            "readMetricsValues",
+            "readMetricsValues"
+          ],
+          "metrics":[
+            "meter_elasticsearch_index_stats_indexing_index_total_req_rate",
+            "meter_elasticsearch_index_stats_indexing_index_total_proc_rate"
+          ],
+          "moved":false,
+          "graph":{
+            "type":"Line",
+            "step":false,
+            "smooth":false,
+            "showSymbol":false,
+            "showXAxis":true,
+            "showYAxis":true
+          },
+          "widget":{
+            "title":"Indexing rate"
+          }
+        },
+        {
+          "x":12,
+          "y":6,
+          "w":12,
+          "h":13,
+          "i":"1",
+          "type":"Widget",
+          "id":"1",
+          "metricTypes":[
+            "readMetricsValues",
+            "readMetricsValues"
+          ],
+          "metrics":[
+            "meter_elasticsearch_index_stats_search_query_total_req_rate",
+            "meter_elasticsearch_index_stats_search_query_total_proc_rate"
+          ],
+          "moved":false,
+          "graph":{
+            "type":"Line",
+            "step":false,
+            "smooth":false,
+            "showSymbol":false,

Review Comment:
   I am using this repo (https://github.com/apache/skywalking-booster-ui) directl and did not use the submodule webapp.


--
This is an automated message from the Apache Git Service.
To respond to the message, please log on to GitHub and use the
URL above to go to the specific comment.

To unsubscribe, e-mail: notifications-unsubscribe@skywalking.apache.org

For queries about this service, please contact Infrastructure at:
users@infra.apache.org
[GitHub] [skywalking] wu-sheng commented on pull request #10690: Support Elasticsearch monitoring
Posted by "wu-sheng (via GitHub)" <gi...@apache.org>.
wu-sheng commented on PR #10690:
URL: https://github.com/apache/skywalking/pull/10690#issuecomment-1516045214

   Let's bring this into showcase. @innerpeacez


--
This is an automated message from the Apache Git Service.
To respond to the message, please log on to GitHub and use the
URL above to go to the specific comment.

To unsubscribe, e-mail: notifications-unsubscribe@skywalking.apache.org

For queries about this service, please contact Infrastructure at:
users@infra.apache.org
[GitHub] [skywalking] pg-yang commented on a diff in pull request #10690: Support Elasticsearch monitoring
Posted by "pg-yang (via GitHub)" <gi...@apache.org>.
pg-yang commented on code in PR #10690:
URL: https://github.com/apache/skywalking/pull/10690#discussion_r1167387572
##########
oap-server/server-starter/src/main/resources/otel-rules/elasticsearch/elasticsearch-index.yaml:
##########
@@ -0,0 +1,127 @@
+# Licensed to the Apache Software Foundation (ASF) under one or more
+# contributor license agreements. See the NOTICE file distributed with
+# this work for additional information regarding copyright ownership.
+# The ASF licenses this file to You under the Apache License, Version 2.0
+# (the "License"); you may not use this file except in compliance with
+# the License. You may obtain a copy of the License at
+#
+# http://www.apache.org/licenses/LICENSE-2.0
+#
+# Unless required by applicable law or agreed to in writing, software
+# distributed under the License is distributed on an "AS IS" BASIS,
+# WITHOUT WARRANTIES OR CONDITIONS OF ANY KIND, either express or implied.
+# See the License for the specific language governing permissions and
+# limitations under the License.
+
+# This will parse a textual representation of a duration. The formats
+# accepted are based on the ISO-8601 duration format {@code PnDTnHnMn.nS}
+# with days considered to be exactly 24 hours.
+# <p>
+# Examples:
+# <pre>
+# "PT20.345S" -- parses as "20.345 seconds"
+# "PT15M" -- parses as "15 minutes" (where a minute is 60 seconds)
+# "PT10H" -- parses as "10 hours" (where an hour is 3600 seconds)
+# "P2D" -- parses as "2 days" (where a day is 24 hours or 86400 seconds)
+# "P2DT3H4M" -- parses as "2 days, 3 hours and 4 minutes"
+# "P-6H3M" -- parses as "-6 hours and +3 minutes"
+# "-P6H3M" -- parses as "-6 hours and -3 minutes"
+# "-P-6H+3M" -- parses as "+6 hours and -3 minutes"
+# </pre>
+filter: "{ tags -> tags.job_name == 'elasticsearch-monitoring' }" # The OpenTelemetry job name
+expSuffix: tag({tags -> tags.cluster = 'elasticsearch::' + tags.cluster}).endpoint(['cluster'], ['index'], Layer.ELASTICSEARCH)
+metricPrefix: meter_elasticsearch_index
+metricsRules:
+ - name: stats_indexing_index_total_req_rate
+ exp: elasticsearch_index_stats_indexing_index_total.sum(['cluster' , 'index']).rate('PT1M')
Review Comment:
Hello, From elasticsearch_exporter doc, I couldn't find metrics which has `elasticsearch_index` prefix.
Is it a typo?
##########
oap-server/server-starter/src/main/resources/ui-initialized-templates/elasticsearch/elasticsearch-index.json:
##########
@@ -0,0 +1,674 @@
+/**
+ * Licensed to the Apache Software Foundation (ASF) under one or more
+ * contributor license agreements. See the NOTICE file distributed with
+ * this work for additional information regarding copyright ownership.
+ * The ASF licenses this file to You under the Apache License, Version 2.0
+ * (the "License"); you may not use this file except in compliance with
+ * the License. You may obtain a copy of the License at
+ *
+ * http://www.apache.org/licenses/LICENSE-2.0
+ *
+ * Unless required by applicable law or agreed to in writing, software
+ * distributed under the License is distributed on an "AS IS" BASIS,
+ * WITHOUT WARRANTIES OR CONDITIONS OF ANY KIND, either express or implied.
+ * See the License for the specific language governing permissions and
+ * limitations under the License.
+ */
+[
+ {
+ "id": "Elasticsearch-Index",
+ "configuration": {
+ "children":[
+ {
+ "x":0,
+ "y":6,
+ "w":12,
+ "h":13,
+ "i":"0",
+ "type":"Widget",
+ "id":"0",
+ "metricTypes":[
+ "readMetricsValues",
+ "readMetricsValues"
+ ],
+ "metrics":[
+ "meter_elasticsearch_index_stats_indexing_index_total_req_rate",
+ "meter_elasticsearch_index_stats_indexing_index_total_proc_rate"
+ ],
+ "moved":false,
+ "graph":{
+ "type":"Line",
+ "step":false,
+ "smooth":false,
+ "showSymbol":false,
+ "showXAxis":true,
+ "showYAxis":true
+ },
+ "widget":{
+ "title":"Indexing rate"
+ }
+ },
+ {
+ "x":12,
+ "y":6,
+ "w":12,
+ "h":13,
+ "i":"1",
+ "type":"Widget",
+ "id":"1",
+ "metricTypes":[
+ "readMetricsValues",
+ "readMetricsValues"
+ ],
+ "metrics":[
+ "meter_elasticsearch_index_stats_search_query_total_req_rate",
+ "meter_elasticsearch_index_stats_search_query_total_proc_rate"
+ ],
+ "moved":false,
+ "graph":{
+ "type":"Line",
+ "step":false,
+ "smooth":false,
+ "showSymbol":false,
+ "showXAxis":true,
+ "showYAxis":true
+ },
+ "widget":{
+ "title":"Searching rate"
+ }
+ },
+ {
+ "x":0,
+ "y":19,
+ "w":12,
+ "h":16,
+ "i":"2",
+ "type":"Widget",
+ "id":"2",
+ "metricTypes":[
+ "readMetricsValues",
+ "readMetricsValues",
+ "readMetricsValues",
+ "readMetricsValues",
+ "readMetricsValues",
+ "readMetricsValues",
+ "readMetricsValues",
+ "readMetricsValues",
+ "readMetricsValues",
+ "readMetricsValues",
+ "readMetricsValues"
+ ],
+ "metrics":[
+ "meter_elasticsearch_index_stats_merge_total_req_rate",
+ "meter_elasticsearch_index_stats_flush_total_req_rate",
+ "meter_elasticsearch_index_stats_refresh_total_req_rate",
+ "meter_elasticsearch_index_stats_warmer_total_req_rate",
+ "meter_elasticsearch_index_stats_indexing_delete_total_req_rate",
+ "meter_elasticsearch_index_stats_search_fetch_total_req_rate",
+ "meter_elasticsearch_index_stats_search_query_total_req_rate",
+ "meter_elasticsearch_index_stats_search_scroll_total_req_rate",
+ "meter_elasticsearch_index_stats_search_suggest_total_req_rate",
+ "meter_elasticsearch_index_stats_indexing_index_total_req_rate",
+ "meter_elasticsearch_index_stats_get_total_req_rate"
+ ],
+ "moved":false,
+ "graph":{
+ "type":"Line",
+ "step":false,
+ "smooth":false,
+ "showSymbol":false,
+ "showXAxis":true,
+ "showYAxis":true
+ },
+ "widget":{
+ "title":"All Operations ReqRate"
+ }
+ },
+ {
+ "x":12,
+ "y":19,
+ "w":12,
+ "h":16,
+ "i":"3",
+ "type":"Widget",
+ "id":"3",
+ "metricTypes":[
+ "readMetricsValues",
+ "readMetricsValues",
+ "readMetricsValues",
+ "readMetricsValues",
+ "readMetricsValues",
+ "readMetricsValues",
+ "readMetricsValues",
+ "readMetricsValues",
+ "readMetricsValues",
+ "readMetricsValues",
+ "readMetricsValues",
+ "readMetricsValues",
+ "readMetricsValues",
+ "readMetricsValues"
+ ],
+ "metrics":[
+ "meter_elasticsearch_index_stats_merge_time_seconds_total",
+ "meter_elasticsearch_index_stats_flush_time_seconds_total",
+ "meter_elasticsearch_index_stats_refresh_time_seconds_total",
+ "meter_elasticsearch_index_stats_warmer_time_seconds_total",
+ "meter_elasticsearch_index_stats_indexing_delete_time_seconds_total",
+ "meter_elasticsearch_index_stats_search_fetch_time_seconds_total",
+ "meter_elasticsearch_index_stats_search_query_time_seconds_total",
+ "meter_elasticsearch_index_stats_search_scroll_time_seconds_total",
+ "meter_elasticsearch_index_stats_search_suggest_time_seconds_total",
+ "meter_elasticsearch_index_stats_indexing_index_time_seconds_total",
+ "meter_elasticsearch_index_stats_get_time_seconds_total",
+ "meter_elasticsearch_index_stats_merge_stopped_time_seconds_total",
+ "meter_elasticsearch_index_stats_merge_throttle_time_seconds_total",
+ "meter_elasticsearch_index_stats_indexing_throttle_time_seconds_total"
+ ],
+ "moved":false,
+ "graph":{
+ "type":"Line",
+ "step":false,
+ "smooth":false,
+ "showSymbol":false,
+ "showXAxis":true,
+ "showYAxis":true
+ },
+ "widget":{
+ "title":"All Operations Runtime/s"
+ }
+ },
+ {
+ "x":0,
+ "y":35,
+ "w":8,
+ "h":13,
+ "i":"4",
+ "type":"Widget",
+ "id":"4",
+ "metricTypes":[
+ "readMetricsValues",
+ "readMetricsValues",
+ "readMetricsValues",
+ "readMetricsValues"
+ ],
+ "metrics":[
+ "meter_elasticsearch_index_search_fetch_avg_time",
+ "meter_elasticsearch_index_search_query_avg_time",
+ "meter_elasticsearch_index_search_scroll_avg_time",
+ "meter_elasticsearch_index_search_suggest_avg_time"
+ ],
+ "moved":false,
+ "graph":{
+ "type":"Line",
+ "step":false,
+ "smooth":false,
+ "showSymbol":false,
+ "showXAxis":true,
+ "showYAxis":true
+ },
+ "widget":{
+ "title":"Avg. Search Time Execute / Request (s)"
+ }
+ },
+ {
+ "x":8,
+ "y":35,
+ "w":8,
+ "h":13,
+ "i":"5",
+ "type":"Widget",
+ "id":"5",
+ "metricTypes":[
+ "readMetricsValues",
+ "readMetricsValues",
+ "readMetricsValues",
+ "readMetricsValues"
+ ],
+ "metrics":[
+ "meter_elasticsearch_index_stats_search_fetch_total_req_rate",
+ "meter_elasticsearch_index_stats_search_query_total_req_rate",
+ "meter_elasticsearch_index_stats_search_scroll_total_req_rate",
+ "meter_elasticsearch_index_stats_search_suggest_total_req_rate"
+ ],
+ "moved":false,
+ "graph":{
+ "type":"Line",
+ "step":false,
+ "smooth":false,
+ "showSymbol":false,
+ "showXAxis":true,
+ "showYAxis":true
+ },
+ "metricConfig":[
+
+ ],
+ "widget":{
+ "title":"Search Operations Rate (req/s)"
Review Comment:
There are two spaces between Operations and Rate 😉
##########
oap-server/server-starter/src/main/resources/ui-initialized-templates/elasticsearch/elasticsearch-cluster.json:
##########
@@ -0,0 +1,454 @@
+/**
+ * Licensed to the Apache Software Foundation (ASF) under one or more
+ * contributor license agreements. See the NOTICE file distributed with
+ * this work for additional information regarding copyright ownership.
+ * The ASF licenses this file to You under the Apache License, Version 2.0
+ * (the "License"); you may not use this file except in compliance with
+ * the License. You may obtain a copy of the License at
+ *
+ * http://www.apache.org/licenses/LICENSE-2.0
+ *
+ * Unless required by applicable law or agreed to in writing, software
+ * distributed under the License is distributed on an "AS IS" BASIS,
+ * WITHOUT WARRANTIES OR CONDITIONS OF ANY KIND, either express or implied.
+ * See the License for the specific language governing permissions and
+ * limitations under the License.
+ */
+[
+ {
+ "id": "Elasticsearch-Cluster",
+ "configuration": {
+ "children":[
+ {
+ "x":0,
+ "y":0,
+ "w":24,
+ "h":56,
+ "i":"0",
+ "type":"Tab",
+ "id":"0",
+ "metricTypes":[
+ ""
+ ],
+ "metrics":[
+ ""
+ ],
+ "activedTabIndex":0,
+ "children":[
+ {
+ "name":"Overview",
+ "children":[
+ {
+ "x":0,
+ "y":0,
+ "w":3,
+ "h":6,
+ "i":"0",
+ "type":"Widget",
+ "id":"0-0-0",
+ "metricTypes":[
+ "readLabeledMetricsValues"
+ ],
+ "metrics":[
+ "meter_elasticsearch_cluster_health_status"
+ ],
+ "moved":false,
+ "graph":{
+ "type":"Table",
+ "showTableValues":false,
+ "tableHeaderCol1":"status",
+ "tableHeaderCol2":""
+ },
+ "widget":{
+ "title":"Cluster health"
+ }
+ },
+ {
+ "x":15,
+ "y":0,
+ "w":3,
+ "h":6,
+ "i":"1",
+ "type":"Widget",
+ "id":"0-0-1",
+ "metricTypes":[
+ "readMetricsValue"
+ ],
+ "metrics":[
+ "meter_elasticsearch_cluster_nodes"
+ ],
+ "moved":false,
+ "graph":{
+ "type":"Card",
+ "fontSize":14,
+ "textAlign":"center",
+ "showUnit":true
+ },
+ "widget":{
+ "title":"Data nodes"
+ }
+ },
+ {
+ "x":12,
+ "y":0,
+ "w":3,
+ "h":6,
+ "i":"2",
+ "type":"Widget",
+ "id":"0-0-2",
+ "metricTypes":[
+ "readMetricsValue"
+ ],
+ "metrics":[
+ "meter_elasticsearch_cluster_nodes"
+ ],
+ "moved":false,
+ "graph":{
+ "type":"Card",
+ "fontSize":14,
+ "textAlign":"center",
+ "showUnit":true
+ },
+ "widget":{
+ "title":"Nodes"
+ }
+ },
+ {
+ "x":18,
+ "y":0,
+ "w":3,
+ "h":6,
+ "i":"3",
+ "type":"Widget",
+ "id":"0-0-3",
+ "metricTypes":[
+ "readMetricsValue"
+ ],
+ "metrics":[
+ "meter_elasticsearch_cluster_pending_tasks_total"
+ ],
+ "moved":false,
+ "graph":{
+ "type":"Card",
+ "fontSize":14,
+ "textAlign":"center",
+ "showUnit":true
+ },
+ "widget":{
+ "title":"Pending tasks"
+ }
+ },
+ {
+ "x":0,
+ "y":6,
+ "w":4,
+ "h":5,
+ "i":"4",
+ "type":"Widget",
+ "id":"0-0-4",
+ "metricTypes":[
+ "readMetricsValue"
+ ],
+ "metrics":[
+ "meter_elasticsearch_cluster_primary_shards_total"
+ ],
+ "moved":false,
+ "graph":{
+ "type":"Card",
+ "fontSize":14,
+ "textAlign":"center",
+ "showUnit":false
+ },
+ "widget":{
+ "title":"Active primary shards"
+ }
+ },
+ {
+ "x":4,
+ "y":6,
+ "w":4,
+ "h":5,
+ "i":"5",
+ "type":"Widget",
+ "id":"0-0-5",
+ "metricTypes":[
+ "readMetricsValue"
+ ],
+ "metrics":[
+ "meter_elasticsearch_cluster_shards_total"
+ ],
+ "moved":false,
+ "graph":{
+ "type":"Card",
+ "fontSize":14,
+ "textAlign":"center",
+ "showUnit":false
+ },
+ "widget":{
+ "title":"Active shards"
+ }
+ },
+ {
+ "x":8,
+ "y":6,
+ "w":4,
+ "h":5,
+ "i":"6",
+ "type":"Widget",
+ "id":"0-0-6",
+ "metricTypes":[
+ "readMetricsValue"
+ ],
+ "metrics":[
+ "meter_elasticsearch_cluster_initializing_shards_total"
+ ],
+ "moved":false,
+ "graph":{
+ "type":"Card",
+ "fontSize":14,
+ "textAlign":"center",
+ "showUnit":false
+ },
+ "widget":{
+ "title":"Initializing shards"
+ }
+ },
+ {
+ "x":16,
+ "y":6,
+ "w":4,
+ "h":5,
+ "i":"7",
+ "type":"Widget",
+ "id":"0-0-7",
+ "metricTypes":[
+ "readMetricsValue"
+ ],
+ "metrics":[
+ "meter_elasticsearch_cluster_delayed_unassigned_shards_total"
+ ],
+ "moved":false,
+ "graph":{
+ "type":"Card",
+ "fontSize":14,
+ "textAlign":"center",
+ "showUnit":false
+ },
+ "widget":{
+ "title":"Delayed unassigned shards"
+ }
+ },
+ {
+ "x":20,
+ "y":6,
+ "w":4,
+ "h":5,
+ "i":"8",
+ "type":"Widget",
+ "id":"0-0-8",
+ "metricTypes":[
+ "readMetricsValue"
+ ],
+ "metrics":[
+ "meter_elasticsearch_cluster_relocating_shards_total"
+ ],
+ "moved":false,
+ "graph":{
+ "type":"Card",
+ "fontSize":14,
+ "textAlign":"center",
+ "showUnit":false
+ },
+ "widget":{
+ "title":"Relocating shards"
+ }
+ },
+ {
+ "x":12,
+ "y":6,
+ "w":4,
+ "h":5,
+ "i":"9",
+ "type":"Widget",
+ "id":"0-0-9",
+ "metricTypes":[
+ "readMetricsValue"
+ ],
+ "metrics":[
+ "meter_elasticsearch_cluster_unassigned_shards_total"
+ ],
+ "moved":false,
+ "graph":{
+ "type":"Card",
+ "fontSize":14,
+ "textAlign":"center",
+ "showUnit":false
+ },
+ "widget":{
+ "title":"Unassigned shards"
+ }
+ },
+ {
+ "x":3,
+ "y":0,
+ "w":3,
+ "h":6,
+ "i":"12",
+ "type":"Widget",
+ "id":"0-0-12",
+ "metricTypes":[
+ "readMetricsValues"
+ ],
+ "metrics":[
+ "meter_elasticsearch_cluster_breakers_tripped"
+ ],
+ "moved":false,
+ "graph":{
+ "type":"Card",
+ "fontSize":14,
+ "textAlign":"center",
+ "showUnit":true
+ },
+ "widget":{
+ "title":"Tripped of breakers"
+ }
+ },
+ {
+ "x":6,
+ "y":0,
+ "w":3,
+ "h":6,
+ "i":"13",
+ "type":"Widget",
+ "id":"0-0-13",
+ "metricTypes":[
+ "readMetricsValue"
+ ],
+ "metrics":[
+ "meter_elasticsearch_cluster_cpu_usage_avg"
+ ],
+ "moved":false,
+ "graph":{
+ "type":"Card",
+ "fontSize":14,
+ "textAlign":"center",
+ "showUnit":true
+ },
+ "widget":{
+ "title":"CPU usage Avg (%)"
+ }
+ },
+ {
+ "x":9,
+ "y":0,
+ "w":3,
+ "h":6,
+ "i":"14",
+ "type":"Widget",
+ "id":"0-0-14",
+ "metricTypes":[
+ "readMetricsValue"
+ ],
+ "metrics":[
+ "meter_elasticsearch_cluster_jvm_memory_used_avg"
+ ],
+ "moved":false,
+ "graph":{
+ "type":"Card",
+ "fontSize":14,
+ "textAlign":"center",
+ "showUnit":true
+ },
+ "widget":{
+ "title":"JVM memory used Avg (%)"
+ }
+ },
+ {
+ "x":21,
+ "y":0,
+ "w":3,
+ "h":6,
+ "i":"15",
+ "type":"Widget",
+ "id":"0-0-15",
+ "metricTypes":[
+ "readMetricsValue"
+ ],
+ "metrics":[
+ "meter_elasticsearch_cluster_open_file_descriptors"
Review Comment:
Maybe is a typo too? It should be `meter_elasticsearch_cluster_open_file_count`?
##########
oap-server/server-starter/src/main/resources/ui-initialized-templates/elasticsearch/elasticsearch-cluster.json:
##########
@@ -0,0 +1,454 @@
+/**
+ * Licensed to the Apache Software Foundation (ASF) under one or more
+ * contributor license agreements. See the NOTICE file distributed with
+ * this work for additional information regarding copyright ownership.
+ * The ASF licenses this file to You under the Apache License, Version 2.0
+ * (the "License"); you may not use this file except in compliance with
+ * the License. You may obtain a copy of the License at
+ *
+ * http://www.apache.org/licenses/LICENSE-2.0
+ *
+ * Unless required by applicable law or agreed to in writing, software
+ * distributed under the License is distributed on an "AS IS" BASIS,
+ * WITHOUT WARRANTIES OR CONDITIONS OF ANY KIND, either express or implied.
+ * See the License for the specific language governing permissions and
+ * limitations under the License.
+ */
+[
+ {
+ "id": "Elasticsearch-Cluster",
+ "configuration": {
+ "children":[
+ {
+ "x":0,
+ "y":0,
+ "w":24,
+ "h":56,
+ "i":"0",
+ "type":"Tab",
+ "id":"0",
+ "metricTypes":[
+ ""
+ ],
+ "metrics":[
+ ""
+ ],
+ "activedTabIndex":0,
+ "children":[
+ {
+ "name":"Overview",
+ "children":[
+ {
+ "x":0,
+ "y":0,
+ "w":3,
+ "h":6,
+ "i":"0",
+ "type":"Widget",
+ "id":"0-0-0",
+ "metricTypes":[
+ "readLabeledMetricsValues"
+ ],
+ "metrics":[
+ "meter_elasticsearch_cluster_health_status"
+ ],
+ "moved":false,
+ "graph":{
+ "type":"Table",
+ "showTableValues":false,
+ "tableHeaderCol1":"status",
+ "tableHeaderCol2":""
+ },
+ "widget":{
+ "title":"Cluster health"
+ }
+ },
+ {
+ "x":15,
+ "y":0,
+ "w":3,
+ "h":6,
+ "i":"1",
+ "type":"Widget",
+ "id":"0-0-1",
+ "metricTypes":[
+ "readMetricsValue"
+ ],
+ "metrics":[
+ "meter_elasticsearch_cluster_nodes"
+ ],
+ "moved":false,
+ "graph":{
+ "type":"Card",
+ "fontSize":14,
+ "textAlign":"center",
+ "showUnit":true
+ },
+ "widget":{
+ "title":"Data nodes"
+ }
+ },
+ {
+ "x":12,
+ "y":0,
+ "w":3,
+ "h":6,
+ "i":"2",
+ "type":"Widget",
+ "id":"0-0-2",
+ "metricTypes":[
+ "readMetricsValue"
+ ],
+ "metrics":[
+ "meter_elasticsearch_cluster_nodes"
+ ],
+ "moved":false,
+ "graph":{
+ "type":"Card",
+ "fontSize":14,
+ "textAlign":"center",
+ "showUnit":true
+ },
+ "widget":{
+ "title":"Nodes"
+ }
+ },
+ {
+ "x":18,
+ "y":0,
+ "w":3,
+ "h":6,
+ "i":"3",
+ "type":"Widget",
+ "id":"0-0-3",
+ "metricTypes":[
+ "readMetricsValue"
+ ],
+ "metrics":[
+ "meter_elasticsearch_cluster_pending_tasks_total"
+ ],
+ "moved":false,
+ "graph":{
+ "type":"Card",
+ "fontSize":14,
+ "textAlign":"center",
+ "showUnit":true
+ },
+ "widget":{
+ "title":"Pending tasks"
+ }
+ },
+ {
+ "x":0,
+ "y":6,
+ "w":4,
+ "h":5,
+ "i":"4",
+ "type":"Widget",
+ "id":"0-0-4",
+ "metricTypes":[
+ "readMetricsValue"
+ ],
+ "metrics":[
+ "meter_elasticsearch_cluster_primary_shards_total"
+ ],
+ "moved":false,
+ "graph":{
+ "type":"Card",
+ "fontSize":14,
+ "textAlign":"center",
+ "showUnit":false
+ },
+ "widget":{
+ "title":"Active primary shards"
+ }
+ },
+ {
+ "x":4,
+ "y":6,
+ "w":4,
+ "h":5,
+ "i":"5",
+ "type":"Widget",
+ "id":"0-0-5",
+ "metricTypes":[
+ "readMetricsValue"
+ ],
+ "metrics":[
+ "meter_elasticsearch_cluster_shards_total"
+ ],
+ "moved":false,
+ "graph":{
+ "type":"Card",
+ "fontSize":14,
+ "textAlign":"center",
+ "showUnit":false
+ },
+ "widget":{
+ "title":"Active shards"
+ }
+ },
+ {
+ "x":8,
+ "y":6,
+ "w":4,
+ "h":5,
+ "i":"6",
+ "type":"Widget",
+ "id":"0-0-6",
+ "metricTypes":[
+ "readMetricsValue"
+ ],
+ "metrics":[
+ "meter_elasticsearch_cluster_initializing_shards_total"
+ ],
+ "moved":false,
+ "graph":{
+ "type":"Card",
+ "fontSize":14,
+ "textAlign":"center",
+ "showUnit":false
+ },
+ "widget":{
+ "title":"Initializing shards"
+ }
+ },
+ {
+ "x":16,
+ "y":6,
+ "w":4,
+ "h":5,
+ "i":"7",
+ "type":"Widget",
+ "id":"0-0-7",
+ "metricTypes":[
+ "readMetricsValue"
+ ],
+ "metrics":[
+ "meter_elasticsearch_cluster_delayed_unassigned_shards_total"
+ ],
+ "moved":false,
+ "graph":{
+ "type":"Card",
+ "fontSize":14,
+ "textAlign":"center",
+ "showUnit":false
+ },
+ "widget":{
+ "title":"Delayed unassigned shards"
+ }
+ },
+ {
+ "x":20,
+ "y":6,
+ "w":4,
+ "h":5,
+ "i":"8",
+ "type":"Widget",
+ "id":"0-0-8",
+ "metricTypes":[
+ "readMetricsValue"
+ ],
+ "metrics":[
+ "meter_elasticsearch_cluster_relocating_shards_total"
+ ],
+ "moved":false,
+ "graph":{
+ "type":"Card",
+ "fontSize":14,
+ "textAlign":"center",
+ "showUnit":false
+ },
+ "widget":{
+ "title":"Relocating shards"
+ }
+ },
+ {
+ "x":12,
+ "y":6,
+ "w":4,
+ "h":5,
+ "i":"9",
+ "type":"Widget",
+ "id":"0-0-9",
+ "metricTypes":[
+ "readMetricsValue"
+ ],
+ "metrics":[
+ "meter_elasticsearch_cluster_unassigned_shards_total"
+ ],
+ "moved":false,
+ "graph":{
+ "type":"Card",
+ "fontSize":14,
+ "textAlign":"center",
+ "showUnit":false
+ },
+ "widget":{
+ "title":"Unassigned shards"
+ }
+ },
+ {
+ "x":3,
+ "y":0,
+ "w":3,
+ "h":6,
+ "i":"12",
+ "type":"Widget",
+ "id":"0-0-12",
+ "metricTypes":[
+ "readMetricsValues"
+ ],
+ "metrics":[
+ "meter_elasticsearch_cluster_breakers_tripped"
+ ],
+ "moved":false,
+ "graph":{
+ "type":"Card",
+ "fontSize":14,
+ "textAlign":"center",
+ "showUnit":true
+ },
+ "widget":{
+ "title":"Tripped of breakers"
+ }
+ },
+ {
+ "x":6,
+ "y":0,
+ "w":3,
+ "h":6,
+ "i":"13",
+ "type":"Widget",
+ "id":"0-0-13",
+ "metricTypes":[
+ "readMetricsValue"
+ ],
+ "metrics":[
+ "meter_elasticsearch_cluster_cpu_usage_avg"
+ ],
+ "moved":false,
+ "graph":{
+ "type":"Card",
+ "fontSize":14,
+ "textAlign":"center",
+ "showUnit":true
+ },
+ "widget":{
+ "title":"CPU usage Avg (%)"
+ }
+ },
+ {
+ "x":9,
+ "y":0,
+ "w":3,
+ "h":6,
+ "i":"14",
+ "type":"Widget",
+ "id":"0-0-14",
+ "metricTypes":[
+ "readMetricsValue"
+ ],
+ "metrics":[
+ "meter_elasticsearch_cluster_jvm_memory_used_avg"
+ ],
+ "moved":false,
+ "graph":{
+ "type":"Card",
+ "fontSize":14,
+ "textAlign":"center",
+ "showUnit":true
+ },
+ "widget":{
+ "title":"JVM memory used Avg (%)"
+ }
+ },
+ {
+ "x":21,
+ "y":0,
+ "w":3,
+ "h":6,
+ "i":"15",
+ "type":"Widget",
+ "id":"0-0-15",
+ "metricTypes":[
+ "readMetricsValue"
+ ],
+ "metrics":[
+ "meter_elasticsearch_cluster_open_file_descriptors"
+ ],
+ "moved":false,
+ "graph":{
+ "type":"Card",
+ "fontSize":14,
+ "textAlign":"center",
+ "showUnit":true
+ },
+ "widget":{
+ "title":"Open files descriptors per cluster"
Review Comment:
The title doesn't need to stress `per cluster`, right?
--
This is an automated message from the Apache Git Service.
To respond to the message, please log on to GitHub and use the
URL above to go to the specific comment.
To unsubscribe, e-mail: notifications-unsubscribe@skywalking.apache.org
For queries about this service, please contact Infrastructure at:
users@infra.apache.org
[GitHub] [skywalking] innerpeacez commented on pull request #10690: Support Elasticsearch monitoring
Posted by "innerpeacez (via GitHub)" <gi...@apache.org>.
innerpeacez commented on PR #10690:
URL: https://github.com/apache/skywalking/pull/10690#issuecomment-1508334997

   > Does index dashboard list physical indices rather than template, right?

   yes,list es indices


--
This is an automated message from the Apache Git Service.
To respond to the message, please log on to GitHub and use the
URL above to go to the specific comment.

To unsubscribe, e-mail: notifications-unsubscribe@skywalking.apache.org

For queries about this service, please contact Infrastructure at:
users@infra.apache.org
[GitHub] [skywalking] innerpeacez commented on a diff in pull request #10690: Support Elasticsearch monitoring
Posted by "innerpeacez (via GitHub)" <gi...@apache.org>.
innerpeacez commented on code in PR #10690:
URL: https://github.com/apache/skywalking/pull/10690#discussion_r1167862295
##########
oap-server/server-starter/src/main/resources/ui-initialized-templates/elasticsearch/elasticsearch-cluster.json:
##########
@@ -0,0 +1,454 @@
+/**
+ * Licensed to the Apache Software Foundation (ASF) under one or more
+ * contributor license agreements. See the NOTICE file distributed with
+ * this work for additional information regarding copyright ownership.
+ * The ASF licenses this file to You under the Apache License, Version 2.0
+ * (the "License"); you may not use this file except in compliance with
+ * the License. You may obtain a copy of the License at
+ *
+ * http://www.apache.org/licenses/LICENSE-2.0
+ *
+ * Unless required by applicable law or agreed to in writing, software
+ * distributed under the License is distributed on an "AS IS" BASIS,
+ * WITHOUT WARRANTIES OR CONDITIONS OF ANY KIND, either express or implied.
+ * See the License for the specific language governing permissions and
+ * limitations under the License.
+ */
+[
+ {
+ "id": "Elasticsearch-Cluster",
+ "configuration": {
+ "children":[
+ {
+ "x":0,
+ "y":0,
+ "w":24,
+ "h":56,
+ "i":"0",
+ "type":"Tab",
+ "id":"0",
+ "metricTypes":[
+ ""
+ ],
+ "metrics":[
+ ""
+ ],
+ "activedTabIndex":0,
+ "children":[
+ {
+ "name":"Overview",
+ "children":[
+ {
+ "x":0,
+ "y":0,
+ "w":3,
+ "h":6,
+ "i":"0",
+ "type":"Widget",
+ "id":"0-0-0",
+ "metricTypes":[
+ "readLabeledMetricsValues"
+ ],
+ "metrics":[
+ "meter_elasticsearch_cluster_health_status"
+ ],
+ "moved":false,
+ "graph":{
+ "type":"Table",
+ "showTableValues":false,
+ "tableHeaderCol1":"status",
+ "tableHeaderCol2":""
+ },
+ "widget":{
+ "title":"Cluster health"
+ }
+ },
+ {
+ "x":15,
+ "y":0,
+ "w":3,
+ "h":6,
+ "i":"1",
+ "type":"Widget",
+ "id":"0-0-1",
+ "metricTypes":[
+ "readMetricsValue"
+ ],
+ "metrics":[
+ "meter_elasticsearch_cluster_nodes"
+ ],
+ "moved":false,
+ "graph":{
+ "type":"Card",
+ "fontSize":14,
+ "textAlign":"center",
+ "showUnit":true
+ },
+ "widget":{
+ "title":"Data nodes"
+ }
+ },
+ {
+ "x":12,
+ "y":0,
+ "w":3,
+ "h":6,
+ "i":"2",
+ "type":"Widget",
+ "id":"0-0-2",
+ "metricTypes":[
+ "readMetricsValue"
+ ],
+ "metrics":[
+ "meter_elasticsearch_cluster_nodes"
+ ],
+ "moved":false,
+ "graph":{
+ "type":"Card",
+ "fontSize":14,
+ "textAlign":"center",
+ "showUnit":true
+ },
+ "widget":{
+ "title":"Nodes"
+ }
+ },
+ {
+ "x":18,
+ "y":0,
+ "w":3,
+ "h":6,
+ "i":"3",
+ "type":"Widget",
+ "id":"0-0-3",
+ "metricTypes":[
+ "readMetricsValue"
+ ],
+ "metrics":[
+ "meter_elasticsearch_cluster_pending_tasks_total"
+ ],
+ "moved":false,
+ "graph":{
+ "type":"Card",
+ "fontSize":14,
+ "textAlign":"center",
+ "showUnit":true
+ },
+ "widget":{
+ "title":"Pending tasks"
+ }
+ },
+ {
+ "x":0,
+ "y":6,
+ "w":4,
+ "h":5,
+ "i":"4",
+ "type":"Widget",
+ "id":"0-0-4",
+ "metricTypes":[
+ "readMetricsValue"
+ ],
+ "metrics":[
+ "meter_elasticsearch_cluster_primary_shards_total"
+ ],
+ "moved":false,
+ "graph":{
+ "type":"Card",
+ "fontSize":14,
+ "textAlign":"center",
+ "showUnit":false
+ },
+ "widget":{
+ "title":"Active primary shards"
+ }
+ },
+ {
+ "x":4,
+ "y":6,
+ "w":4,
+ "h":5,
+ "i":"5",
+ "type":"Widget",
+ "id":"0-0-5",
+ "metricTypes":[
+ "readMetricsValue"
+ ],
+ "metrics":[
+ "meter_elasticsearch_cluster_shards_total"
+ ],
+ "moved":false,
+ "graph":{
+ "type":"Card",
+ "fontSize":14,
+ "textAlign":"center",
+ "showUnit":false
+ },
+ "widget":{
+ "title":"Active shards"
+ }
+ },
+ {
+ "x":8,
+ "y":6,
+ "w":4,
+ "h":5,
+ "i":"6",
+ "type":"Widget",
+ "id":"0-0-6",
+ "metricTypes":[
+ "readMetricsValue"
+ ],
+ "metrics":[
+ "meter_elasticsearch_cluster_initializing_shards_total"
+ ],
+ "moved":false,
+ "graph":{
+ "type":"Card",
+ "fontSize":14,
+ "textAlign":"center",
+ "showUnit":false
+ },
+ "widget":{
+ "title":"Initializing shards"
+ }
+ },
+ {
+ "x":16,
+ "y":6,
+ "w":4,
+ "h":5,
+ "i":"7",
+ "type":"Widget",
+ "id":"0-0-7",
+ "metricTypes":[
+ "readMetricsValue"
+ ],
+ "metrics":[
+ "meter_elasticsearch_cluster_delayed_unassigned_shards_total"
+ ],
+ "moved":false,
+ "graph":{
+ "type":"Card",
+ "fontSize":14,
+ "textAlign":"center",
+ "showUnit":false
+ },
+ "widget":{
+ "title":"Delayed unassigned shards"
+ }
+ },
+ {
+ "x":20,
+ "y":6,
+ "w":4,
+ "h":5,
+ "i":"8",
+ "type":"Widget",
+ "id":"0-0-8",
+ "metricTypes":[
+ "readMetricsValue"
+ ],
+ "metrics":[
+ "meter_elasticsearch_cluster_relocating_shards_total"
+ ],
+ "moved":false,
+ "graph":{
+ "type":"Card",
+ "fontSize":14,
+ "textAlign":"center",
+ "showUnit":false
+ },
+ "widget":{
+ "title":"Relocating shards"
+ }
+ },
+ {
+ "x":12,
+ "y":6,
+ "w":4,
+ "h":5,
+ "i":"9",
+ "type":"Widget",
+ "id":"0-0-9",
+ "metricTypes":[
+ "readMetricsValue"
+ ],
+ "metrics":[
+ "meter_elasticsearch_cluster_unassigned_shards_total"
+ ],
+ "moved":false,
+ "graph":{
+ "type":"Card",
+ "fontSize":14,
+ "textAlign":"center",
+ "showUnit":false
+ },
+ "widget":{
+ "title":"Unassigned shards"
+ }
+ },
+ {
+ "x":3,
+ "y":0,
+ "w":3,
+ "h":6,
+ "i":"12",
+ "type":"Widget",
+ "id":"0-0-12",
+ "metricTypes":[
+ "readMetricsValues"
+ ],
+ "metrics":[
+ "meter_elasticsearch_cluster_breakers_tripped"
+ ],
+ "moved":false,
+ "graph":{
+ "type":"Card",
+ "fontSize":14,
+ "textAlign":"center",
+ "showUnit":true
+ },
+ "widget":{
+ "title":"Tripped of breakers"
+ }
+ },
+ {
+ "x":6,
+ "y":0,
+ "w":3,
+ "h":6,
+ "i":"13",
+ "type":"Widget",
+ "id":"0-0-13",
+ "metricTypes":[
+ "readMetricsValue"
+ ],
+ "metrics":[
+ "meter_elasticsearch_cluster_cpu_usage_avg"
+ ],
+ "moved":false,
+ "graph":{
+ "type":"Card",
+ "fontSize":14,
+ "textAlign":"center",
+ "showUnit":true
+ },
+ "widget":{
+ "title":"CPU usage Avg (%)"
+ }
+ },
+ {
+ "x":9,
+ "y":0,
+ "w":3,
+ "h":6,
+ "i":"14",
+ "type":"Widget",
+ "id":"0-0-14",
+ "metricTypes":[
+ "readMetricsValue"
+ ],
+ "metrics":[
+ "meter_elasticsearch_cluster_jvm_memory_used_avg"
+ ],
+ "moved":false,
+ "graph":{
+ "type":"Card",
+ "fontSize":14,
+ "textAlign":"center",
+ "showUnit":true
+ },
+ "widget":{
+ "title":"JVM memory used Avg (%)"
+ }
+ },
+ {
+ "x":21,
+ "y":0,
+ "w":3,
+ "h":6,
+ "i":"15",
+ "type":"Widget",
+ "id":"0-0-15",
+ "metricTypes":[
+ "readMetricsValue"
+ ],
+ "metrics":[
+ "meter_elasticsearch_cluster_open_file_descriptors"
Review Comment:
It seems that I did not save the dashboard after modifying it through the UI.
--
This is an automated message from the Apache Git Service.
To respond to the message, please log on to GitHub and use the
URL above to go to the specific comment.
To unsubscribe, e-mail: notifications-unsubscribe@skywalking.apache.org
For queries about this service, please contact Infrastructure at:
users@infra.apache.org
[GitHub] [skywalking] innerpeacez commented on pull request #10690: Support Elasticsearch monitoring
Posted by "innerpeacez (via GitHub)" <gi...@apache.org>.
innerpeacez commented on PR #10690:
URL: https://github.com/apache/skywalking/pull/10690#issuecomment-1510907908

   I have solved the problem above and updated the screenshot using the latest UI. Please take a look and let me know if there are any other problems.


--
This is an automated message from the Apache Git Service.
To respond to the message, please log on to GitHub and use the
URL above to go to the specific comment.

To unsubscribe, e-mail: notifications-unsubscribe@skywalking.apache.org

For queries about this service, please contact Infrastructure at:
users@infra.apache.org
[GitHub] [skywalking] wankai123 commented on a diff in pull request #10690: Support Elasticsearch monitoring
Posted by "wankai123 (via GitHub)" <gi...@apache.org>.
wankai123 commented on code in PR #10690:
URL: https://github.com/apache/skywalking/pull/10690#discussion_r1169453585


##########
test/e2e-v2/cases/elasticsearch/docker-compose.yml:
##########
@@ -0,0 +1,79 @@
+# Licensed to the Apache Software Foundation (ASF) under one or more
+# contributor license agreements.  See the NOTICE file distributed with
+# this work for additional information regarding copyright ownership.
+# The ASF licenses this file to You under the Apache License, Version 2.0
+# (the "License"); you may not use this file except in compliance with
+# the License.  You may obtain a copy of the License at
+#
+#     http://www.apache.org/licenses/LICENSE-2.0
+#
+# Unless required by applicable law or agreed to in writing, software
+# distributed under the License is distributed on an "AS IS" BASIS,
+# WITHOUT WARRANTIES OR CONDITIONS OF ANY KIND, either express or implied.
+# See the License for the specific language governing permissions and
+# limitations under the License.
+
+version: '2.1'
+
+services:
+  oap:
+    extends:
+      file: ../../script/docker-compose/base-compose.yml
+      service: oap
+    ports:
+      - 12800
+    networks:
+      - e2e
+  es:
+    image: elastic/elasticsearch:8.3.2
+    expose:
+      - 9200
+    networks:
+      - e2e
+    environment:
+      - discovery.type=single-node
+      - cluster.routing.allocation.disk.threshold_enabled=false
+      - xpack.security.enabled=false
+      - cluster.name=cluster-e2e
+      - node.name=node-e2e
+    healthcheck:
+      test: ["CMD", "bash", "-c", "cat < /dev/null > /dev/tcp/127.0.0.1/9200"]
+      interval: 5s
+      timeout: 60s
+      retries: 120
+  es-exporter:
+    image: quay.io/prometheuscommunity/elasticsearch-exporter:v1.5.0
+    expose:
+      - 9108
+    networks:
+      - e2e
+    environment:
+      - ES_URI=http://es:9200
+    depends_on:
+      - es
+      - oap
+  es-mock:
+    image: curlimages/curl:latest
+    networks:
+      - e2e
+    depends_on:
+      - es
+      - es-exporter
+      - oap
+    command: "sh -c ./es-e2e-data-mock.sh"

Review Comment:
   Could you explain why we need mock data here?


--
This is an automated message from the Apache Git Service.
To respond to the message, please log on to GitHub and use the
URL above to go to the specific comment.

To unsubscribe, e-mail: notifications-unsubscribe@skywalking.apache.org

For queries about this service, please contact Infrastructure at:
users@infra.apache.org
[GitHub] [skywalking] wankai123 commented on a diff in pull request #10690: Support Elasticsearch monitoring
Posted by "wankai123 (via GitHub)" <gi...@apache.org>.
wankai123 commented on code in PR #10690:
URL: https://github.com/apache/skywalking/pull/10690#discussion_r1169449816


##########
docs/en/setup/backend/backend-elasticsearch-monitoring.md:
##########
@@ -0,0 +1,116 @@
+# Elasticsearch monitoring
+
+SkyWalking leverages elasticsearch-exporter for collecting metrics data from Elasticsearch. It leverages OpenTelemetry
+Collector to transfer the metrics to
+[OpenTelemetry receiver](opentelemetry-receiver.md) and into the [Meter System](./../../concepts-and-designs/meter.md).
+
+## Data flow
+
+1. The elasticsearch-exporter collect metrics data from Elasticsearch.
+2. OpenTelemetry Collector fetches metrics from elasticsearch-exporter via Prometheus Receiver and pushes metrics to
+   SkyWalking OAP Server via OpenTelemetry gRPC exporter.
+3. The SkyWalking OAP Server parses the expression with [MAL](../../concepts-and-designs/mal.md) to
+   filter/calculate/aggregate and store the results.
+
+## Setup
+
+1. Setup [elasticsearch-exporter](https://github.com/prometheus-community/elasticsearch_exporter).
+2. Set up [OpenTelemetry Collector ](https://opentelemetry.io/docs/collector/getting-started/#kubernetes). For details
+   on Redis Receiver in OpenTelemetry Collector, refer

Review Comment:
   ```suggestion
   2. Set up [OpenTelemetry Collector ](https://opentelemetry.io/docs/collector/getting-started/#kubernetes). The example for OpenTelemetry Collector configuration, refer
   ```


--
This is an automated message from the Apache Git Service.
To respond to the message, please log on to GitHub and use the
URL above to go to the specific comment.

To unsubscribe, e-mail: notifications-unsubscribe@skywalking.apache.org

For queries about this service, please contact Infrastructure at:
users@infra.apache.org
[GitHub] [skywalking] wu-sheng commented on a diff in pull request #10690: Support Elasticsearch monitoring
Posted by "wu-sheng (via GitHub)" <gi...@apache.org>.
wu-sheng commented on code in PR #10690:
URL: https://github.com/apache/skywalking/pull/10690#discussion_r1168061746


##########
oap-server/server-starter/src/main/resources/ui-initialized-templates/elasticsearch/elasticsearch-index.json:
##########
@@ -0,0 +1,674 @@
+/**
+ * Licensed to the Apache Software Foundation (ASF) under one or more
+ * contributor license agreements.  See the NOTICE file distributed with
+ * this work for additional information regarding copyright ownership.
+ * The ASF licenses this file to You under the Apache License, Version 2.0
+ * (the "License"); you may not use this file except in compliance with
+ * the License.  You may obtain a copy of the License at
+ *
+ *      http://www.apache.org/licenses/LICENSE-2.0
+ *
+ * Unless required by applicable law or agreed to in writing, software
+ * distributed under the License is distributed on an "AS IS" BASIS,
+ * WITHOUT WARRANTIES OR CONDITIONS OF ANY KIND, either express or implied.
+ * See the License for the specific language governing permissions and
+ * limitations under the License.
+ */
+[
+  {
+    "id": "Elasticsearch-Index",
+    "configuration": {
+      "children":[
+        {
+          "x":0,
+          "y":6,
+          "w":12,
+          "h":13,
+          "i":"0",
+          "type":"Widget",
+          "id":"0",
+          "metricTypes":[
+            "readMetricsValues",
+            "readMetricsValues"
+          ],
+          "metrics":[
+            "meter_elasticsearch_index_stats_indexing_index_total_req_rate",
+            "meter_elasticsearch_index_stats_indexing_index_total_proc_rate"
+          ],
+          "moved":false,
+          "graph":{
+            "type":"Line",
+            "step":false,
+            "smooth":false,
+            "showSymbol":false,
+            "showXAxis":true,
+            "showYAxis":true
+          },
+          "widget":{
+            "title":"Indexing rate"
+          }
+        },
+        {
+          "x":12,
+          "y":6,
+          "w":12,
+          "h":13,
+          "i":"1",
+          "type":"Widget",
+          "id":"1",
+          "metricTypes":[
+            "readMetricsValues",
+            "readMetricsValues"
+          ],
+          "metrics":[
+            "meter_elasticsearch_index_stats_search_query_total_req_rate",
+            "meter_elasticsearch_index_stats_search_query_total_proc_rate"
+          ],
+          "moved":false,
+          "graph":{
+            "type":"Line",
+            "step":false,
+            "smooth":false,
+            "showSymbol":false,
+            "showXAxis":true,
+            "showYAxis":true
+          },
+          "widget":{
+            "title":"Searching rate"
+          }
+        },
+        {
+          "x":0,
+          "y":19,
+          "w":12,
+          "h":16,
+          "i":"2",
+          "type":"Widget",
+          "id":"2",
+          "metricTypes":[
+            "readMetricsValues",
+            "readMetricsValues",
+            "readMetricsValues",
+            "readMetricsValues",
+            "readMetricsValues",
+            "readMetricsValues",
+            "readMetricsValues",
+            "readMetricsValues",
+            "readMetricsValues",
+            "readMetricsValues",
+            "readMetricsValues"
+          ],
+          "metrics":[
+            "meter_elasticsearch_index_stats_merge_total_req_rate",
+            "meter_elasticsearch_index_stats_flush_total_req_rate",
+            "meter_elasticsearch_index_stats_refresh_total_req_rate",
+            "meter_elasticsearch_index_stats_warmer_total_req_rate",
+            "meter_elasticsearch_index_stats_indexing_delete_total_req_rate",
+            "meter_elasticsearch_index_stats_search_fetch_total_req_rate",
+            "meter_elasticsearch_index_stats_search_query_total_req_rate",
+            "meter_elasticsearch_index_stats_search_scroll_total_req_rate",
+            "meter_elasticsearch_index_stats_search_suggest_total_req_rate",
+            "meter_elasticsearch_index_stats_indexing_index_total_req_rate",
+            "meter_elasticsearch_index_stats_get_total_req_rate"
+          ],
+          "moved":false,
+          "graph":{
+            "type":"Line",
+            "step":false,
+            "smooth":false,
+            "showSymbol":false,
+            "showXAxis":true,
+            "showYAxis":true
+          },
+          "widget":{
+            "title":"All Operations ReqRate"
+          }
+        },
+        {
+          "x":12,
+          "y":19,
+          "w":12,
+          "h":16,
+          "i":"3",
+          "type":"Widget",
+          "id":"3",
+          "metricTypes":[
+            "readMetricsValues",
+            "readMetricsValues",
+            "readMetricsValues",
+            "readMetricsValues",
+            "readMetricsValues",
+            "readMetricsValues",
+            "readMetricsValues",
+            "readMetricsValues",
+            "readMetricsValues",
+            "readMetricsValues",
+            "readMetricsValues",
+            "readMetricsValues",
+            "readMetricsValues",
+            "readMetricsValues"
+          ],
+          "metrics":[
+            "meter_elasticsearch_index_stats_merge_time_seconds_total",
+            "meter_elasticsearch_index_stats_flush_time_seconds_total",
+            "meter_elasticsearch_index_stats_refresh_time_seconds_total",
+            "meter_elasticsearch_index_stats_warmer_time_seconds_total",
+            "meter_elasticsearch_index_stats_indexing_delete_time_seconds_total",
+            "meter_elasticsearch_index_stats_search_fetch_time_seconds_total",
+            "meter_elasticsearch_index_stats_search_query_time_seconds_total",
+            "meter_elasticsearch_index_stats_search_scroll_time_seconds_total",
+            "meter_elasticsearch_index_stats_search_suggest_time_seconds_total",
+            "meter_elasticsearch_index_stats_indexing_index_time_seconds_total",
+            "meter_elasticsearch_index_stats_get_time_seconds_total",
+            "meter_elasticsearch_index_stats_merge_stopped_time_seconds_total",
+            "meter_elasticsearch_index_stats_merge_throttle_time_seconds_total",
+            "meter_elasticsearch_index_stats_indexing_throttle_time_seconds_total"
+          ],
+          "moved":false,
+          "graph":{
+            "type":"Line",
+            "step":false,
+            "smooth":false,
+            "showSymbol":false,
+            "showXAxis":true,
+            "showYAxis":true
+          },
+          "widget":{
+            "title":"All Operations Runtime/s"
+          }
+        },
+        {
+          "x":0,
+          "y":35,
+          "w":8,
+          "h":13,
+          "i":"4",
+          "type":"Widget",
+          "id":"4",
+          "metricTypes":[
+            "readMetricsValues",
+            "readMetricsValues",
+            "readMetricsValues",
+            "readMetricsValues"
+          ],
+          "metrics":[
+            "meter_elasticsearch_index_search_fetch_avg_time",
+            "meter_elasticsearch_index_search_query_avg_time",
+            "meter_elasticsearch_index_search_scroll_avg_time",
+            "meter_elasticsearch_index_search_suggest_avg_time"
+          ],
+          "moved":false,
+          "graph":{
+            "type":"Line",
+            "step":false,
+            "smooth":false,
+            "showSymbol":false,
+            "showXAxis":true,
+            "showYAxis":true
+          },
+          "widget":{
+            "title":"Avg. Search Time Execute / Request (s)"
+          }
+        },
+        {
+          "x":8,
+          "y":35,
+          "w":8,
+          "h":13,
+          "i":"5",
+          "type":"Widget",
+          "id":"5",
+          "metricTypes":[
+            "readMetricsValues",
+            "readMetricsValues",
+            "readMetricsValues",
+            "readMetricsValues"
+          ],
+          "metrics":[
+            "meter_elasticsearch_index_stats_search_fetch_total_req_rate",
+            "meter_elasticsearch_index_stats_search_query_total_req_rate",
+            "meter_elasticsearch_index_stats_search_scroll_total_req_rate",
+            "meter_elasticsearch_index_stats_search_suggest_total_req_rate"
+          ],
+          "moved":false,
+          "graph":{
+            "type":"Line",
+            "step":false,
+            "smooth":false,
+            "showSymbol":false,
+            "showXAxis":true,
+            "showYAxis":true
+          },
+          "metricConfig":[
+
+          ],
+          "widget":{
+            "title":"Search Operations  Rate (req/s)"
+          }
+        },
+        {
+          "x":16,
+          "y":59,
+          "w":8,
+          "h":11,
+          "i":"6",
+          "type":"Widget",
+          "id":"6",
+          "metricTypes":[
+            "readMetricsValues"
+          ],
+          "metrics":[
+            "meter_elasticsearch_index_indices_store_size_bytes_total"
+          ],
+          "moved":false,
+          "graph":{
+            "type":"Line",
+            "step":false,
+            "smooth":false,
+            "showSymbol":false,
+            "showXAxis":true,
+            "showYAxis":true
+          },
+          "widget":{
+            "title":"Total size of stored index data (All Shards)"
+          },
+          "metricConfig":[
+            {
+              "calculation":"byteToMB"
+            }
+          ]
+        },
+        {
+          "x":0,
+          "y":59,
+          "w":8,
+          "h":11,
+          "i":"7",
+          "type":"Widget",
+          "id":"7",
+          "metricTypes":[
+            "readMetricsValues"
+          ],
+          "metrics":[
+            "meter_elasticsearch_index_indices_docs_total"
+          ],
+          "moved":false,
+          "graph":{
+            "type":"Line",
+            "step":false,
+            "smooth":false,
+            "showSymbol":false,
+            "showXAxis":true,
+            "showYAxis":true
+          },
+          "widget":{
+            "title":"Documents (All Shards)"
+          }
+        },
+        {
+          "x":8,
+          "y":59,
+          "w":8,
+          "h":11,
+          "i":"8",
+          "type":"Widget",
+          "id":"8",
+          "metricTypes":[
+            "readMetricsValues"
+          ],
+          "metrics":[
+            "meter_elasticsearch_index_indices_docs_total_rate"
+          ],
+          "moved":false,
+          "graph":{
+            "type":"Line",
+            "step":false,
+            "smooth":false,
+            "showSymbol":false,
+            "showXAxis":true,
+            "showYAxis":true
+          },
+          "widget":{
+            "title":"Documents Rate (All Shards)"
+          }
+        },
+        {
+          "x":0,
+          "y":48,
+          "w":8,
+          "h":11,
+          "i":"9",
+          "type":"Widget",
+          "id":"9",
+          "metricTypes":[
+            "readMetricsValues"
+          ],
+          "metrics":[
+            "meter_elasticsearch_index_indices_docs_primary"
+          ],
+          "moved":false,
+          "graph":{
+            "type":"Line",
+            "step":false,
+            "smooth":false,
+            "showSymbol":false,
+            "showXAxis":true,
+            "showYAxis":true
+          },
+          "widget":{
+            "title":"Documents (Primary Shards)"
+          }
+        },
+        {
+          "x":8,
+          "y":48,
+          "w":8,
+          "h":11,
+          "i":"10",
+          "type":"Widget",
+          "id":"10",
+          "metricTypes":[
+            "readMetricsValues"
+          ],
+          "metrics":[
+            "meter_elasticsearch_index_indices_docs_primary_rate"
+          ],
+          "moved":false,
+          "graph":{
+            "type":"Line",
+            "step":false,
+            "smooth":false,
+            "showSymbol":false,
+            "showXAxis":true,
+            "showYAxis":true
+          },
+          "widget":{
+            "title":"Documents Rate (Primary Shards)"
+          }
+        },
+        {
+          "x":16,
+          "y":48,
+          "w":8,
+          "h":11,
+          "i":"11",
+          "type":"Widget",
+          "id":"11",
+          "metricTypes":[
+            "readMetricsValues"
+          ],
+          "metrics":[
+            "meter_elasticsearch_index_indices_store_size_bytes_primary"
+          ],
+          "moved":false,
+          "graph":{
+            "type":"Line",
+            "step":false,
+            "smooth":false,
+            "showSymbol":false,
+            "showXAxis":true,
+            "showYAxis":true
+          },
+          "metricConfig":[
+            {
+              "calculation":"byteToMB"
+            }
+          ],
+          "widget":{
+            "title":"Total size of stored index data (Primary Shards) (MB)"
+          }
+        },
+        {
+          "x":0,
+          "y":0,
+          "w":3,
+          "h":6,
+          "i":"12",
+          "type":"Widget",
+          "id":"12",
+          "metricTypes":[
+            "readMetricsValue"
+          ],
+          "metrics":[
+            "meter_elasticsearch_index_indices_docs_primary"
+          ],
+          "moved":false,
+          "graph":{
+            "type":"Card",
+            "fontSize":14,
+            "textAlign":"center",
+            "showUnit":true
+          },
+          "widget":{
+            "title":"Documents Primary"
+          }
+        },
+        {
+          "x":9,
+          "y":0,
+          "w":3,
+          "h":6,
+          "i":"14",
+          "type":"Widget",
+          "id":"14",
+          "metricTypes":[
+            "readMetricsValues"
+          ],
+          "metrics":[
+            "meter_elasticsearch_index_indices_store_size_bytes_total"
+          ],
+          "moved":false,
+          "graph":{
+            "type":"Card",
+            "fontSize":14,
+            "textAlign":"center",
+            "showUnit":true
+          },
+          "metricConfig":[
+            {
+              "calculation":"byteToGB"
+            }
+          ],
+          "widget":{
+            "title":"Data (GB)"
+          }
+        },
+        {
+          "x":6,
+          "y":0,
+          "w":3,
+          "h":6,
+          "i":"15",
+          "type":"Widget",
+          "id":"15",
+          "metricTypes":[
+            "readMetricsValues"
+          ],
+          "metrics":[
+            "meter_elasticsearch_index_indices_store_size_bytes_primary"
+          ],
+          "moved":false,
+          "graph":{
+            "type":"Card",
+            "fontSize":14,
+            "textAlign":"center",
+            "showUnit":true
+          },
+          "metricConfig":[
+            {
+              "calculation":"byteToGB"
+            }
+          ],
+          "widget":{
+            "title":"Data Primary (GB)"

Review Comment:
   ```suggestion
               "title":"Primary Data (GB)"
   ```


--
This is an automated message from the Apache Git Service.
To respond to the message, please log on to GitHub and use the
URL above to go to the specific comment.

To unsubscribe, e-mail: notifications-unsubscribe@skywalking.apache.org

For queries about this service, please contact Infrastructure at:
users@infra.apache.org
[GitHub] [skywalking] wankai123 commented on a diff in pull request #10690: Support Elasticsearch monitoring
Posted by "wankai123 (via GitHub)" <gi...@apache.org>.
wankai123 commented on code in PR #10690:
URL: https://github.com/apache/skywalking/pull/10690#discussion_r1169454509


##########
test/e2e-v2/cases/elasticsearch/docker-compose.yml:
##########
@@ -0,0 +1,79 @@
+# Licensed to the Apache Software Foundation (ASF) under one or more
+# contributor license agreements.  See the NOTICE file distributed with
+# this work for additional information regarding copyright ownership.
+# The ASF licenses this file to You under the Apache License, Version 2.0
+# (the "License"); you may not use this file except in compliance with
+# the License.  You may obtain a copy of the License at
+#
+#     http://www.apache.org/licenses/LICENSE-2.0
+#
+# Unless required by applicable law or agreed to in writing, software
+# distributed under the License is distributed on an "AS IS" BASIS,
+# WITHOUT WARRANTIES OR CONDITIONS OF ANY KIND, either express or implied.
+# See the License for the specific language governing permissions and
+# limitations under the License.
+
+version: '2.1'
+
+services:
+  oap:
+    extends:
+      file: ../../script/docker-compose/base-compose.yml
+      service: oap
+    ports:
+      - 12800
+    networks:
+      - e2e
+  es:
+    image: elastic/elasticsearch:8.3.2
+    expose:
+      - 9200
+    networks:
+      - e2e
+    environment:
+      - discovery.type=single-node
+      - cluster.routing.allocation.disk.threshold_enabled=false
+      - xpack.security.enabled=false
+      - cluster.name=cluster-e2e
+      - node.name=node-e2e
+    healthcheck:
+      test: ["CMD", "bash", "-c", "cat < /dev/null > /dev/tcp/127.0.0.1/9200"]
+      interval: 5s
+      timeout: 60s
+      retries: 120
+  es-exporter:
+    image: quay.io/prometheuscommunity/elasticsearch-exporter:v1.5.0
+    expose:
+      - 9108
+    networks:
+      - e2e
+    environment:
+      - ES_URI=http://es:9200
+    depends_on:
+      - es
+      - oap
+  es-mock:
+    image: curlimages/curl:latest
+    networks:
+      - e2e
+    depends_on:
+      - es
+      - es-exporter
+      - oap
+    command: "sh -c ./es-e2e-data-mock.sh"

Review Comment:
   Ok,  make sense :)


--
This is an automated message from the Apache Git Service.
To respond to the message, please log on to GitHub and use the
URL above to go to the specific comment.

To unsubscribe, e-mail: notifications-unsubscribe@skywalking.apache.org

For queries about this service, please contact Infrastructure at:
users@infra.apache.org
[GitHub] [skywalking] wu-sheng commented on pull request #10690: Support Elasticsearch monitoring
Posted by "wu-sheng (via GitHub)" <gi...@apache.org>.
wu-sheng commented on PR #10690:
URL: https://github.com/apache/skywalking/pull/10690#issuecomment-1508457446

   1. You should keep upper/lower cases consistent. Such as put all first letters of words in upper case.
   2. `/s` should be `(/s)` or `Per Second`

   After the e2e tests added and merged, you should update showcase to add ElasticSearch monitoring too.


--
This is an automated message from the Apache Git Service.
To respond to the message, please log on to GitHub and use the
URL above to go to the specific comment.

To unsubscribe, e-mail: notifications-unsubscribe@skywalking.apache.org

For queries about this service, please contact Infrastructure at:
users@infra.apache.org
[GitHub] [skywalking] wu-sheng commented on pull request #10690: Support Elasticsearch monitoring
Posted by "wu-sheng (via GitHub)" <gi...@apache.org>.
wu-sheng commented on PR #10690:
URL: https://github.com/apache/skywalking/pull/10690#issuecomment-1510921576

   > FYI @Fine0830 With the increment number of metrics dashboards, we should consider supporting `setup legend name` for metric graphs.
   >
   > <img alt="image" width="849" src="https://user-images.githubusercontent.com/5441976/232428540-bd01b239-7452-4ca4-adda-73f457adcb77.png">
   >
   > It should be better than showing the metric name.

   @innerpeacez ☝️ This is an enhancement. We could polish the dashboard later after we have this.


--
This is an automated message from the Apache Git Service.
To respond to the message, please log on to GitHub and use the
URL above to go to the specific comment.

To unsubscribe, e-mail: notifications-unsubscribe@skywalking.apache.org

For queries about this service, please contact Infrastructure at:
users@infra.apache.org
[GitHub] [skywalking] innerpeacez commented on a diff in pull request #10690: Support Elasticsearch monitoring
Posted by "innerpeacez (via GitHub)" <gi...@apache.org>.
innerpeacez commented on code in PR #10690:
URL: https://github.com/apache/skywalking/pull/10690#discussion_r1167866949
##########
oap-server/server-starter/src/main/resources/ui-initialized-templates/elasticsearch/elasticsearch-cluster.json:
##########
@@ -0,0 +1,454 @@
+/**
+ * Licensed to the Apache Software Foundation (ASF) under one or more
+ * contributor license agreements. See the NOTICE file distributed with
+ * this work for additional information regarding copyright ownership.
+ * The ASF licenses this file to You under the Apache License, Version 2.0
+ * (the "License"); you may not use this file except in compliance with
+ * the License. You may obtain a copy of the License at
+ *
+ * http://www.apache.org/licenses/LICENSE-2.0
+ *
+ * Unless required by applicable law or agreed to in writing, software
+ * distributed under the License is distributed on an "AS IS" BASIS,
+ * WITHOUT WARRANTIES OR CONDITIONS OF ANY KIND, either express or implied.
+ * See the License for the specific language governing permissions and
+ * limitations under the License.
+ */
+[
+ {
+ "id": "Elasticsearch-Cluster",
+ "configuration": {
+ "children":[
+ {
+ "x":0,
+ "y":0,
+ "w":24,
+ "h":56,
+ "i":"0",
+ "type":"Tab",
+ "id":"0",
+ "metricTypes":[
+ ""
+ ],
+ "metrics":[
+ ""
+ ],
+ "activedTabIndex":0,
+ "children":[
+ {
+ "name":"Overview",
+ "children":[
+ {
+ "x":0,
+ "y":0,
+ "w":3,
+ "h":6,
+ "i":"0",
+ "type":"Widget",
+ "id":"0-0-0",
+ "metricTypes":[
+ "readLabeledMetricsValues"
+ ],
+ "metrics":[
+ "meter_elasticsearch_cluster_health_status"
+ ],
+ "moved":false,
+ "graph":{
+ "type":"Table",
+ "showTableValues":false,
+ "tableHeaderCol1":"status",
+ "tableHeaderCol2":""
+ },
+ "widget":{
+ "title":"Cluster health"
+ }
+ },
+ {
+ "x":15,
+ "y":0,
+ "w":3,
+ "h":6,
+ "i":"1",
+ "type":"Widget",
+ "id":"0-0-1",
+ "metricTypes":[
+ "readMetricsValue"
+ ],
+ "metrics":[
+ "meter_elasticsearch_cluster_nodes"
+ ],
+ "moved":false,
+ "graph":{
+ "type":"Card",
+ "fontSize":14,
+ "textAlign":"center",
+ "showUnit":true
+ },
+ "widget":{
+ "title":"Data nodes"
+ }
+ },
+ {
+ "x":12,
+ "y":0,
+ "w":3,
+ "h":6,
+ "i":"2",
+ "type":"Widget",
+ "id":"0-0-2",
+ "metricTypes":[
+ "readMetricsValue"
+ ],
+ "metrics":[
+ "meter_elasticsearch_cluster_nodes"
+ ],
+ "moved":false,
+ "graph":{
+ "type":"Card",
+ "fontSize":14,
+ "textAlign":"center",
+ "showUnit":true
+ },
+ "widget":{
+ "title":"Nodes"
+ }
+ },
+ {
+ "x":18,
+ "y":0,
+ "w":3,
+ "h":6,
+ "i":"3",
+ "type":"Widget",
+ "id":"0-0-3",
+ "metricTypes":[
+ "readMetricsValue"
+ ],
+ "metrics":[
+ "meter_elasticsearch_cluster_pending_tasks_total"
+ ],
+ "moved":false,
+ "graph":{
+ "type":"Card",
+ "fontSize":14,
+ "textAlign":"center",
+ "showUnit":true
+ },
+ "widget":{
+ "title":"Pending tasks"
+ }
+ },
+ {
+ "x":0,
+ "y":6,
+ "w":4,
+ "h":5,
+ "i":"4",
+ "type":"Widget",
+ "id":"0-0-4",
+ "metricTypes":[
+ "readMetricsValue"
+ ],
+ "metrics":[
+ "meter_elasticsearch_cluster_primary_shards_total"
+ ],
+ "moved":false,
+ "graph":{
+ "type":"Card",
+ "fontSize":14,
+ "textAlign":"center",
+ "showUnit":false
+ },
+ "widget":{
+ "title":"Active primary shards"
+ }
+ },
+ {
+ "x":4,
+ "y":6,
+ "w":4,
+ "h":5,
+ "i":"5",
+ "type":"Widget",
+ "id":"0-0-5",
+ "metricTypes":[
+ "readMetricsValue"
+ ],
+ "metrics":[
+ "meter_elasticsearch_cluster_shards_total"
+ ],
+ "moved":false,
+ "graph":{
+ "type":"Card",
+ "fontSize":14,
+ "textAlign":"center",
+ "showUnit":false
+ },
+ "widget":{
+ "title":"Active shards"
+ }
+ },
+ {
+ "x":8,
+ "y":6,
+ "w":4,
+ "h":5,
+ "i":"6",
+ "type":"Widget",
+ "id":"0-0-6",
+ "metricTypes":[
+ "readMetricsValue"
+ ],
+ "metrics":[
+ "meter_elasticsearch_cluster_initializing_shards_total"
+ ],
+ "moved":false,
+ "graph":{
+ "type":"Card",
+ "fontSize":14,
+ "textAlign":"center",
+ "showUnit":false
+ },
+ "widget":{
+ "title":"Initializing shards"
+ }
+ },
+ {
+ "x":16,
+ "y":6,
+ "w":4,
+ "h":5,
+ "i":"7",
+ "type":"Widget",
+ "id":"0-0-7",
+ "metricTypes":[
+ "readMetricsValue"
+ ],
+ "metrics":[
+ "meter_elasticsearch_cluster_delayed_unassigned_shards_total"
+ ],
+ "moved":false,
+ "graph":{
+ "type":"Card",
+ "fontSize":14,
+ "textAlign":"center",
+ "showUnit":false
+ },
+ "widget":{
+ "title":"Delayed unassigned shards"
+ }
+ },
+ {
+ "x":20,
+ "y":6,
+ "w":4,
+ "h":5,
+ "i":"8",
+ "type":"Widget",
+ "id":"0-0-8",
+ "metricTypes":[
+ "readMetricsValue"
+ ],
+ "metrics":[
+ "meter_elasticsearch_cluster_relocating_shards_total"
+ ],
+ "moved":false,
+ "graph":{
+ "type":"Card",
+ "fontSize":14,
+ "textAlign":"center",
+ "showUnit":false
+ },
+ "widget":{
+ "title":"Relocating shards"
+ }
+ },
+ {
+ "x":12,
+ "y":6,
+ "w":4,
+ "h":5,
+ "i":"9",
+ "type":"Widget",
+ "id":"0-0-9",
+ "metricTypes":[
+ "readMetricsValue"
+ ],
+ "metrics":[
+ "meter_elasticsearch_cluster_unassigned_shards_total"
+ ],
+ "moved":false,
+ "graph":{
+ "type":"Card",
+ "fontSize":14,
+ "textAlign":"center",
+ "showUnit":false
+ },
+ "widget":{
+ "title":"Unassigned shards"
+ }
+ },
+ {
+ "x":3,
+ "y":0,
+ "w":3,
+ "h":6,
+ "i":"12",
+ "type":"Widget",
+ "id":"0-0-12",
+ "metricTypes":[
+ "readMetricsValues"
+ ],
+ "metrics":[
+ "meter_elasticsearch_cluster_breakers_tripped"
+ ],
+ "moved":false,
+ "graph":{
+ "type":"Card",
+ "fontSize":14,
+ "textAlign":"center",
+ "showUnit":true
+ },
+ "widget":{
+ "title":"Tripped of breakers"
+ }
+ },
+ {
+ "x":6,
+ "y":0,
+ "w":3,
+ "h":6,
+ "i":"13",
+ "type":"Widget",
+ "id":"0-0-13",
+ "metricTypes":[
+ "readMetricsValue"
+ ],
+ "metrics":[
+ "meter_elasticsearch_cluster_cpu_usage_avg"
+ ],
+ "moved":false,
+ "graph":{
+ "type":"Card",
+ "fontSize":14,
+ "textAlign":"center",
+ "showUnit":true
+ },
+ "widget":{
+ "title":"CPU usage Avg (%)"
+ }
+ },
+ {
+ "x":9,
+ "y":0,
+ "w":3,
+ "h":6,
+ "i":"14",
+ "type":"Widget",
+ "id":"0-0-14",
+ "metricTypes":[
+ "readMetricsValue"
+ ],
+ "metrics":[
+ "meter_elasticsearch_cluster_jvm_memory_used_avg"
+ ],
+ "moved":false,
+ "graph":{
+ "type":"Card",
+ "fontSize":14,
+ "textAlign":"center",
+ "showUnit":true
+ },
+ "widget":{
+ "title":"JVM memory used Avg (%)"
+ }
+ },
+ {
+ "x":21,
+ "y":0,
+ "w":3,
+ "h":6,
+ "i":"15",
+ "type":"Widget",
+ "id":"0-0-15",
+ "metricTypes":[
+ "readMetricsValue"
+ ],
+ "metrics":[
+ "meter_elasticsearch_cluster_open_file_descriptors"
+ ],
+ "moved":false,
+ "graph":{
+ "type":"Card",
+ "fontSize":14,
+ "textAlign":"center",
+ "showUnit":true
+ },
+ "widget":{
+ "title":"Open files descriptors per cluster"
Review Comment:
Makes sense
--
This is an automated message from the Apache Git Service.
To respond to the message, please log on to GitHub and use the
URL above to go to the specific comment.
To unsubscribe, e-mail: notifications-unsubscribe@skywalking.apache.org
For queries about this service, please contact Infrastructure at:
users@infra.apache.org
[GitHub] [skywalking] wankai123 commented on a diff in pull request #10690: Support Elasticsearch monitoring
Posted by "wankai123 (via GitHub)" <gi...@apache.org>.
wankai123 commented on code in PR #10690:
URL: https://github.com/apache/skywalking/pull/10690#discussion_r1168096114


##########
oap-server/server-starter/src/main/resources/ui-initialized-templates/elasticsearch/elasticsearch-index.json:
##########
@@ -0,0 +1,674 @@
+/**
+ * Licensed to the Apache Software Foundation (ASF) under one or more
+ * contributor license agreements.  See the NOTICE file distributed with
+ * this work for additional information regarding copyright ownership.
+ * The ASF licenses this file to You under the Apache License, Version 2.0
+ * (the "License"); you may not use this file except in compliance with
+ * the License.  You may obtain a copy of the License at
+ *
+ *      http://www.apache.org/licenses/LICENSE-2.0
+ *
+ * Unless required by applicable law or agreed to in writing, software
+ * distributed under the License is distributed on an "AS IS" BASIS,
+ * WITHOUT WARRANTIES OR CONDITIONS OF ANY KIND, either express or implied.
+ * See the License for the specific language governing permissions and
+ * limitations under the License.
+ */
+[
+  {
+    "id": "Elasticsearch-Index",
+    "configuration": {
+      "children":[
+        {
+          "x":0,
+          "y":6,
+          "w":12,
+          "h":13,
+          "i":"0",
+          "type":"Widget",
+          "id":"0",
+          "metricTypes":[
+            "readMetricsValues",
+            "readMetricsValues"
+          ],
+          "metrics":[
+            "meter_elasticsearch_index_stats_indexing_index_total_req_rate",
+            "meter_elasticsearch_index_stats_indexing_index_total_proc_rate"
+          ],
+          "moved":false,
+          "graph":{
+            "type":"Line",
+            "step":false,
+            "smooth":false,
+            "showSymbol":false,
+            "showXAxis":true,
+            "showYAxis":true
+          },
+          "widget":{
+            "title":"Indexing rate"
+          }
+        },
+        {
+          "x":12,
+          "y":6,
+          "w":12,
+          "h":13,
+          "i":"1",
+          "type":"Widget",
+          "id":"1",
+          "metricTypes":[
+            "readMetricsValues",
+            "readMetricsValues"
+          ],
+          "metrics":[
+            "meter_elasticsearch_index_stats_search_query_total_req_rate",
+            "meter_elasticsearch_index_stats_search_query_total_proc_rate"
+          ],
+          "moved":false,
+          "graph":{
+            "type":"Line",
+            "step":false,
+            "smooth":false,
+            "showSymbol":false,

Review Comment:
   Notice:
   The new UI submodule version will default set the `Line graph ` style to show the point on the line by setting `showSymbol:true`.
   we need to set this config to `true` if the UI template is exported from an old version to keep the UI consistent.
   please refer to: https://github.com/apache/skywalking/pull/10687


--
This is an automated message from the Apache Git Service.
To respond to the message, please log on to GitHub and use the
URL above to go to the specific comment.

To unsubscribe, e-mail: notifications-unsubscribe@skywalking.apache.org

For queries about this service, please contact Infrastructure at:
users@infra.apache.org
[GitHub] [skywalking] wankai123 commented on a diff in pull request #10690: Support Elasticsearch monitoring
Posted by "wankai123 (via GitHub)" <gi...@apache.org>.
wankai123 commented on code in PR #10690:
URL: https://github.com/apache/skywalking/pull/10690#discussion_r1168102004


##########
oap-server/server-starter/src/main/resources/ui-initialized-templates/elasticsearch/elasticsearch-index.json:
##########
@@ -0,0 +1,674 @@
+/**
+ * Licensed to the Apache Software Foundation (ASF) under one or more
+ * contributor license agreements.  See the NOTICE file distributed with
+ * this work for additional information regarding copyright ownership.
+ * The ASF licenses this file to You under the Apache License, Version 2.0
+ * (the "License"); you may not use this file except in compliance with
+ * the License.  You may obtain a copy of the License at
+ *
+ *      http://www.apache.org/licenses/LICENSE-2.0
+ *
+ * Unless required by applicable law or agreed to in writing, software
+ * distributed under the License is distributed on an "AS IS" BASIS,
+ * WITHOUT WARRANTIES OR CONDITIONS OF ANY KIND, either express or implied.
+ * See the License for the specific language governing permissions and
+ * limitations under the License.
+ */
+[
+  {
+    "id": "Elasticsearch-Index",
+    "configuration": {
+      "children":[
+        {
+          "x":0,
+          "y":6,
+          "w":12,
+          "h":13,
+          "i":"0",
+          "type":"Widget",
+          "id":"0",
+          "metricTypes":[
+            "readMetricsValues",
+            "readMetricsValues"
+          ],
+          "metrics":[
+            "meter_elasticsearch_index_stats_indexing_index_total_req_rate",
+            "meter_elasticsearch_index_stats_indexing_index_total_proc_rate"
+          ],
+          "moved":false,
+          "graph":{
+            "type":"Line",
+            "step":false,
+            "smooth":false,
+            "showSymbol":false,
+            "showXAxis":true,
+            "showYAxis":true
+          },
+          "widget":{
+            "title":"Indexing rate"
+          }
+        },
+        {
+          "x":12,
+          "y":6,
+          "w":12,
+          "h":13,
+          "i":"1",
+          "type":"Widget",
+          "id":"1",
+          "metricTypes":[
+            "readMetricsValues",
+            "readMetricsValues"
+          ],
+          "metrics":[
+            "meter_elasticsearch_index_stats_search_query_total_req_rate",
+            "meter_elasticsearch_index_stats_search_query_total_proc_rate"
+          ],
+          "moved":false,
+          "graph":{
+            "type":"Line",
+            "step":false,
+            "smooth":false,
+            "showSymbol":false,

Review Comment:
   > > If I re-save the data using the new UI (latest commit), will it take effect?
   >
   > I think so :) @Fine0830

   Sorry, re-save need you clean and re-create the dashboard, the better way manually changes it on the templates


--
This is an automated message from the Apache Git Service.
To respond to the message, please log on to GitHub and use the
URL above to go to the specific comment.

To unsubscribe, e-mail: notifications-unsubscribe@skywalking.apache.org

For queries about this service, please contact Infrastructure at:
users@infra.apache.org
[GitHub] [skywalking] wankai123 commented on a diff in pull request #10690: Support Elasticsearch monitoring
Posted by "wankai123 (via GitHub)" <gi...@apache.org>.
wankai123 commented on code in PR #10690:
URL: https://github.com/apache/skywalking/pull/10690#discussion_r1168106444


##########
oap-server/server-starter/src/main/resources/ui-initialized-templates/elasticsearch/elasticsearch-index.json:
##########
@@ -0,0 +1,674 @@
+/**
+ * Licensed to the Apache Software Foundation (ASF) under one or more
+ * contributor license agreements.  See the NOTICE file distributed with
+ * this work for additional information regarding copyright ownership.
+ * The ASF licenses this file to You under the Apache License, Version 2.0
+ * (the "License"); you may not use this file except in compliance with
+ * the License.  You may obtain a copy of the License at
+ *
+ *      http://www.apache.org/licenses/LICENSE-2.0
+ *
+ * Unless required by applicable law or agreed to in writing, software
+ * distributed under the License is distributed on an "AS IS" BASIS,
+ * WITHOUT WARRANTIES OR CONDITIONS OF ANY KIND, either express or implied.
+ * See the License for the specific language governing permissions and
+ * limitations under the License.
+ */
+[
+  {
+    "id": "Elasticsearch-Index",
+    "configuration": {
+      "children":[
+        {
+          "x":0,
+          "y":6,
+          "w":12,
+          "h":13,
+          "i":"0",
+          "type":"Widget",
+          "id":"0",
+          "metricTypes":[
+            "readMetricsValues",
+            "readMetricsValues"
+          ],
+          "metrics":[
+            "meter_elasticsearch_index_stats_indexing_index_total_req_rate",
+            "meter_elasticsearch_index_stats_indexing_index_total_proc_rate"
+          ],
+          "moved":false,
+          "graph":{
+            "type":"Line",
+            "step":false,
+            "smooth":false,
+            "showSymbol":false,
+            "showXAxis":true,
+            "showYAxis":true
+          },
+          "widget":{
+            "title":"Indexing rate"
+          }
+        },
+        {
+          "x":12,
+          "y":6,
+          "w":12,
+          "h":13,
+          "i":"1",
+          "type":"Widget",
+          "id":"1",
+          "metricTypes":[
+            "readMetricsValues",
+            "readMetricsValues"
+          ],
+          "metrics":[
+            "meter_elasticsearch_index_stats_search_query_total_req_rate",
+            "meter_elasticsearch_index_stats_search_query_total_proc_rate"
+          ],
+          "moved":false,
+          "graph":{
+            "type":"Line",
+            "step":false,
+            "smooth":false,
+            "showSymbol":false,

Review Comment:
   - Update the UI submodule to the latest.
   - Find and replace `"showSymbol":false` to `"showSymbol":true` in your UI templates.
   - Clean the UI templates in your storage and restart OAP

   then you can check if it's working.


--
This is an automated message from the Apache Git Service.
To respond to the message, please log on to GitHub and use the
URL above to go to the specific comment.

To unsubscribe, e-mail: notifications-unsubscribe@skywalking.apache.org

For queries about this service, please contact Infrastructure at:
users@infra.apache.org
[GitHub] [skywalking] innerpeacez commented on pull request #10690: Support Elasticsearch monitoring
Posted by "innerpeacez (via GitHub)" <gi...@apache.org>.
innerpeacez commented on PR #10690:
URL: https://github.com/apache/skywalking/pull/10690#issuecomment-1508301671

   The e2e test has not been completed yet. Please wait for me to complete.


--
This is an automated message from the Apache Git Service.
To respond to the message, please log on to GitHub and use the
URL above to go to the specific comment.

To unsubscribe, e-mail: notifications-unsubscribe@skywalking.apache.org

For queries about this service, please contact Infrastructure at:
users@infra.apache.org
[GitHub] [skywalking] wu-sheng commented on pull request #10690: Support Elasticsearch monitoring
Posted by "wu-sheng (via GitHub)" <gi...@apache.org>.
wu-sheng commented on PR #10690:
URL: https://github.com/apache/skywalking/pull/10690#issuecomment-1512802260

   e2e infra tool is available for Linux and Mac.
   Ref https://skywalking.apache.org/docs/skywalking-infra-e2e/next/readme/

   CI steps show that as well.


--
This is an automated message from the Apache Git Service.
To respond to the message, please log on to GitHub and use the
URL above to go to the specific comment.

To unsubscribe, e-mail: notifications-unsubscribe@skywalking.apache.org

For queries about this service, please contact Infrastructure at:
users@infra.apache.org
[GitHub] [skywalking] wu-sheng commented on a diff in pull request #10690: Support Elasticsearch monitoring
Posted by "wu-sheng (via GitHub)" <gi...@apache.org>.
wu-sheng commented on code in PR #10690:
URL: https://github.com/apache/skywalking/pull/10690#discussion_r1168061788


##########
oap-server/server-starter/src/main/resources/ui-initialized-templates/elasticsearch/elasticsearch-index.json:
##########
@@ -0,0 +1,674 @@
+/**
+ * Licensed to the Apache Software Foundation (ASF) under one or more
+ * contributor license agreements.  See the NOTICE file distributed with
+ * this work for additional information regarding copyright ownership.
+ * The ASF licenses this file to You under the Apache License, Version 2.0
+ * (the "License"); you may not use this file except in compliance with
+ * the License.  You may obtain a copy of the License at
+ *
+ *      http://www.apache.org/licenses/LICENSE-2.0
+ *
+ * Unless required by applicable law or agreed to in writing, software
+ * distributed under the License is distributed on an "AS IS" BASIS,
+ * WITHOUT WARRANTIES OR CONDITIONS OF ANY KIND, either express or implied.
+ * See the License for the specific language governing permissions and
+ * limitations under the License.
+ */
+[
+  {
+    "id": "Elasticsearch-Index",
+    "configuration": {
+      "children":[
+        {
+          "x":0,
+          "y":6,
+          "w":12,
+          "h":13,
+          "i":"0",
+          "type":"Widget",
+          "id":"0",
+          "metricTypes":[
+            "readMetricsValues",
+            "readMetricsValues"
+          ],
+          "metrics":[
+            "meter_elasticsearch_index_stats_indexing_index_total_req_rate",
+            "meter_elasticsearch_index_stats_indexing_index_total_proc_rate"
+          ],
+          "moved":false,
+          "graph":{
+            "type":"Line",
+            "step":false,
+            "smooth":false,
+            "showSymbol":false,
+            "showXAxis":true,
+            "showYAxis":true
+          },
+          "widget":{
+            "title":"Indexing rate"
+          }
+        },
+        {
+          "x":12,
+          "y":6,
+          "w":12,
+          "h":13,
+          "i":"1",
+          "type":"Widget",
+          "id":"1",
+          "metricTypes":[
+            "readMetricsValues",
+            "readMetricsValues"
+          ],
+          "metrics":[
+            "meter_elasticsearch_index_stats_search_query_total_req_rate",
+            "meter_elasticsearch_index_stats_search_query_total_proc_rate"
+          ],
+          "moved":false,
+          "graph":{
+            "type":"Line",
+            "step":false,
+            "smooth":false,
+            "showSymbol":false,
+            "showXAxis":true,
+            "showYAxis":true
+          },
+          "widget":{
+            "title":"Searching rate"
+          }
+        },
+        {
+          "x":0,
+          "y":19,
+          "w":12,
+          "h":16,
+          "i":"2",
+          "type":"Widget",
+          "id":"2",
+          "metricTypes":[
+            "readMetricsValues",
+            "readMetricsValues",
+            "readMetricsValues",
+            "readMetricsValues",
+            "readMetricsValues",
+            "readMetricsValues",
+            "readMetricsValues",
+            "readMetricsValues",
+            "readMetricsValues",
+            "readMetricsValues",
+            "readMetricsValues"
+          ],
+          "metrics":[
+            "meter_elasticsearch_index_stats_merge_total_req_rate",
+            "meter_elasticsearch_index_stats_flush_total_req_rate",
+            "meter_elasticsearch_index_stats_refresh_total_req_rate",
+            "meter_elasticsearch_index_stats_warmer_total_req_rate",
+            "meter_elasticsearch_index_stats_indexing_delete_total_req_rate",
+            "meter_elasticsearch_index_stats_search_fetch_total_req_rate",
+            "meter_elasticsearch_index_stats_search_query_total_req_rate",
+            "meter_elasticsearch_index_stats_search_scroll_total_req_rate",
+            "meter_elasticsearch_index_stats_search_suggest_total_req_rate",
+            "meter_elasticsearch_index_stats_indexing_index_total_req_rate",
+            "meter_elasticsearch_index_stats_get_total_req_rate"
+          ],
+          "moved":false,
+          "graph":{
+            "type":"Line",
+            "step":false,
+            "smooth":false,
+            "showSymbol":false,
+            "showXAxis":true,
+            "showYAxis":true
+          },
+          "widget":{
+            "title":"All Operations ReqRate"
+          }
+        },
+        {
+          "x":12,
+          "y":19,
+          "w":12,
+          "h":16,
+          "i":"3",
+          "type":"Widget",
+          "id":"3",
+          "metricTypes":[
+            "readMetricsValues",
+            "readMetricsValues",
+            "readMetricsValues",
+            "readMetricsValues",
+            "readMetricsValues",
+            "readMetricsValues",
+            "readMetricsValues",
+            "readMetricsValues",
+            "readMetricsValues",
+            "readMetricsValues",
+            "readMetricsValues",
+            "readMetricsValues",
+            "readMetricsValues",
+            "readMetricsValues"
+          ],
+          "metrics":[
+            "meter_elasticsearch_index_stats_merge_time_seconds_total",
+            "meter_elasticsearch_index_stats_flush_time_seconds_total",
+            "meter_elasticsearch_index_stats_refresh_time_seconds_total",
+            "meter_elasticsearch_index_stats_warmer_time_seconds_total",
+            "meter_elasticsearch_index_stats_indexing_delete_time_seconds_total",
+            "meter_elasticsearch_index_stats_search_fetch_time_seconds_total",
+            "meter_elasticsearch_index_stats_search_query_time_seconds_total",
+            "meter_elasticsearch_index_stats_search_scroll_time_seconds_total",
+            "meter_elasticsearch_index_stats_search_suggest_time_seconds_total",
+            "meter_elasticsearch_index_stats_indexing_index_time_seconds_total",
+            "meter_elasticsearch_index_stats_get_time_seconds_total",
+            "meter_elasticsearch_index_stats_merge_stopped_time_seconds_total",
+            "meter_elasticsearch_index_stats_merge_throttle_time_seconds_total",
+            "meter_elasticsearch_index_stats_indexing_throttle_time_seconds_total"
+          ],
+          "moved":false,
+          "graph":{
+            "type":"Line",
+            "step":false,
+            "smooth":false,
+            "showSymbol":false,
+            "showXAxis":true,
+            "showYAxis":true
+          },
+          "widget":{
+            "title":"All Operations Runtime/s"
+          }
+        },
+        {
+          "x":0,
+          "y":35,
+          "w":8,
+          "h":13,
+          "i":"4",
+          "type":"Widget",
+          "id":"4",
+          "metricTypes":[
+            "readMetricsValues",
+            "readMetricsValues",
+            "readMetricsValues",
+            "readMetricsValues"
+          ],
+          "metrics":[
+            "meter_elasticsearch_index_search_fetch_avg_time",
+            "meter_elasticsearch_index_search_query_avg_time",
+            "meter_elasticsearch_index_search_scroll_avg_time",
+            "meter_elasticsearch_index_search_suggest_avg_time"
+          ],
+          "moved":false,
+          "graph":{
+            "type":"Line",
+            "step":false,
+            "smooth":false,
+            "showSymbol":false,
+            "showXAxis":true,
+            "showYAxis":true
+          },
+          "widget":{
+            "title":"Avg. Search Time Execute / Request (s)"
+          }
+        },
+        {
+          "x":8,
+          "y":35,
+          "w":8,
+          "h":13,
+          "i":"5",
+          "type":"Widget",
+          "id":"5",
+          "metricTypes":[
+            "readMetricsValues",
+            "readMetricsValues",
+            "readMetricsValues",
+            "readMetricsValues"
+          ],
+          "metrics":[
+            "meter_elasticsearch_index_stats_search_fetch_total_req_rate",
+            "meter_elasticsearch_index_stats_search_query_total_req_rate",
+            "meter_elasticsearch_index_stats_search_scroll_total_req_rate",
+            "meter_elasticsearch_index_stats_search_suggest_total_req_rate"
+          ],
+          "moved":false,
+          "graph":{
+            "type":"Line",
+            "step":false,
+            "smooth":false,
+            "showSymbol":false,
+            "showXAxis":true,
+            "showYAxis":true
+          },
+          "metricConfig":[
+
+          ],
+          "widget":{
+            "title":"Search Operations  Rate (req/s)"
+          }
+        },
+        {
+          "x":16,
+          "y":59,
+          "w":8,
+          "h":11,
+          "i":"6",
+          "type":"Widget",
+          "id":"6",
+          "metricTypes":[
+            "readMetricsValues"
+          ],
+          "metrics":[
+            "meter_elasticsearch_index_indices_store_size_bytes_total"
+          ],
+          "moved":false,
+          "graph":{
+            "type":"Line",
+            "step":false,
+            "smooth":false,
+            "showSymbol":false,
+            "showXAxis":true,
+            "showYAxis":true
+          },
+          "widget":{
+            "title":"Total size of stored index data (All Shards)"
+          },
+          "metricConfig":[
+            {
+              "calculation":"byteToMB"
+            }
+          ]
+        },
+        {
+          "x":0,
+          "y":59,
+          "w":8,
+          "h":11,
+          "i":"7",
+          "type":"Widget",
+          "id":"7",
+          "metricTypes":[
+            "readMetricsValues"
+          ],
+          "metrics":[
+            "meter_elasticsearch_index_indices_docs_total"
+          ],
+          "moved":false,
+          "graph":{
+            "type":"Line",
+            "step":false,
+            "smooth":false,
+            "showSymbol":false,
+            "showXAxis":true,
+            "showYAxis":true
+          },
+          "widget":{
+            "title":"Documents (All Shards)"
+          }
+        },
+        {
+          "x":8,
+          "y":59,
+          "w":8,
+          "h":11,
+          "i":"8",
+          "type":"Widget",
+          "id":"8",
+          "metricTypes":[
+            "readMetricsValues"
+          ],
+          "metrics":[
+            "meter_elasticsearch_index_indices_docs_total_rate"
+          ],
+          "moved":false,
+          "graph":{
+            "type":"Line",
+            "step":false,
+            "smooth":false,
+            "showSymbol":false,
+            "showXAxis":true,
+            "showYAxis":true
+          },
+          "widget":{
+            "title":"Documents Rate (All Shards)"
+          }
+        },
+        {
+          "x":0,
+          "y":48,
+          "w":8,
+          "h":11,
+          "i":"9",
+          "type":"Widget",
+          "id":"9",
+          "metricTypes":[
+            "readMetricsValues"
+          ],
+          "metrics":[
+            "meter_elasticsearch_index_indices_docs_primary"
+          ],
+          "moved":false,
+          "graph":{
+            "type":"Line",
+            "step":false,
+            "smooth":false,
+            "showSymbol":false,
+            "showXAxis":true,
+            "showYAxis":true
+          },
+          "widget":{
+            "title":"Documents (Primary Shards)"
+          }
+        },
+        {
+          "x":8,
+          "y":48,
+          "w":8,
+          "h":11,
+          "i":"10",
+          "type":"Widget",
+          "id":"10",
+          "metricTypes":[
+            "readMetricsValues"
+          ],
+          "metrics":[
+            "meter_elasticsearch_index_indices_docs_primary_rate"
+          ],
+          "moved":false,
+          "graph":{
+            "type":"Line",
+            "step":false,
+            "smooth":false,
+            "showSymbol":false,
+            "showXAxis":true,
+            "showYAxis":true
+          },
+          "widget":{
+            "title":"Documents Rate (Primary Shards)"
+          }
+        },
+        {
+          "x":16,
+          "y":48,
+          "w":8,
+          "h":11,
+          "i":"11",
+          "type":"Widget",
+          "id":"11",
+          "metricTypes":[
+            "readMetricsValues"
+          ],
+          "metrics":[
+            "meter_elasticsearch_index_indices_store_size_bytes_primary"
+          ],
+          "moved":false,
+          "graph":{
+            "type":"Line",
+            "step":false,
+            "smooth":false,
+            "showSymbol":false,
+            "showXAxis":true,
+            "showYAxis":true
+          },
+          "metricConfig":[
+            {
+              "calculation":"byteToMB"
+            }
+          ],
+          "widget":{
+            "title":"Total size of stored index data (Primary Shards) (MB)"
+          }
+        },
+        {
+          "x":0,
+          "y":0,
+          "w":3,
+          "h":6,
+          "i":"12",
+          "type":"Widget",
+          "id":"12",
+          "metricTypes":[
+            "readMetricsValue"
+          ],
+          "metrics":[
+            "meter_elasticsearch_index_indices_docs_primary"
+          ],
+          "moved":false,
+          "graph":{
+            "type":"Card",
+            "fontSize":14,
+            "textAlign":"center",
+            "showUnit":true
+          },
+          "widget":{
+            "title":"Documents Primary"
+          }
+        },
+        {
+          "x":9,
+          "y":0,
+          "w":3,
+          "h":6,
+          "i":"14",
+          "type":"Widget",
+          "id":"14",
+          "metricTypes":[
+            "readMetricsValues"
+          ],
+          "metrics":[
+            "meter_elasticsearch_index_indices_store_size_bytes_total"
+          ],
+          "moved":false,
+          "graph":{
+            "type":"Card",
+            "fontSize":14,
+            "textAlign":"center",
+            "showUnit":true
+          },
+          "metricConfig":[
+            {
+              "calculation":"byteToGB"
+            }
+          ],
+          "widget":{
+            "title":"Data (GB)"
+          }
+        },
+        {
+          "x":6,
+          "y":0,
+          "w":3,
+          "h":6,
+          "i":"15",
+          "type":"Widget",
+          "id":"15",
+          "metricTypes":[
+            "readMetricsValues"
+          ],
+          "metrics":[
+            "meter_elasticsearch_index_indices_store_size_bytes_primary"
+          ],
+          "moved":false,
+          "graph":{
+            "type":"Card",
+            "fontSize":14,
+            "textAlign":"center",
+            "showUnit":true
+          },
+          "metricConfig":[
+            {
+              "calculation":"byteToGB"
+            }
+          ],
+          "widget":{
+            "title":"Data Primary (GB)"
+          }
+        },
+        {
+          "x":18,
+          "y":0,
+          "w":3,
+          "h":6,
+          "i":"16",
+          "type":"Widget",
+          "id":"16",
+          "metricTypes":[
+            "readMetricsValues"
+          ],
+          "metrics":[
+            "meter_elasticsearch_index_indices_segment_count_total"
+          ],
+          "moved":false,
+          "graph":{
+            "type":"Card",
+            "fontSize":14,
+            "textAlign":"center",
+            "showUnit":true
+          },
+          "widget":{
+            "title":"Segments"

Review Comment:
   ```suggestion
               "title":"Segment Count"
   ```


--
This is an automated message from the Apache Git Service.
To respond to the message, please log on to GitHub and use the
URL above to go to the specific comment.

To unsubscribe, e-mail: notifications-unsubscribe@skywalking.apache.org

For queries about this service, please contact Infrastructure at:
users@infra.apache.org
[GitHub] [skywalking] wu-sheng commented on a diff in pull request #10690: Support Elasticsearch monitoring
Posted by "wu-sheng (via GitHub)" <gi...@apache.org>.
wu-sheng commented on code in PR #10690:
URL: https://github.com/apache/skywalking/pull/10690#discussion_r1168099481


##########
oap-server/server-starter/src/main/resources/ui-initialized-templates/elasticsearch/elasticsearch-index.json:
##########
@@ -0,0 +1,674 @@
+/**
+ * Licensed to the Apache Software Foundation (ASF) under one or more
+ * contributor license agreements.  See the NOTICE file distributed with
+ * this work for additional information regarding copyright ownership.
+ * The ASF licenses this file to You under the Apache License, Version 2.0
+ * (the "License"); you may not use this file except in compliance with
+ * the License.  You may obtain a copy of the License at
+ *
+ *      http://www.apache.org/licenses/LICENSE-2.0
+ *
+ * Unless required by applicable law or agreed to in writing, software
+ * distributed under the License is distributed on an "AS IS" BASIS,
+ * WITHOUT WARRANTIES OR CONDITIONS OF ANY KIND, either express or implied.
+ * See the License for the specific language governing permissions and
+ * limitations under the License.
+ */
+[
+  {
+    "id": "Elasticsearch-Index",
+    "configuration": {
+      "children":[
+        {
+          "x":0,
+          "y":6,
+          "w":12,
+          "h":13,
+          "i":"0",
+          "type":"Widget",
+          "id":"0",
+          "metricTypes":[
+            "readMetricsValues",
+            "readMetricsValues"
+          ],
+          "metrics":[
+            "meter_elasticsearch_index_stats_indexing_index_total_req_rate",
+            "meter_elasticsearch_index_stats_indexing_index_total_proc_rate"
+          ],
+          "moved":false,
+          "graph":{
+            "type":"Line",
+            "step":false,
+            "smooth":false,
+            "showSymbol":false,
+            "showXAxis":true,
+            "showYAxis":true
+          },
+          "widget":{
+            "title":"Indexing rate"
+          }
+        },
+        {
+          "x":12,
+          "y":6,
+          "w":12,
+          "h":13,
+          "i":"1",
+          "type":"Widget",
+          "id":"1",
+          "metricTypes":[
+            "readMetricsValues",
+            "readMetricsValues"
+          ],
+          "metrics":[
+            "meter_elasticsearch_index_stats_search_query_total_req_rate",
+            "meter_elasticsearch_index_stats_search_query_total_proc_rate"
+          ],
+          "moved":false,
+          "graph":{
+            "type":"Line",
+            "step":false,
+            "smooth":false,
+            "showSymbol":false,
+            "showXAxis":true,
+            "showYAxis":true
+          },
+          "widget":{
+            "title":"Searching rate"
+          }
+        },
+        {
+          "x":0,
+          "y":19,
+          "w":12,
+          "h":16,
+          "i":"2",
+          "type":"Widget",
+          "id":"2",
+          "metricTypes":[
+            "readMetricsValues",
+            "readMetricsValues",
+            "readMetricsValues",
+            "readMetricsValues",
+            "readMetricsValues",
+            "readMetricsValues",
+            "readMetricsValues",
+            "readMetricsValues",
+            "readMetricsValues",
+            "readMetricsValues",
+            "readMetricsValues"
+          ],
+          "metrics":[
+            "meter_elasticsearch_index_stats_merge_total_req_rate",
+            "meter_elasticsearch_index_stats_flush_total_req_rate",
+            "meter_elasticsearch_index_stats_refresh_total_req_rate",
+            "meter_elasticsearch_index_stats_warmer_total_req_rate",
+            "meter_elasticsearch_index_stats_indexing_delete_total_req_rate",
+            "meter_elasticsearch_index_stats_search_fetch_total_req_rate",
+            "meter_elasticsearch_index_stats_search_query_total_req_rate",
+            "meter_elasticsearch_index_stats_search_scroll_total_req_rate",
+            "meter_elasticsearch_index_stats_search_suggest_total_req_rate",
+            "meter_elasticsearch_index_stats_indexing_index_total_req_rate",
+            "meter_elasticsearch_index_stats_get_total_req_rate"
+          ],
+          "moved":false,
+          "graph":{
+            "type":"Line",
+            "step":false,
+            "smooth":false,
+            "showSymbol":false,
+            "showXAxis":true,
+            "showYAxis":true
+          },
+          "widget":{
+            "title":"All Operations ReqRate"
+          }
+        },
+        {
+          "x":12,
+          "y":19,
+          "w":12,
+          "h":16,
+          "i":"3",
+          "type":"Widget",
+          "id":"3",
+          "metricTypes":[
+            "readMetricsValues",
+            "readMetricsValues",
+            "readMetricsValues",
+            "readMetricsValues",
+            "readMetricsValues",
+            "readMetricsValues",
+            "readMetricsValues",
+            "readMetricsValues",
+            "readMetricsValues",
+            "readMetricsValues",
+            "readMetricsValues",
+            "readMetricsValues",
+            "readMetricsValues",
+            "readMetricsValues"
+          ],
+          "metrics":[
+            "meter_elasticsearch_index_stats_merge_time_seconds_total",
+            "meter_elasticsearch_index_stats_flush_time_seconds_total",
+            "meter_elasticsearch_index_stats_refresh_time_seconds_total",
+            "meter_elasticsearch_index_stats_warmer_time_seconds_total",
+            "meter_elasticsearch_index_stats_indexing_delete_time_seconds_total",
+            "meter_elasticsearch_index_stats_search_fetch_time_seconds_total",
+            "meter_elasticsearch_index_stats_search_query_time_seconds_total",
+            "meter_elasticsearch_index_stats_search_scroll_time_seconds_total",
+            "meter_elasticsearch_index_stats_search_suggest_time_seconds_total",
+            "meter_elasticsearch_index_stats_indexing_index_time_seconds_total",
+            "meter_elasticsearch_index_stats_get_time_seconds_total",
+            "meter_elasticsearch_index_stats_merge_stopped_time_seconds_total",
+            "meter_elasticsearch_index_stats_merge_throttle_time_seconds_total",
+            "meter_elasticsearch_index_stats_indexing_throttle_time_seconds_total"
+          ],
+          "moved":false,
+          "graph":{
+            "type":"Line",
+            "step":false,
+            "smooth":false,
+            "showSymbol":false,
+            "showXAxis":true,
+            "showYAxis":true
+          },
+          "widget":{
+            "title":"All Operations Runtime/s"
+          }
+        },
+        {
+          "x":0,
+          "y":35,
+          "w":8,
+          "h":13,
+          "i":"4",
+          "type":"Widget",
+          "id":"4",
+          "metricTypes":[
+            "readMetricsValues",
+            "readMetricsValues",
+            "readMetricsValues",
+            "readMetricsValues"
+          ],
+          "metrics":[
+            "meter_elasticsearch_index_search_fetch_avg_time",
+            "meter_elasticsearch_index_search_query_avg_time",
+            "meter_elasticsearch_index_search_scroll_avg_time",
+            "meter_elasticsearch_index_search_suggest_avg_time"
+          ],
+          "moved":false,
+          "graph":{
+            "type":"Line",
+            "step":false,
+            "smooth":false,
+            "showSymbol":false,
+            "showXAxis":true,
+            "showYAxis":true
+          },
+          "widget":{
+            "title":"Avg. Search Time Execute / Request (s)"
+          }
+        },
+        {
+          "x":8,
+          "y":35,
+          "w":8,
+          "h":13,
+          "i":"5",
+          "type":"Widget",
+          "id":"5",
+          "metricTypes":[
+            "readMetricsValues",
+            "readMetricsValues",
+            "readMetricsValues",
+            "readMetricsValues"
+          ],
+          "metrics":[
+            "meter_elasticsearch_index_stats_search_fetch_total_req_rate",
+            "meter_elasticsearch_index_stats_search_query_total_req_rate",
+            "meter_elasticsearch_index_stats_search_scroll_total_req_rate",
+            "meter_elasticsearch_index_stats_search_suggest_total_req_rate"
+          ],
+          "moved":false,
+          "graph":{
+            "type":"Line",
+            "step":false,
+            "smooth":false,
+            "showSymbol":false,
+            "showXAxis":true,
+            "showYAxis":true
+          },
+          "metricConfig":[
+
+          ],
+          "widget":{
+            "title":"Search Operations  Rate (req/s)"
+          }
+        },
+        {
+          "x":16,
+          "y":59,
+          "w":8,
+          "h":11,
+          "i":"6",
+          "type":"Widget",
+          "id":"6",
+          "metricTypes":[
+            "readMetricsValues"
+          ],
+          "metrics":[
+            "meter_elasticsearch_index_indices_store_size_bytes_total"
+          ],
+          "moved":false,
+          "graph":{
+            "type":"Line",
+            "step":false,
+            "smooth":false,
+            "showSymbol":false,
+            "showXAxis":true,
+            "showYAxis":true
+          },
+          "widget":{
+            "title":"Total size of stored index data (All Shards)"
+          },
+          "metricConfig":[
+            {
+              "calculation":"byteToMB"
+            }
+          ]
+        },
+        {
+          "x":0,
+          "y":59,
+          "w":8,
+          "h":11,
+          "i":"7",
+          "type":"Widget",
+          "id":"7",
+          "metricTypes":[
+            "readMetricsValues"
+          ],
+          "metrics":[
+            "meter_elasticsearch_index_indices_docs_total"
+          ],
+          "moved":false,
+          "graph":{
+            "type":"Line",
+            "step":false,
+            "smooth":false,
+            "showSymbol":false,
+            "showXAxis":true,
+            "showYAxis":true
+          },
+          "widget":{
+            "title":"Documents (All Shards)"
+          }
+        },
+        {
+          "x":8,
+          "y":59,
+          "w":8,
+          "h":11,
+          "i":"8",
+          "type":"Widget",
+          "id":"8",
+          "metricTypes":[
+            "readMetricsValues"
+          ],
+          "metrics":[
+            "meter_elasticsearch_index_indices_docs_total_rate"
+          ],
+          "moved":false,
+          "graph":{
+            "type":"Line",
+            "step":false,
+            "smooth":false,
+            "showSymbol":false,
+            "showXAxis":true,
+            "showYAxis":true
+          },
+          "widget":{
+            "title":"Documents Rate (All Shards)"

Review Comment:
   `New Documents Per Min` seems a clear title.


--
This is an automated message from the Apache Git Service.
To respond to the message, please log on to GitHub and use the
URL above to go to the specific comment.

To unsubscribe, e-mail: notifications-unsubscribe@skywalking.apache.org

For queries about this service, please contact Infrastructure at:
users@infra.apache.org
[GitHub] [skywalking] innerpeacez commented on a diff in pull request #10690: Support Elasticsearch monitoring
Posted by "innerpeacez (via GitHub)" <gi...@apache.org>.
innerpeacez commented on code in PR #10690:
URL: https://github.com/apache/skywalking/pull/10690#discussion_r1167862295
##########
oap-server/server-starter/src/main/resources/ui-initialized-templates/elasticsearch/elasticsearch-cluster.json:
##########
@@ -0,0 +1,454 @@
+/**
+ * Licensed to the Apache Software Foundation (ASF) under one or more
+ * contributor license agreements. See the NOTICE file distributed with
+ * this work for additional information regarding copyright ownership.
+ * The ASF licenses this file to You under the Apache License, Version 2.0
+ * (the "License"); you may not use this file except in compliance with
+ * the License. You may obtain a copy of the License at
+ *
+ * http://www.apache.org/licenses/LICENSE-2.0
+ *
+ * Unless required by applicable law or agreed to in writing, software
+ * distributed under the License is distributed on an "AS IS" BASIS,
+ * WITHOUT WARRANTIES OR CONDITIONS OF ANY KIND, either express or implied.
+ * See the License for the specific language governing permissions and
+ * limitations under the License.
+ */
+[
+ {
+ "id": "Elasticsearch-Cluster",
+ "configuration": {
+ "children":[
+ {
+ "x":0,
+ "y":0,
+ "w":24,
+ "h":56,
+ "i":"0",
+ "type":"Tab",
+ "id":"0",
+ "metricTypes":[
+ ""
+ ],
+ "metrics":[
+ ""
+ ],
+ "activedTabIndex":0,
+ "children":[
+ {
+ "name":"Overview",
+ "children":[
+ {
+ "x":0,
+ "y":0,
+ "w":3,
+ "h":6,
+ "i":"0",
+ "type":"Widget",
+ "id":"0-0-0",
+ "metricTypes":[
+ "readLabeledMetricsValues"
+ ],
+ "metrics":[
+ "meter_elasticsearch_cluster_health_status"
+ ],
+ "moved":false,
+ "graph":{
+ "type":"Table",
+ "showTableValues":false,
+ "tableHeaderCol1":"status",
+ "tableHeaderCol2":""
+ },
+ "widget":{
+ "title":"Cluster health"
+ }
+ },
+ {
+ "x":15,
+ "y":0,
+ "w":3,
+ "h":6,
+ "i":"1",
+ "type":"Widget",
+ "id":"0-0-1",
+ "metricTypes":[
+ "readMetricsValue"
+ ],
+ "metrics":[
+ "meter_elasticsearch_cluster_nodes"
+ ],
+ "moved":false,
+ "graph":{
+ "type":"Card",
+ "fontSize":14,
+ "textAlign":"center",
+ "showUnit":true
+ },
+ "widget":{
+ "title":"Data nodes"
+ }
+ },
+ {
+ "x":12,
+ "y":0,
+ "w":3,
+ "h":6,
+ "i":"2",
+ "type":"Widget",
+ "id":"0-0-2",
+ "metricTypes":[
+ "readMetricsValue"
+ ],
+ "metrics":[
+ "meter_elasticsearch_cluster_nodes"
+ ],
+ "moved":false,
+ "graph":{
+ "type":"Card",
+ "fontSize":14,
+ "textAlign":"center",
+ "showUnit":true
+ },
+ "widget":{
+ "title":"Nodes"
+ }
+ },
+ {
+ "x":18,
+ "y":0,
+ "w":3,
+ "h":6,
+ "i":"3",
+ "type":"Widget",
+ "id":"0-0-3",
+ "metricTypes":[
+ "readMetricsValue"
+ ],
+ "metrics":[
+ "meter_elasticsearch_cluster_pending_tasks_total"
+ ],
+ "moved":false,
+ "graph":{
+ "type":"Card",
+ "fontSize":14,
+ "textAlign":"center",
+ "showUnit":true
+ },
+ "widget":{
+ "title":"Pending tasks"
+ }
+ },
+ {
+ "x":0,
+ "y":6,
+ "w":4,
+ "h":5,
+ "i":"4",
+ "type":"Widget",
+ "id":"0-0-4",
+ "metricTypes":[
+ "readMetricsValue"
+ ],
+ "metrics":[
+ "meter_elasticsearch_cluster_primary_shards_total"
+ ],
+ "moved":false,
+ "graph":{
+ "type":"Card",
+ "fontSize":14,
+ "textAlign":"center",
+ "showUnit":false
+ },
+ "widget":{
+ "title":"Active primary shards"
+ }
+ },
+ {
+ "x":4,
+ "y":6,
+ "w":4,
+ "h":5,
+ "i":"5",
+ "type":"Widget",
+ "id":"0-0-5",
+ "metricTypes":[
+ "readMetricsValue"
+ ],
+ "metrics":[
+ "meter_elasticsearch_cluster_shards_total"
+ ],
+ "moved":false,
+ "graph":{
+ "type":"Card",
+ "fontSize":14,
+ "textAlign":"center",
+ "showUnit":false
+ },
+ "widget":{
+ "title":"Active shards"
+ }
+ },
+ {
+ "x":8,
+ "y":6,
+ "w":4,
+ "h":5,
+ "i":"6",
+ "type":"Widget",
+ "id":"0-0-6",
+ "metricTypes":[
+ "readMetricsValue"
+ ],
+ "metrics":[
+ "meter_elasticsearch_cluster_initializing_shards_total"
+ ],
+ "moved":false,
+ "graph":{
+ "type":"Card",
+ "fontSize":14,
+ "textAlign":"center",
+ "showUnit":false
+ },
+ "widget":{
+ "title":"Initializing shards"
+ }
+ },
+ {
+ "x":16,
+ "y":6,
+ "w":4,
+ "h":5,
+ "i":"7",
+ "type":"Widget",
+ "id":"0-0-7",
+ "metricTypes":[
+ "readMetricsValue"
+ ],
+ "metrics":[
+ "meter_elasticsearch_cluster_delayed_unassigned_shards_total"
+ ],
+ "moved":false,
+ "graph":{
+ "type":"Card",
+ "fontSize":14,
+ "textAlign":"center",
+ "showUnit":false
+ },
+ "widget":{
+ "title":"Delayed unassigned shards"
+ }
+ },
+ {
+ "x":20,
+ "y":6,
+ "w":4,
+ "h":5,
+ "i":"8",
+ "type":"Widget",
+ "id":"0-0-8",
+ "metricTypes":[
+ "readMetricsValue"
+ ],
+ "metrics":[
+ "meter_elasticsearch_cluster_relocating_shards_total"
+ ],
+ "moved":false,
+ "graph":{
+ "type":"Card",
+ "fontSize":14,
+ "textAlign":"center",
+ "showUnit":false
+ },
+ "widget":{
+ "title":"Relocating shards"
+ }
+ },
+ {
+ "x":12,
+ "y":6,
+ "w":4,
+ "h":5,
+ "i":"9",
+ "type":"Widget",
+ "id":"0-0-9",
+ "metricTypes":[
+ "readMetricsValue"
+ ],
+ "metrics":[
+ "meter_elasticsearch_cluster_unassigned_shards_total"
+ ],
+ "moved":false,
+ "graph":{
+ "type":"Card",
+ "fontSize":14,
+ "textAlign":"center",
+ "showUnit":false
+ },
+ "widget":{
+ "title":"Unassigned shards"
+ }
+ },
+ {
+ "x":3,
+ "y":0,
+ "w":3,
+ "h":6,
+ "i":"12",
+ "type":"Widget",
+ "id":"0-0-12",
+ "metricTypes":[
+ "readMetricsValues"
+ ],
+ "metrics":[
+ "meter_elasticsearch_cluster_breakers_tripped"
+ ],
+ "moved":false,
+ "graph":{
+ "type":"Card",
+ "fontSize":14,
+ "textAlign":"center",
+ "showUnit":true
+ },
+ "widget":{
+ "title":"Tripped of breakers"
+ }
+ },
+ {
+ "x":6,
+ "y":0,
+ "w":3,
+ "h":6,
+ "i":"13",
+ "type":"Widget",
+ "id":"0-0-13",
+ "metricTypes":[
+ "readMetricsValue"
+ ],
+ "metrics":[
+ "meter_elasticsearch_cluster_cpu_usage_avg"
+ ],
+ "moved":false,
+ "graph":{
+ "type":"Card",
+ "fontSize":14,
+ "textAlign":"center",
+ "showUnit":true
+ },
+ "widget":{
+ "title":"CPU usage Avg (%)"
+ }
+ },
+ {
+ "x":9,
+ "y":0,
+ "w":3,
+ "h":6,
+ "i":"14",
+ "type":"Widget",
+ "id":"0-0-14",
+ "metricTypes":[
+ "readMetricsValue"
+ ],
+ "metrics":[
+ "meter_elasticsearch_cluster_jvm_memory_used_avg"
+ ],
+ "moved":false,
+ "graph":{
+ "type":"Card",
+ "fontSize":14,
+ "textAlign":"center",
+ "showUnit":true
+ },
+ "widget":{
+ "title":"JVM memory used Avg (%)"
+ }
+ },
+ {
+ "x":21,
+ "y":0,
+ "w":3,
+ "h":6,
+ "i":"15",
+ "type":"Widget",
+ "id":"0-0-15",
+ "metricTypes":[
+ "readMetricsValue"
+ ],
+ "metrics":[
+ "meter_elasticsearch_cluster_open_file_descriptors"
Review Comment:
It seems that I did not save the dashboard after modifying it through the UI.
--
This is an automated message from the Apache Git Service.
To respond to the message, please log on to GitHub and use the
URL above to go to the specific comment.
To unsubscribe, e-mail: notifications-unsubscribe@skywalking.apache.org
For queries about this service, please contact Infrastructure at:
users@infra.apache.org
[GitHub] [skywalking] wu-sheng commented on pull request #10690: Support Elasticsearch monitoring
Posted by "wu-sheng (via GitHub)" <gi...@apache.org>.
wu-sheng commented on PR #10690:
URL: https://github.com/apache/skywalking/pull/10690#issuecomment-1509619880

   > BTW, don't we need e2e test?

   It had been mentioned, it will be soon.


--
This is an automated message from the Apache Git Service.
To respond to the message, please log on to GitHub and use the
URL above to go to the specific comment.

To unsubscribe, e-mail: notifications-unsubscribe@skywalking.apache.org

For queries about this service, please contact Infrastructure at:
users@infra.apache.org
[GitHub] [skywalking] wu-sheng commented on a diff in pull request #10690: Support Elasticsearch monitoring
Posted by "wu-sheng (via GitHub)" <gi...@apache.org>.
wu-sheng commented on code in PR #10690:
URL: https://github.com/apache/skywalking/pull/10690#discussion_r1168061027


##########
oap-server/server-starter/src/main/resources/ui-initialized-templates/elasticsearch/elasticsearch-index.json:
##########
@@ -0,0 +1,674 @@
+/**
+ * Licensed to the Apache Software Foundation (ASF) under one or more
+ * contributor license agreements.  See the NOTICE file distributed with
+ * this work for additional information regarding copyright ownership.
+ * The ASF licenses this file to You under the Apache License, Version 2.0
+ * (the "License"); you may not use this file except in compliance with
+ * the License.  You may obtain a copy of the License at
+ *
+ *      http://www.apache.org/licenses/LICENSE-2.0
+ *
+ * Unless required by applicable law or agreed to in writing, software
+ * distributed under the License is distributed on an "AS IS" BASIS,
+ * WITHOUT WARRANTIES OR CONDITIONS OF ANY KIND, either express or implied.
+ * See the License for the specific language governing permissions and
+ * limitations under the License.
+ */
+[
+  {
+    "id": "Elasticsearch-Index",
+    "configuration": {
+      "children":[
+        {
+          "x":0,
+          "y":6,
+          "w":12,
+          "h":13,
+          "i":"0",
+          "type":"Widget",
+          "id":"0",
+          "metricTypes":[
+            "readMetricsValues",
+            "readMetricsValues"
+          ],
+          "metrics":[
+            "meter_elasticsearch_index_stats_indexing_index_total_req_rate",
+            "meter_elasticsearch_index_stats_indexing_index_total_proc_rate"
+          ],
+          "moved":false,
+          "graph":{
+            "type":"Line",
+            "step":false,
+            "smooth":false,
+            "showSymbol":false,
+            "showXAxis":true,
+            "showYAxis":true
+          },
+          "widget":{
+            "title":"Indexing rate"
+          }
+        },
+        {
+          "x":12,
+          "y":6,
+          "w":12,
+          "h":13,
+          "i":"1",
+          "type":"Widget",
+          "id":"1",
+          "metricTypes":[
+            "readMetricsValues",
+            "readMetricsValues"
+          ],
+          "metrics":[
+            "meter_elasticsearch_index_stats_search_query_total_req_rate",
+            "meter_elasticsearch_index_stats_search_query_total_proc_rate"
+          ],
+          "moved":false,
+          "graph":{
+            "type":"Line",
+            "step":false,
+            "smooth":false,
+            "showSymbol":false,
+            "showXAxis":true,
+            "showYAxis":true
+          },
+          "widget":{
+            "title":"Searching rate"
+          }
+        },
+        {
+          "x":0,
+          "y":19,
+          "w":12,
+          "h":16,
+          "i":"2",
+          "type":"Widget",
+          "id":"2",
+          "metricTypes":[
+            "readMetricsValues",
+            "readMetricsValues",
+            "readMetricsValues",
+            "readMetricsValues",
+            "readMetricsValues",
+            "readMetricsValues",
+            "readMetricsValues",
+            "readMetricsValues",
+            "readMetricsValues",
+            "readMetricsValues",
+            "readMetricsValues"
+          ],
+          "metrics":[
+            "meter_elasticsearch_index_stats_merge_total_req_rate",
+            "meter_elasticsearch_index_stats_flush_total_req_rate",
+            "meter_elasticsearch_index_stats_refresh_total_req_rate",
+            "meter_elasticsearch_index_stats_warmer_total_req_rate",
+            "meter_elasticsearch_index_stats_indexing_delete_total_req_rate",
+            "meter_elasticsearch_index_stats_search_fetch_total_req_rate",
+            "meter_elasticsearch_index_stats_search_query_total_req_rate",
+            "meter_elasticsearch_index_stats_search_scroll_total_req_rate",
+            "meter_elasticsearch_index_stats_search_suggest_total_req_rate",
+            "meter_elasticsearch_index_stats_indexing_index_total_req_rate",
+            "meter_elasticsearch_index_stats_get_total_req_rate"
+          ],
+          "moved":false,
+          "graph":{
+            "type":"Line",
+            "step":false,
+            "smooth":false,
+            "showSymbol":false,
+            "showXAxis":true,
+            "showYAxis":true
+          },
+          "widget":{
+            "title":"All Operations ReqRate"
+          }
+        },
+        {
+          "x":12,
+          "y":19,
+          "w":12,
+          "h":16,
+          "i":"3",
+          "type":"Widget",
+          "id":"3",
+          "metricTypes":[
+            "readMetricsValues",
+            "readMetricsValues",
+            "readMetricsValues",
+            "readMetricsValues",
+            "readMetricsValues",
+            "readMetricsValues",
+            "readMetricsValues",
+            "readMetricsValues",
+            "readMetricsValues",
+            "readMetricsValues",
+            "readMetricsValues",
+            "readMetricsValues",
+            "readMetricsValues",
+            "readMetricsValues"
+          ],
+          "metrics":[
+            "meter_elasticsearch_index_stats_merge_time_seconds_total",
+            "meter_elasticsearch_index_stats_flush_time_seconds_total",
+            "meter_elasticsearch_index_stats_refresh_time_seconds_total",
+            "meter_elasticsearch_index_stats_warmer_time_seconds_total",
+            "meter_elasticsearch_index_stats_indexing_delete_time_seconds_total",
+            "meter_elasticsearch_index_stats_search_fetch_time_seconds_total",
+            "meter_elasticsearch_index_stats_search_query_time_seconds_total",
+            "meter_elasticsearch_index_stats_search_scroll_time_seconds_total",
+            "meter_elasticsearch_index_stats_search_suggest_time_seconds_total",
+            "meter_elasticsearch_index_stats_indexing_index_time_seconds_total",
+            "meter_elasticsearch_index_stats_get_time_seconds_total",
+            "meter_elasticsearch_index_stats_merge_stopped_time_seconds_total",
+            "meter_elasticsearch_index_stats_merge_throttle_time_seconds_total",
+            "meter_elasticsearch_index_stats_indexing_throttle_time_seconds_total"
+          ],
+          "moved":false,
+          "graph":{
+            "type":"Line",
+            "step":false,
+            "smooth":false,
+            "showSymbol":false,
+            "showXAxis":true,
+            "showYAxis":true
+          },
+          "widget":{
+            "title":"All Operations Runtime/s"
+          }
+        },
+        {
+          "x":0,
+          "y":35,
+          "w":8,
+          "h":13,
+          "i":"4",
+          "type":"Widget",
+          "id":"4",
+          "metricTypes":[
+            "readMetricsValues",
+            "readMetricsValues",
+            "readMetricsValues",
+            "readMetricsValues"
+          ],
+          "metrics":[
+            "meter_elasticsearch_index_search_fetch_avg_time",
+            "meter_elasticsearch_index_search_query_avg_time",
+            "meter_elasticsearch_index_search_scroll_avg_time",
+            "meter_elasticsearch_index_search_suggest_avg_time"
+          ],
+          "moved":false,
+          "graph":{
+            "type":"Line",
+            "step":false,
+            "smooth":false,
+            "showSymbol":false,
+            "showXAxis":true,
+            "showYAxis":true
+          },
+          "widget":{
+            "title":"Avg. Search Time Execute / Request (s)"
+          }
+        },
+        {
+          "x":8,
+          "y":35,
+          "w":8,
+          "h":13,
+          "i":"5",
+          "type":"Widget",
+          "id":"5",
+          "metricTypes":[
+            "readMetricsValues",
+            "readMetricsValues",
+            "readMetricsValues",
+            "readMetricsValues"
+          ],
+          "metrics":[
+            "meter_elasticsearch_index_stats_search_fetch_total_req_rate",
+            "meter_elasticsearch_index_stats_search_query_total_req_rate",
+            "meter_elasticsearch_index_stats_search_scroll_total_req_rate",
+            "meter_elasticsearch_index_stats_search_suggest_total_req_rate"
+          ],
+          "moved":false,
+          "graph":{
+            "type":"Line",
+            "step":false,
+            "smooth":false,
+            "showSymbol":false,
+            "showXAxis":true,
+            "showYAxis":true
+          },
+          "metricConfig":[
+
+          ],
+          "widget":{
+            "title":"Search Operations  Rate (req/s)"
+          }
+        },
+        {
+          "x":16,
+          "y":59,
+          "w":8,
+          "h":11,
+          "i":"6",
+          "type":"Widget",
+          "id":"6",
+          "metricTypes":[
+            "readMetricsValues"
+          ],
+          "metrics":[
+            "meter_elasticsearch_index_indices_store_size_bytes_total"
+          ],
+          "moved":false,
+          "graph":{
+            "type":"Line",
+            "step":false,
+            "smooth":false,
+            "showSymbol":false,
+            "showXAxis":true,
+            "showYAxis":true
+          },
+          "widget":{
+            "title":"Total size of stored index data (All Shards)"
+          },
+          "metricConfig":[
+            {
+              "calculation":"byteToMB"
+            }
+          ]
+        },
+        {
+          "x":0,
+          "y":59,
+          "w":8,
+          "h":11,
+          "i":"7",
+          "type":"Widget",
+          "id":"7",
+          "metricTypes":[
+            "readMetricsValues"
+          ],
+          "metrics":[
+            "meter_elasticsearch_index_indices_docs_total"
+          ],
+          "moved":false,
+          "graph":{
+            "type":"Line",
+            "step":false,
+            "smooth":false,
+            "showSymbol":false,
+            "showXAxis":true,
+            "showYAxis":true
+          },
+          "widget":{
+            "title":"Documents (All Shards)"
+          }
+        },
+        {
+          "x":8,
+          "y":59,
+          "w":8,
+          "h":11,
+          "i":"8",
+          "type":"Widget",
+          "id":"8",
+          "metricTypes":[
+            "readMetricsValues"
+          ],
+          "metrics":[
+            "meter_elasticsearch_index_indices_docs_total_rate"
+          ],
+          "moved":false,
+          "graph":{
+            "type":"Line",
+            "step":false,
+            "smooth":false,
+            "showSymbol":false,
+            "showXAxis":true,
+            "showYAxis":true
+          },
+          "widget":{
+            "title":"Documents Rate (All Shards)"

Review Comment:
   From reading MAL, this means `New Docs Per Minute`? We need to reword many titles to make the metrics clear.


--
This is an automated message from the Apache Git Service.
To respond to the message, please log on to GitHub and use the
URL above to go to the specific comment.

To unsubscribe, e-mail: notifications-unsubscribe@skywalking.apache.org

For queries about this service, please contact Infrastructure at:
users@infra.apache.org
[GitHub] [skywalking] innerpeacez commented on a diff in pull request #10690: Support Elasticsearch monitoring
Posted by "innerpeacez (via GitHub)" <gi...@apache.org>.
innerpeacez commented on code in PR #10690:
URL: https://github.com/apache/skywalking/pull/10690#discussion_r1168104934


##########
oap-server/server-starter/src/main/resources/ui-initialized-templates/elasticsearch/elasticsearch-index.json:
##########
@@ -0,0 +1,674 @@
+/**
+ * Licensed to the Apache Software Foundation (ASF) under one or more
+ * contributor license agreements.  See the NOTICE file distributed with
+ * this work for additional information regarding copyright ownership.
+ * The ASF licenses this file to You under the Apache License, Version 2.0
+ * (the "License"); you may not use this file except in compliance with
+ * the License.  You may obtain a copy of the License at
+ *
+ *      http://www.apache.org/licenses/LICENSE-2.0
+ *
+ * Unless required by applicable law or agreed to in writing, software
+ * distributed under the License is distributed on an "AS IS" BASIS,
+ * WITHOUT WARRANTIES OR CONDITIONS OF ANY KIND, either express or implied.
+ * See the License for the specific language governing permissions and
+ * limitations under the License.
+ */
+[
+  {
+    "id": "Elasticsearch-Index",
+    "configuration": {
+      "children":[
+        {
+          "x":0,
+          "y":6,
+          "w":12,
+          "h":13,
+          "i":"0",
+          "type":"Widget",
+          "id":"0",
+          "metricTypes":[
+            "readMetricsValues",
+            "readMetricsValues"
+          ],
+          "metrics":[
+            "meter_elasticsearch_index_stats_indexing_index_total_req_rate",
+            "meter_elasticsearch_index_stats_indexing_index_total_proc_rate"
+          ],
+          "moved":false,
+          "graph":{
+            "type":"Line",
+            "step":false,
+            "smooth":false,
+            "showSymbol":false,
+            "showXAxis":true,
+            "showYAxis":true
+          },
+          "widget":{
+            "title":"Indexing rate"
+          }
+        },
+        {
+          "x":12,
+          "y":6,
+          "w":12,
+          "h":13,
+          "i":"1",
+          "type":"Widget",
+          "id":"1",
+          "metricTypes":[
+            "readMetricsValues",
+            "readMetricsValues"
+          ],
+          "metrics":[
+            "meter_elasticsearch_index_stats_search_query_total_req_rate",
+            "meter_elasticsearch_index_stats_search_query_total_proc_rate"
+          ],
+          "moved":false,
+          "graph":{
+            "type":"Line",
+            "step":false,
+            "smooth":false,
+            "showSymbol":false,

Review Comment:
   I can extract the UI template data from Elasticsearch after re-save,  copy it to the JSON file, so that I no need manually modify it ,avoid any possible mistakes. Because I am not very clear about how to write this json file.


--
This is an automated message from the Apache Git Service.
To respond to the message, please log on to GitHub and use the
URL above to go to the specific comment.

To unsubscribe, e-mail: notifications-unsubscribe@skywalking.apache.org

For queries about this service, please contact Infrastructure at:
users@infra.apache.org
[GitHub] [skywalking] wu-sheng commented on a diff in pull request #10690: Support Elasticsearch monitoring
Posted by "wu-sheng (via GitHub)" <gi...@apache.org>.
wu-sheng commented on code in PR #10690:
URL: https://github.com/apache/skywalking/pull/10690#discussion_r1167921973


##########
docs/en/setup/backend/backend-elasticsearch-monitoring.md:
##########
@@ -0,0 +1,118 @@
+# Elasticsearch monitoring

Review Comment:
   You need to update `menu.yml` to add the ref to this file.


--
This is an automated message from the Apache Git Service.
To respond to the message, please log on to GitHub and use the
URL above to go to the specific comment.

To unsubscribe, e-mail: notifications-unsubscribe@skywalking.apache.org

For queries about this service, please contact Infrastructure at:
users@infra.apache.org
[GitHub] [skywalking] wankai123 commented on a diff in pull request #10690: Support Elasticsearch monitoring
Posted by "wankai123 (via GitHub)" <gi...@apache.org>.
wankai123 commented on code in PR #10690:
URL: https://github.com/apache/skywalking/pull/10690#discussion_r1168100543


##########
oap-server/server-starter/src/main/resources/ui-initialized-templates/elasticsearch/elasticsearch-index.json:
##########
@@ -0,0 +1,674 @@
+/**
+ * Licensed to the Apache Software Foundation (ASF) under one or more
+ * contributor license agreements.  See the NOTICE file distributed with
+ * this work for additional information regarding copyright ownership.
+ * The ASF licenses this file to You under the Apache License, Version 2.0
+ * (the "License"); you may not use this file except in compliance with
+ * the License.  You may obtain a copy of the License at
+ *
+ *      http://www.apache.org/licenses/LICENSE-2.0
+ *
+ * Unless required by applicable law or agreed to in writing, software
+ * distributed under the License is distributed on an "AS IS" BASIS,
+ * WITHOUT WARRANTIES OR CONDITIONS OF ANY KIND, either express or implied.
+ * See the License for the specific language governing permissions and
+ * limitations under the License.
+ */
+[
+  {
+    "id": "Elasticsearch-Index",
+    "configuration": {
+      "children":[
+        {
+          "x":0,
+          "y":6,
+          "w":12,
+          "h":13,
+          "i":"0",
+          "type":"Widget",
+          "id":"0",
+          "metricTypes":[
+            "readMetricsValues",
+            "readMetricsValues"
+          ],
+          "metrics":[
+            "meter_elasticsearch_index_stats_indexing_index_total_req_rate",
+            "meter_elasticsearch_index_stats_indexing_index_total_proc_rate"
+          ],
+          "moved":false,
+          "graph":{
+            "type":"Line",
+            "step":false,
+            "smooth":false,
+            "showSymbol":false,
+            "showXAxis":true,
+            "showYAxis":true
+          },
+          "widget":{
+            "title":"Indexing rate"
+          }
+        },
+        {
+          "x":12,
+          "y":6,
+          "w":12,
+          "h":13,
+          "i":"1",
+          "type":"Widget",
+          "id":"1",
+          "metricTypes":[
+            "readMetricsValues",
+            "readMetricsValues"
+          ],
+          "metrics":[
+            "meter_elasticsearch_index_stats_search_query_total_req_rate",
+            "meter_elasticsearch_index_stats_search_query_total_proc_rate"
+          ],
+          "moved":false,
+          "graph":{
+            "type":"Line",
+            "step":false,
+            "smooth":false,
+            "showSymbol":false,

Review Comment:
   > If I re-save the data using the new UI (latest commit), will it take effect?

   I think so :) @Fine0830


--
This is an automated message from the Apache Git Service.
To respond to the message, please log on to GitHub and use the
URL above to go to the specific comment.

To unsubscribe, e-mail: notifications-unsubscribe@skywalking.apache.org

For queries about this service, please contact Infrastructure at:
users@infra.apache.org
[GitHub] [skywalking] wu-sheng commented on pull request #10690: Support Elasticsearch monitoring
Posted by "wu-sheng (via GitHub)" <gi...@apache.org>.
wu-sheng commented on PR #10690:
URL: https://github.com/apache/skywalking/pull/10690#issuecomment-1510533430

   Please check the titles again. I didn't check all, but clearly, they are not well written for now. And `Tooltip Content` is optional for you if you want to provide an explanation about this metric.


--
This is an automated message from the Apache Git Service.
To respond to the message, please log on to GitHub and use the
URL above to go to the specific comment.

To unsubscribe, e-mail: notifications-unsubscribe@skywalking.apache.org

For queries about this service, please contact Infrastructure at:
users@infra.apache.org
[GitHub] [skywalking] wu-sheng commented on pull request #10690: Support Elasticsearch monitoring
Posted by "wu-sheng (via GitHub)" <gi...@apache.org>.
wu-sheng commented on PR #10690:
URL: https://github.com/apache/skywalking/pull/10690#issuecomment-1510919918

   FYI @Fine0830 With the increment number of metrics dashboards, we should consider supporting `setup legend name` for metric graphs.

   <img width="849" alt="image" src="https://user-images.githubusercontent.com/5441976/232428540-bd01b239-7452-4ca4-adda-73f457adcb77.png">

   It should be better than showing the metric name.


--
This is an automated message from the Apache Git Service.
To respond to the message, please log on to GitHub and use the
URL above to go to the specific comment.

To unsubscribe, e-mail: notifications-unsubscribe@skywalking.apache.org

For queries about this service, please contact Infrastructure at:
users@infra.apache.org
[GitHub] [skywalking] wu-sheng commented on a diff in pull request #10690: Support Elasticsearch monitoring
Posted by "wu-sheng (via GitHub)" <gi...@apache.org>.
wu-sheng commented on code in PR #10690:
URL: https://github.com/apache/skywalking/pull/10690#discussion_r1169453747


##########
test/e2e-v2/cases/elasticsearch/docker-compose.yml:
##########
@@ -0,0 +1,79 @@
+# Licensed to the Apache Software Foundation (ASF) under one or more
+# contributor license agreements.  See the NOTICE file distributed with
+# this work for additional information regarding copyright ownership.
+# The ASF licenses this file to You under the Apache License, Version 2.0
+# (the "License"); you may not use this file except in compliance with
+# the License.  You may obtain a copy of the License at
+#
+#     http://www.apache.org/licenses/LICENSE-2.0
+#
+# Unless required by applicable law or agreed to in writing, software
+# distributed under the License is distributed on an "AS IS" BASIS,
+# WITHOUT WARRANTIES OR CONDITIONS OF ANY KIND, either express or implied.
+# See the License for the specific language governing permissions and
+# limitations under the License.
+
+version: '2.1'
+
+services:
+  oap:
+    extends:
+      file: ../../script/docker-compose/base-compose.yml
+      service: oap
+    ports:
+      - 12800
+    networks:
+      - e2e
+  es:
+    image: elastic/elasticsearch:8.3.2
+    expose:
+      - 9200
+    networks:
+      - e2e
+    environment:
+      - discovery.type=single-node
+      - cluster.routing.allocation.disk.threshold_enabled=false
+      - xpack.security.enabled=false
+      - cluster.name=cluster-e2e
+      - node.name=node-e2e
+    healthcheck:
+      test: ["CMD", "bash", "-c", "cat < /dev/null > /dev/tcp/127.0.0.1/9200"]
+      interval: 5s
+      timeout: 60s
+      retries: 120
+  es-exporter:
+    image: quay.io/prometheuscommunity/elasticsearch-exporter:v1.5.0
+    expose:
+      - 9108
+    networks:
+      - e2e
+    environment:
+      - ES_URI=http://es:9200
+    depends_on:
+      - es
+      - oap
+  es-mock:
+    image: curlimages/curl:latest
+    networks:
+      - e2e
+    depends_on:
+      - es
+      - es-exporter
+      - oap
+    command: "sh -c ./es-e2e-data-mock.sh"

Review Comment:
   Push the data into the server to build metrics?


--
This is an automated message from the Apache Git Service.
To respond to the message, please log on to GitHub and use the
URL above to go to the specific comment.

To unsubscribe, e-mail: notifications-unsubscribe@skywalking.apache.org

For queries about this service, please contact Infrastructure at:
users@infra.apache.org
[GitHub] [skywalking] wu-sheng commented on a diff in pull request #10690: Support Elasticsearch monitoring
Posted by "wu-sheng (via GitHub)" <gi...@apache.org>.
wu-sheng commented on code in PR #10690:
URL: https://github.com/apache/skywalking/pull/10690#discussion_r1169593388


##########
test/e2e-v2/cases/elasticsearch/elasticsearch-cases.yaml:
##########
@@ -0,0 +1,21 @@
+# Licensed to the Apache Software Foundation (ASF) under one or more
+# contributor license agreements.  See the NOTICE file distributed with
+# this work for additional information regarding copyright ownership.
+# The ASF licenses this file to You under the Apache License, Version 2.0
+# (the "License"); you may not use this file except in compliance with
+# the License.  You may obtain a copy of the License at
+#
+#     http://www.apache.org/licenses/LICENSE-2.0
+#
+# Unless required by applicable law or agreed to in writing, software
+# distributed under the License is distributed on an "AS IS" BASIS,
+# WITHOUT WARRANTIES OR CONDITIONS OF ANY KIND, either express or implied.
+# See the License for the specific language governing permissions and
+# limitations under the License.
+
+# This file is used to show how to write configuration files and can be used to test.
+
+cases:
+  # service list
+  - query: swctl --display yaml --base-url=http://${oap_host}:${oap_12800}/graphql service ls
+    expected:  expected/service.yml

Review Comment:
   @innerpeacez This is not fully resolved. Typical metrics should be verified too. Otherwise, the meaning of this test is limited.


--
This is an automated message from the Apache Git Service.
To respond to the message, please log on to GitHub and use the
URL above to go to the specific comment.

To unsubscribe, e-mail: notifications-unsubscribe@skywalking.apache.org

For queries about this service, please contact Infrastructure at:
users@infra.apache.org
[GitHub] [skywalking] innerpeacez commented on pull request #10690: Support Elasticsearch monitoring
Posted by "innerpeacez (via GitHub)" <gi...@apache.org>.
innerpeacez commented on PR #10690:
URL: https://github.com/apache/skywalking/pull/10690#issuecomment-1512789520

   > @innerpeacez Do you have issues running e2e locally? I noticed you are adding tests step-by-step verified by CI directly, which costs a little more.

   > Can this be run locally? How can I run it locally?


--
This is an automated message from the Apache Git Service.
To respond to the message, please log on to GitHub and use the
URL above to go to the specific comment.

To unsubscribe, e-mail: notifications-unsubscribe@skywalking.apache.org

For queries about this service, please contact Infrastructure at:
users@infra.apache.org
[GitHub] [skywalking] wankai123 commented on a diff in pull request #10690: Support Elasticsearch monitoring
Posted by "wankai123 (via GitHub)" <gi...@apache.org>.
wankai123 commented on code in PR #10690:
URL: https://github.com/apache/skywalking/pull/10690#discussion_r1169455567


##########
test/e2e-v2/cases/elasticsearch/elasticsearch-cases.yaml:
##########
@@ -0,0 +1,21 @@
+# Licensed to the Apache Software Foundation (ASF) under one or more
+# contributor license agreements.  See the NOTICE file distributed with
+# this work for additional information regarding copyright ownership.
+# The ASF licenses this file to You under the Apache License, Version 2.0
+# (the "License"); you may not use this file except in compliance with
+# the License.  You may obtain a copy of the License at
+#
+#     http://www.apache.org/licenses/LICENSE-2.0
+#
+# Unless required by applicable law or agreed to in writing, software
+# distributed under the License is distributed on an "AS IS" BASIS,
+# WITHOUT WARRANTIES OR CONDITIONS OF ANY KIND, either express or implied.
+# See the License for the specific language governing permissions and
+# limitations under the License.
+
+# This file is used to show how to write configuration files and can be used to test.
+
+cases:
+  # service list
+  - query: swctl --display yaml --base-url=http://${oap_host}:${oap_12800}/graphql service ls
+    expected:  expected/service.yml

Review Comment:
   Don't forget here only verified service.


--
This is an automated message from the Apache Git Service.
To respond to the message, please log on to GitHub and use the
URL above to go to the specific comment.

To unsubscribe, e-mail: notifications-unsubscribe@skywalking.apache.org

For queries about this service, please contact Infrastructure at:
users@infra.apache.org
[GitHub] [skywalking] innerpeacez commented on a diff in pull request #10690: Support Elasticsearch monitoring
Posted by "innerpeacez (via GitHub)" <gi...@apache.org>.
innerpeacez commented on code in PR #10690:
URL: https://github.com/apache/skywalking/pull/10690#discussion_r1168097130


##########
oap-server/server-starter/src/main/resources/ui-initialized-templates/elasticsearch/elasticsearch-index.json:
##########
@@ -0,0 +1,674 @@
+/**
+ * Licensed to the Apache Software Foundation (ASF) under one or more
+ * contributor license agreements.  See the NOTICE file distributed with
+ * this work for additional information regarding copyright ownership.
+ * The ASF licenses this file to You under the Apache License, Version 2.0
+ * (the "License"); you may not use this file except in compliance with
+ * the License.  You may obtain a copy of the License at
+ *
+ *      http://www.apache.org/licenses/LICENSE-2.0
+ *
+ * Unless required by applicable law or agreed to in writing, software
+ * distributed under the License is distributed on an "AS IS" BASIS,
+ * WITHOUT WARRANTIES OR CONDITIONS OF ANY KIND, either express or implied.
+ * See the License for the specific language governing permissions and
+ * limitations under the License.
+ */
+[
+  {
+    "id": "Elasticsearch-Index",
+    "configuration": {
+      "children":[
+        {
+          "x":0,
+          "y":6,
+          "w":12,
+          "h":13,
+          "i":"0",
+          "type":"Widget",
+          "id":"0",
+          "metricTypes":[
+            "readMetricsValues",
+            "readMetricsValues"
+          ],
+          "metrics":[
+            "meter_elasticsearch_index_stats_indexing_index_total_req_rate",
+            "meter_elasticsearch_index_stats_indexing_index_total_proc_rate"
+          ],
+          "moved":false,
+          "graph":{
+            "type":"Line",
+            "step":false,
+            "smooth":false,
+            "showSymbol":false,
+            "showXAxis":true,
+            "showYAxis":true
+          },
+          "widget":{
+            "title":"Indexing rate"
+          }
+        },
+        {
+          "x":12,
+          "y":6,
+          "w":12,
+          "h":13,
+          "i":"1",
+          "type":"Widget",
+          "id":"1",
+          "metricTypes":[
+            "readMetricsValues",
+            "readMetricsValues"
+          ],
+          "metrics":[
+            "meter_elasticsearch_index_stats_search_query_total_req_rate",
+            "meter_elasticsearch_index_stats_search_query_total_proc_rate"
+          ],
+          "moved":false,
+          "graph":{
+            "type":"Line",
+            "step":false,
+            "smooth":false,
+            "showSymbol":false,
+            "showXAxis":true,
+            "showYAxis":true
+          },
+          "widget":{
+            "title":"Searching rate"
+          }
+        },
+        {
+          "x":0,
+          "y":19,
+          "w":12,
+          "h":16,
+          "i":"2",
+          "type":"Widget",
+          "id":"2",
+          "metricTypes":[
+            "readMetricsValues",
+            "readMetricsValues",
+            "readMetricsValues",
+            "readMetricsValues",
+            "readMetricsValues",
+            "readMetricsValues",
+            "readMetricsValues",
+            "readMetricsValues",
+            "readMetricsValues",
+            "readMetricsValues",
+            "readMetricsValues"
+          ],
+          "metrics":[
+            "meter_elasticsearch_index_stats_merge_total_req_rate",
+            "meter_elasticsearch_index_stats_flush_total_req_rate",
+            "meter_elasticsearch_index_stats_refresh_total_req_rate",
+            "meter_elasticsearch_index_stats_warmer_total_req_rate",
+            "meter_elasticsearch_index_stats_indexing_delete_total_req_rate",
+            "meter_elasticsearch_index_stats_search_fetch_total_req_rate",
+            "meter_elasticsearch_index_stats_search_query_total_req_rate",
+            "meter_elasticsearch_index_stats_search_scroll_total_req_rate",
+            "meter_elasticsearch_index_stats_search_suggest_total_req_rate",
+            "meter_elasticsearch_index_stats_indexing_index_total_req_rate",
+            "meter_elasticsearch_index_stats_get_total_req_rate"
+          ],
+          "moved":false,
+          "graph":{
+            "type":"Line",
+            "step":false,
+            "smooth":false,
+            "showSymbol":false,
+            "showXAxis":true,
+            "showYAxis":true
+          },
+          "widget":{
+            "title":"All Operations ReqRate"
+          }
+        },
+        {
+          "x":12,
+          "y":19,
+          "w":12,
+          "h":16,
+          "i":"3",
+          "type":"Widget",
+          "id":"3",
+          "metricTypes":[
+            "readMetricsValues",
+            "readMetricsValues",
+            "readMetricsValues",
+            "readMetricsValues",
+            "readMetricsValues",
+            "readMetricsValues",
+            "readMetricsValues",
+            "readMetricsValues",
+            "readMetricsValues",
+            "readMetricsValues",
+            "readMetricsValues",
+            "readMetricsValues",
+            "readMetricsValues",
+            "readMetricsValues"
+          ],
+          "metrics":[
+            "meter_elasticsearch_index_stats_merge_time_seconds_total",
+            "meter_elasticsearch_index_stats_flush_time_seconds_total",
+            "meter_elasticsearch_index_stats_refresh_time_seconds_total",
+            "meter_elasticsearch_index_stats_warmer_time_seconds_total",
+            "meter_elasticsearch_index_stats_indexing_delete_time_seconds_total",
+            "meter_elasticsearch_index_stats_search_fetch_time_seconds_total",
+            "meter_elasticsearch_index_stats_search_query_time_seconds_total",
+            "meter_elasticsearch_index_stats_search_scroll_time_seconds_total",
+            "meter_elasticsearch_index_stats_search_suggest_time_seconds_total",
+            "meter_elasticsearch_index_stats_indexing_index_time_seconds_total",
+            "meter_elasticsearch_index_stats_get_time_seconds_total",
+            "meter_elasticsearch_index_stats_merge_stopped_time_seconds_total",
+            "meter_elasticsearch_index_stats_merge_throttle_time_seconds_total",
+            "meter_elasticsearch_index_stats_indexing_throttle_time_seconds_total"
+          ],
+          "moved":false,
+          "graph":{
+            "type":"Line",
+            "step":false,
+            "smooth":false,
+            "showSymbol":false,
+            "showXAxis":true,
+            "showYAxis":true
+          },
+          "widget":{
+            "title":"All Operations Runtime/s"
+          }
+        },
+        {
+          "x":0,
+          "y":35,
+          "w":8,
+          "h":13,
+          "i":"4",
+          "type":"Widget",
+          "id":"4",
+          "metricTypes":[
+            "readMetricsValues",
+            "readMetricsValues",
+            "readMetricsValues",
+            "readMetricsValues"
+          ],
+          "metrics":[
+            "meter_elasticsearch_index_search_fetch_avg_time",
+            "meter_elasticsearch_index_search_query_avg_time",
+            "meter_elasticsearch_index_search_scroll_avg_time",
+            "meter_elasticsearch_index_search_suggest_avg_time"
+          ],
+          "moved":false,
+          "graph":{
+            "type":"Line",
+            "step":false,
+            "smooth":false,
+            "showSymbol":false,
+            "showXAxis":true,
+            "showYAxis":true
+          },
+          "widget":{
+            "title":"Avg. Search Time Execute / Request (s)"
+          }
+        },
+        {
+          "x":8,
+          "y":35,
+          "w":8,
+          "h":13,
+          "i":"5",
+          "type":"Widget",
+          "id":"5",
+          "metricTypes":[
+            "readMetricsValues",
+            "readMetricsValues",
+            "readMetricsValues",
+            "readMetricsValues"
+          ],
+          "metrics":[
+            "meter_elasticsearch_index_stats_search_fetch_total_req_rate",
+            "meter_elasticsearch_index_stats_search_query_total_req_rate",
+            "meter_elasticsearch_index_stats_search_scroll_total_req_rate",
+            "meter_elasticsearch_index_stats_search_suggest_total_req_rate"
+          ],
+          "moved":false,
+          "graph":{
+            "type":"Line",
+            "step":false,
+            "smooth":false,
+            "showSymbol":false,
+            "showXAxis":true,
+            "showYAxis":true
+          },
+          "metricConfig":[
+
+          ],
+          "widget":{
+            "title":"Search Operations  Rate (req/s)"
+          }
+        },
+        {
+          "x":16,
+          "y":59,
+          "w":8,
+          "h":11,
+          "i":"6",
+          "type":"Widget",
+          "id":"6",
+          "metricTypes":[
+            "readMetricsValues"
+          ],
+          "metrics":[
+            "meter_elasticsearch_index_indices_store_size_bytes_total"
+          ],
+          "moved":false,
+          "graph":{
+            "type":"Line",
+            "step":false,
+            "smooth":false,
+            "showSymbol":false,
+            "showXAxis":true,
+            "showYAxis":true
+          },
+          "widget":{
+            "title":"Total size of stored index data (All Shards)"
+          },
+          "metricConfig":[
+            {
+              "calculation":"byteToMB"
+            }
+          ]
+        },
+        {
+          "x":0,
+          "y":59,
+          "w":8,
+          "h":11,
+          "i":"7",
+          "type":"Widget",
+          "id":"7",
+          "metricTypes":[
+            "readMetricsValues"
+          ],
+          "metrics":[
+            "meter_elasticsearch_index_indices_docs_total"
+          ],
+          "moved":false,
+          "graph":{
+            "type":"Line",
+            "step":false,
+            "smooth":false,
+            "showSymbol":false,
+            "showXAxis":true,
+            "showYAxis":true
+          },
+          "widget":{
+            "title":"Documents (All Shards)"
+          }
+        },
+        {
+          "x":8,
+          "y":59,
+          "w":8,
+          "h":11,
+          "i":"8",
+          "type":"Widget",
+          "id":"8",
+          "metricTypes":[
+            "readMetricsValues"
+          ],
+          "metrics":[
+            "meter_elasticsearch_index_indices_docs_total_rate"
+          ],
+          "moved":false,
+          "graph":{
+            "type":"Line",
+            "step":false,
+            "smooth":false,
+            "showSymbol":false,
+            "showXAxis":true,
+            "showYAxis":true
+          },
+          "widget":{
+            "title":"Documents Rate (All Shards)"

Review Comment:
   I want to express the rate at which documents are created per minute.  Could you suggest a better way to express it?


--
This is an automated message from the Apache Git Service.
To respond to the message, please log on to GitHub and use the
URL above to go to the specific comment.

To unsubscribe, e-mail: notifications-unsubscribe@skywalking.apache.org

For queries about this service, please contact Infrastructure at:
users@infra.apache.org
[GitHub] [skywalking] wu-sheng commented on pull request #10690: Support Elasticsearch monitoring
Posted by "wu-sheng (via GitHub)" <gi...@apache.org>.
wu-sheng commented on PR #10690:
URL: https://github.com/apache/skywalking/pull/10690#issuecomment-1508331059

   Does index dashboard list physical indices rather than template, right?


--
This is an automated message from the Apache Git Service.
To respond to the message, please log on to GitHub and use the
URL above to go to the specific comment.

To unsubscribe, e-mail: notifications-unsubscribe@skywalking.apache.org

For queries about this service, please contact Infrastructure at:
users@infra.apache.org
[GitHub] [skywalking] innerpeacez commented on a diff in pull request #10690: Support Elasticsearch monitoring
Posted by "innerpeacez (via GitHub)" <gi...@apache.org>.
innerpeacez commented on code in PR #10690:
URL: https://github.com/apache/skywalking/pull/10690#discussion_r1168104934


##########
oap-server/server-starter/src/main/resources/ui-initialized-templates/elasticsearch/elasticsearch-index.json:
##########
@@ -0,0 +1,674 @@
+/**
+ * Licensed to the Apache Software Foundation (ASF) under one or more
+ * contributor license agreements.  See the NOTICE file distributed with
+ * this work for additional information regarding copyright ownership.
+ * The ASF licenses this file to You under the Apache License, Version 2.0
+ * (the "License"); you may not use this file except in compliance with
+ * the License.  You may obtain a copy of the License at
+ *
+ *      http://www.apache.org/licenses/LICENSE-2.0
+ *
+ * Unless required by applicable law or agreed to in writing, software
+ * distributed under the License is distributed on an "AS IS" BASIS,
+ * WITHOUT WARRANTIES OR CONDITIONS OF ANY KIND, either express or implied.
+ * See the License for the specific language governing permissions and
+ * limitations under the License.
+ */
+[
+  {
+    "id": "Elasticsearch-Index",
+    "configuration": {
+      "children":[
+        {
+          "x":0,
+          "y":6,
+          "w":12,
+          "h":13,
+          "i":"0",
+          "type":"Widget",
+          "id":"0",
+          "metricTypes":[
+            "readMetricsValues",
+            "readMetricsValues"
+          ],
+          "metrics":[
+            "meter_elasticsearch_index_stats_indexing_index_total_req_rate",
+            "meter_elasticsearch_index_stats_indexing_index_total_proc_rate"
+          ],
+          "moved":false,
+          "graph":{
+            "type":"Line",
+            "step":false,
+            "smooth":false,
+            "showSymbol":false,
+            "showXAxis":true,
+            "showYAxis":true
+          },
+          "widget":{
+            "title":"Indexing rate"
+          }
+        },
+        {
+          "x":12,
+          "y":6,
+          "w":12,
+          "h":13,
+          "i":"1",
+          "type":"Widget",
+          "id":"1",
+          "metricTypes":[
+            "readMetricsValues",
+            "readMetricsValues"
+          ],
+          "metrics":[
+            "meter_elasticsearch_index_stats_search_query_total_req_rate",
+            "meter_elasticsearch_index_stats_search_query_total_proc_rate"
+          ],
+          "moved":false,
+          "graph":{
+            "type":"Line",
+            "step":false,
+            "smooth":false,
+            "showSymbol":false,

Review Comment:
   I can extract the UI template data from Elasticsearch after re-save,  copy it to the JSON file, so that I can manually modify it to avoid any possible mistakes. Because I am not very clear about how to write this json file.


--
This is an automated message from the Apache Git Service.
To respond to the message, please log on to GitHub and use the
URL above to go to the specific comment.

To unsubscribe, e-mail: notifications-unsubscribe@skywalking.apache.org

For queries about this service, please contact Infrastructure at:
users@infra.apache.org
[GitHub] [skywalking] wu-sheng commented on a diff in pull request #10690: Support Elasticsearch monitoring
Posted by "wu-sheng (via GitHub)" <gi...@apache.org>.
wu-sheng commented on code in PR #10690:
URL: https://github.com/apache/skywalking/pull/10690#discussion_r1168343909
##########
oap-server/server-starter/src/main/resources/ui-initialized-templates/elasticsearch/elasticsearch-node.json:
##########
@@ -0,0 +1,1067 @@
+/**
+ * Licensed to the Apache Software Foundation (ASF) under one or more
+ * contributor license agreements. See the NOTICE file distributed with
+ * this work for additional information regarding copyright ownership.
+ * The ASF licenses this file to You under the Apache License, Version 2.0
+ * (the "License"); you may not use this file except in compliance with
+ * the License. You may obtain a copy of the License at
+ *
+ * http://www.apache.org/licenses/LICENSE-2.0
+ *
+ * Unless required by applicable law or agreed to in writing, software
+ * distributed under the License is distributed on an "AS IS" BASIS,
+ * WITHOUT WARRANTIES OR CONDITIONS OF ANY KIND, either express or implied.
+ * See the License for the specific language governing permissions and
+ * limitations under the License.
+ */
+[
+ {
+ "id": "Elasticsearch-Node",
+ "configuration": {
+ "children":[
+ {
+ "x":0,
+ "y":7,
+ "w":8,
+ "h":13,
+ "i":"0",
+ "type":"Widget",
+ "id":"0",
+ "metricTypes":[
+ "readMetricsValues"
+ ],
+ "metrics":[
+ "meter_elasticsearch_node_process_cpu_percent"
+ ],
+ "moved":false,
+ "graph":{
+ "type":"Line",
+ "step":false,
+ "smooth":false,
+ "showSymbol":true,
+ "showXAxis":true,
+ "showYAxis":true,
+ "legend":{
+ "show":true
+ }
+ },
+ "widget":{
+ "title":"Process CPU Usage Percent (%)"
+ }
+ },
+ {
+ "x":16,
+ "y":7,
+ "w":8,
+ "h":13,
+ "i":"1",
+ "type":"Widget",
+ "id":"1",
+ "metricTypes":[
+ "readMetricsValues",
+ "readMetricsValues",
+ "readMetricsValues"
+ ],
+ "metrics":[
+ "meter_elasticsearch_node_os_load1",
+ "meter_elasticsearch_node_os_load5",
+ "meter_elasticsearch_node_os_load15"
+ ],
+ "moved":false,
+ "graph":{
+ "type":"Line",
+ "step":false,
+ "smooth":false,
+ "showSymbol":true,
+ "showXAxis":true,
+ "showYAxis":true
+ },
+ "widget":{
+ "title":"Load Average"
+ },
+ "metricConfig":[
+ {
+ "calculation":"percentage"
+ },
+ {
+ "calculation":"percentage"
+ },
+ {
+ "calculation":"percentage"
+ }
+ ]
+ },
+ {
+ "x":0,
+ "y":20,
+ "w":6,
+ "h":13,
+ "i":"2",
+ "type":"Widget",
+ "id":"2",
+ "metricTypes":[
+ "readMetricsValues",
+ "readMetricsValues",
+ "readMetricsValues"
+ ],
+ "metrics":[
+ "meter_elasticsearch_node_jvm_memory_heap_used",
+ "meter_elasticsearch_node_jvm_memory_heap_max",
+ "meter_elasticsearch_node_jvm_memory_nonheap_used"
+ ],
+ "moved":false,
+ "graph":{
+ "type":"Area",
+ "opacity":0.4,
+ "showXAxis":true,
+ "showYAxis":true
+ },
+ "metricConfig":[
+ {
+ "calculation":"byteToMB"
+ },
+ {
+ "calculation":"byteToMB"
+ },
+ {
+ "calculation":"byteToMB"
+ }
+ ],
+ "widget":{
+ "title":"JVM Memory Usage (MB)"
+ }
+ },
+ {
+ "x":6,
+ "y":20,
+ "w":6,
+ "h":13,
+ "i":"3",
+ "type":"Widget",
+ "id":"3",
+ "metricTypes":[
+ "readLabeledMetricsValues"
+ ],
+ "metrics":[
+ "meter_elasticsearch_node_jvm_memory_pool_peak_used"
+ ],
+ "moved":false,
+ "graph":{
+ "type":"Area",
+ "opacity":0.4,
+ "showXAxis":true,
+ "showYAxis":true
+ },
+ "widget":{
+ "title":"JVM Pool Peak Used (MB)"
+ },
+ "metricConfig":[
+ {
+ "calculation":"byteToMB"
+ }
+ ],
+ "relatedTrace":{
+ "refIdType":"none"
+ }
+ },
+ {
+ "x":12,
+ "y":20,
+ "w":6,
+ "h":13,
+ "i":"4",
+ "type":"Widget",
+ "id":"4",
+ "metricTypes":[
+ "readLabeledMetricsValues"
+ ],
+ "metrics":[
+ "meter_elasticsearch_node_jvm_gc_count"
+ ],
+ "moved":false,
+ "graph":{
+ "type":"Bar",
+ "showBackground":true
+ },
+ "widget":{
+ "title":"GC Count"
+ }
+ },
+ {
+ "x":18,
+ "y":20,
+ "w":6,
+ "h":13,
+ "i":"5",
+ "type":"Widget",
+ "id":"5",
+ "metricTypes":[
+ "readLabeledMetricsValues"
+ ],
+ "metrics":[
+ "meter_elasticsearch_node_jvm_gc_time"
+ ],
+ "moved":false,
+ "graph":{
+ "type":"Line",
+ "step":false,
+ "smooth":false,
+ "showSymbol":true,
+ "showXAxis":true,
+ "showYAxis":true
+ },
+ "widget":{
+ "title":"GC Time (ms/min)"
+ },
+ "metricConfig":[
+ {
+ "calculation":""
+ }
+ ]
+ },
+ {
+ "x":0,
+ "y":33,
+ "w":8,
+ "h":13,
+ "i":"6",
+ "type":"Widget",
+ "id":"6",
+ "metricTypes":[
+ "readMetricsValues",
+ "readMetricsValues",
+ "readMetricsValues",
+ "readMetricsValues",
+ "readMetricsValues",
+ "readMetricsValues",
+ "readMetricsValues",
+ "readMetricsValues",
+ "readMetricsValues",
+ "readMetricsValues",
+ "readMetricsValues",
+ "readMetricsValues"
+ ],
+ "metrics":[
+ "meter_elasticsearch_node_indices_indexing_index_total_req_rate",
+ "meter_elasticsearch_node_indices_search_query_total_req_rate",
+ "meter_elasticsearch_node_indices_search_fetch_total_req_rate",
+ "meter_elasticsearch_node_indices_merges_total_req_rate",
+ "meter_elasticsearch_node_indices_refresh_total_req_rate",
+ "meter_elasticsearch_node_indices_flush_total_req_rate",
+ "meter_elasticsearch_node_indices_get_exists_total_req_rate",
+ "meter_elasticsearch_node_indices_get_missing_total_req_rate",
+ "meter_elasticsearch_node_indices_get_total_req_rate",
+ "meter_elasticsearch_node_indices_indexing_delete_total_req_rate",
+ "meter_elasticsearch_node_indices_search_scroll_total_req_rate",
+ "meter_elasticsearch_node_indices_search_suggest_total_req_rate"
+ ],
+ "moved":false,
+ "graph":{
+ "type":"Line",
+ "step":false,
+ "smooth":false,
+ "showSymbol":true,
+ "showXAxis":true,
+ "showYAxis":true
+ },
+ "widget":{
+ "title":"All Operations ReqRate"
+ },
+ "metricConfig":[
+
+ ]
+ },
+ {
+ "x":16,
+ "y":33,
+ "w":8,
+ "h":13,
+ "i":"7",
+ "type":"Widget",
+ "id":"7",
+ "metricTypes":[
+ "readMetricsValues",
+ "readMetricsValues"
+ ],
+ "metrics":[
+ "meter_elasticsearch_node_indices_search_query_time_seconds_proc_rate",
+ "meter_elasticsearch_node_indices_search_query_total_req_rate"
+ ],
+ "moved":false,
+ "graph":{
+ "type":"Line",
+ "step":false,
+ "smooth":false,
+ "showSymbol":true,
+ "showXAxis":true,
+ "showYAxis":true
+ },
+ "widget":{
+ "title":"Searching Rate",
+ "tips":"`ProcRate`: processing ability, which is the number of requests that Elasticsearch can handle. Estimation is based on the processed requests and processed time for these requests."
+ },
+ "metricConfig":[
+
+ ]
+ },
+ {
+ "x":0,
+ "y":46,
+ "w":6,
+ "h":13,
+ "i":"9",
+ "type":"Widget",
+ "id":"9",
+ "metricTypes":[
+ "readMetricsValues"
+ ],
+ "metrics":[
+ "meter_elasticsearch_node_indices_translog_operations"
+ ],
+ "moved":false,
+ "graph":{
+ "type":"Line",
+ "step":false,
+ "smooth":false,
+ "showSymbol":true,
+ "showXAxis":true,
+ "showYAxis":true
+ },
+ "widget":{
+ "title":"Total Translog Operations"
+ }
+ },
+ {
+ "x":6,
+ "y":46,
+ "w":6,
+ "h":13,
+ "i":"10",
+ "type":"Widget",
+ "id":"10",
+ "metricTypes":[
+ "readMetricsValues"
+ ],
+ "metrics":[
+ "meter_elasticsearch_node_indices_translog_size"
+ ],
+ "moved":false,
+ "graph":{
+ "type":"Line",
+ "step":false,
+ "smooth":false,
+ "showSymbol":true,
+ "showXAxis":true,
+ "showYAxis":true
+ },
+ "widget":{
+ "title":"Total Translog Size (MB)"
+ },
+ "metricConfig":[
+ {
+ "calculation":"byteToMB"
+ }
+ ]
+ },
+ {
+ "x":12,
+ "y":46,
+ "w":6,
+ "h":13,
+ "i":"11",
+ "type":"Widget",
+ "id":"11",
+ "metricTypes":[
+ "readLabeledMetricsValues"
+ ],
+ "metrics":[
+ "meter_elasticsearch_node_breakers_tripped"
+ ],
+ "moved":false,
+ "graph":{
+ "type":"Line",
+ "step":false,
+ "smooth":false,
+ "showSymbol":true,
+ "showXAxis":true,
+ "showYAxis":true
+ },
+ "widget":{
+ "title":"Tripped For Breakers"
+ }
+ },
+ {
+ "x":18,
+ "y":46,
+ "w":6,
+ "h":13,
+ "i":"12",
+ "type":"Widget",
+ "id":"12",
+ "metricTypes":[
+ "readLabeledMetricsValues"
+ ],
+ "metrics":[
+ "meter_elasticsearch_node_breakers_estimated_size"
+ ],
+ "moved":false,
+ "graph":{
+ "type":"Line",
+ "step":false,
+ "smooth":false,
+ "showSymbol":true,
+ "showXAxis":true,
+ "showYAxis":true
+ },
+ "metricConfig":[
+ {
+ "calculation":"byteToMB"
+ }
+ ],
+ "widget":{
+ "title":"Estimated Size Of Breaker (MB)"
+ }
+ },
+ {
+ "x":8,
+ "y":86,
+ "w":8,
+ "h":13,
+ "i":"13",
+ "type":"Widget",
+ "id":"13",
+ "metricTypes":[
+ "readMetricsValues"
+ ],
+ "metrics":[
+ "meter_elasticsearch_node_segment_memory"
+ ],
+ "moved":false,
+ "graph":{
+ "type":"Line",
+ "step":false,
+ "smooth":false,
+ "showSymbol":true,
+ "showXAxis":true,
+ "showYAxis":true
+ },
+ "metricConfig":[
+ {
+ "calculation":"byteToMB"
+ }
+ ],
+ "widget":{
+ "title":"Current Memory Size Of Segments (MB)"
+ }
+ },
+ {
+ "x":0,
+ "y":99,
+ "w":6,
+ "h":14,
+ "i":"14",
+ "type":"Widget",
+ "id":"14",
+ "metricTypes":[
+ "readLabeledMetricsValues"
+ ],
+ "metrics":[
+ "meter_elasticsearch_node_disk_usage_percent"
+ ],
+ "moved":false,
+ "graph":{
+ "type":"Line",
+ "step":false,
+ "smooth":false,
+ "showSymbol":true,
+ "showXAxis":true,
+ "showYAxis":true,
+ "legend":{
+ "show":true
+ }
+ },
+ "widget":{
+ "title":"Disk Usage Percent (%)"
+ },
+ "metricConfig":[
+ {
+ "calculation":""
+ }
+ ]
+ },
+ {
+ "x":0,
+ "y":59,
+ "w":8,
+ "h":13,
+ "i":"15",
+ "type":"Widget",
+ "id":"15",
+ "metricTypes":[
+ "readMetricsValues"
+ ],
+ "metrics":[
+ "meter_elasticsearch_node_indices_docs"
+ ],
+ "moved":false,
+ "graph":{
+ "type":"Line",
+ "step":false,
+ "smooth":false,
+ "showSymbol":true,
+ "showXAxis":true,
+ "showYAxis":true
+ },
+ "metricConfig":[
+
+ ],
+ "widget":{
+ "title":"Documents Count"
+ }
+ },
+ {
+ "x":0,
+ "y":86,
+ "w":8,
+ "h":13,
+ "i":"16",
+ "type":"Widget",
+ "id":"16",
+ "metricTypes":[
+ "readMetricsValues"
+ ],
+ "metrics":[
+ "meter_elasticsearch_node_segment_count"
+ ],
+ "moved":false,
+ "graph":{
+ "type":"Bar",
+ "showBackground":true
+ },
+ "widget":{
+ "title":"Count Of Index Segments"
+ }
+ },
+ {
+ "x":0,
+ "y":0,
+ "w":6,
+ "h":7,
+ "i":"17",
+ "type":"Widget",
+ "id":"17",
+ "metricTypes":[
+ "readLabeledMetricsValues"
+ ],
+ "metrics":[
+ "meter_elasticsearch_node_rules"
+ ],
+ "moved":false,
+ "graph":{
+ "type":"Table",
+ "showTableValues":false,
+ "tableHeaderCol1":"Client-Data-Ingest-Master",
+ "tableHeaderCol2":""
+ },
+ "widget":{
+ "title":"Node Rules"
+ }
+ },
+ {
+ "x":12,
+ "y":0,
+ "w":3,
+ "h":7,
+ "i":"18",
+ "type":"Widget",
+ "id":"18",
+ "metricTypes":[
+ "readMetricsValues"
+ ],
+ "metrics":[
+ "meter_elasticsearch_node_indices_docs"
+ ],
+ "moved":false,
+ "graph":{
+ "type":"Card",
+ "fontSize":14,
+ "textAlign":"center",
+ "showUnit":true
+ },
+ "widget":{
+ "title":"Documents"
+ }
+ },
+ {
+ "x":8,
+ "y":7,
+ "w":8,
+ "h":13,
+ "i":"26",
+ "type":"Widget",
+ "id":"26",
+ "metricTypes":[
+ "readMetricsValues"
+ ],
+ "metrics":[
+ "meter_elasticsearch_node_os_cpu_percent"
+ ],
+ "moved":false,
+ "graph":{
+ "type":"Line",
+ "step":false,
+ "smooth":false,
+ "showSymbol":true,
+ "showXAxis":true,
+ "showYAxis":true,
+ "legend":{
+ "show":true
+ }
+ },
+ "widget":{
+ "title":"OS CPU Usage Persent (%)"
+ }
+ },
+ {
+ "x":6,
+ "y":99,
+ "w":6,
+ "h":14,
+ "i":"27",
+ "type":"Widget",
+ "id":"27",
+ "metricTypes":[
+ "readLabeledMetricsValues"
+ ],
+ "metrics":[
+ "meter_elasticsearch_node_disk_usage"
+ ],
+ "moved":false,
+ "graph":{
+ "type":"Line",
+ "step":false,
+ "smooth":false,
+ "showSymbol":true,
+ "showXAxis":true,
+ "showYAxis":true,
+ "legend":{
+ "show":true
+ }
+ },
+ "metricConfig":[
+ {
+ "calculation":"byteToGB"
+ }
+ ],
+ "widget":{
+ "title":"Disk Usage (GB)"
+ }
+ },
+ {
+ "x":16,
+ "y":86,
+ "w":8,
+ "h":13,
+ "i":"28",
+ "type":"Widget",
+ "id":"28",
+ "metricTypes":[
+ "readMetricsValues",
+ "readMetricsValues"
+ ],
+ "metrics":[
+ "meter_elasticsearch_node_network_send_bytes",
+ "meter_elasticsearch_node_network_receive_bytes"
+ ],
+ "moved":false,
+ "graph":{
+ "type":"Line",
+ "step":false,
+ "smooth":false,
+ "showSymbol":true,
+ "showXAxis":true,
+ "showYAxis":true,
+ "legend":{
+ "show":true
+ }
+ },
+ "widget":{
+ "title":"Network (bytes/sec)"
+ }
+ },
+ {
+ "x":12,
+ "y":99,
+ "w":6,
+ "h":14,
+ "i":"29",
+ "type":"Widget",
+ "id":"29",
+ "metricTypes":[
+ "readLabeledMetricsValues"
+ ],
+ "metrics":[
+ "meter_elasticsearch_node_disk_io_read_bytes"
+ ],
+ "moved":false,
+ "graph":{
+ "type":"Line",
+ "step":false,
+ "smooth":false,
+ "showSymbol":true,
+ "showXAxis":true,
+ "showYAxis":true
+ },
+ "widget":{
+ "title":"Disk Read (KBs)"
+ },
+ "metricConfig":[
+ {
+ "unit":"kb"
+ }
+ ]
+ },
+ {
+ "x":15,
+ "y":0,
+ "w":3,
+ "h":7,
+ "i":"30",
+ "type":"Widget",
+ "id":"30",
+ "metricTypes":[
+ "readMetricsValues"
+ ],
+ "metrics":[
+ "meter_elasticsearch_node_segment_count"
+ ],
+ "moved":false,
+ "graph":{
+ "type":"Card",
+ "fontSize":14,
+ "textAlign":"center",
+ "showUnit":true
+ },
+ "widget":{
+ "title":"Segments"
+ }
+ },
+ {
+ "x":21,
+ "y":0,
+ "w":3,
+ "h":7,
+ "i":"31",
+ "type":"Widget",
+ "id":"31",
+ "metricTypes":[
+ "readMetricsValues"
+ ],
+ "metrics":[
+ "meter_elasticsearch_node_open_file_count"
+ ],
+ "moved":false,
+ "graph":{
+ "type":"Card",
+ "fontSize":14,
+ "textAlign":"center",
+ "showUnit":true
+ },
+ "widget":{
+ "title":"Open Files"
+ }
+ },
+ {
+ "x":18,
+ "y":99,
+ "w":6,
+ "h":14,
+ "i":"32",
+ "type":"Widget",
+ "id":"32",
+ "metricTypes":[
+ "readLabeledMetricsValues"
+ ],
+ "metrics":[
+ "meter_elasticsearch_node_disk_io_write_bytes"
+ ],
+ "moved":false,
+ "graph":{
+ "type":"Line",
+ "step":false,
+ "smooth":false,
+ "showSymbol":true,
+ "showXAxis":true,
+ "showYAxis":true,
+ "legend":{
+ "show":true
+ }
+ },
+ "widget":{
+ "title":"Disk Write (KBs)"
+ }
+ },
+ {
+ "x":6,
+ "y":0,
+ "w":3,
+ "h":7,
+ "i":"33",
+ "type":"Widget",
+ "id":"33",
+ "metricTypes":[
+ "readMetricsValue"
+ ],
+ "metrics":[
+ "meter_elasticsearch_node_jvm_memory_used"
+ ],
+ "moved":false,
+ "graph":{
+ "type":"Card",
+ "fontSize":14,
+ "textAlign":"center",
+ "showUnit":true
+ },
+ "metricConfig":[
+ {
+ "calculation":"byteToMB"
+ }
+ ],
+ "widget":{
+ "title":"JVM Memory Used (MB)"
+ }
+ },
+ {
+ "x":9,
+ "y":0,
+ "w":3,
+ "h":7,
+ "i":"34",
+ "type":"Widget",
+ "id":"34",
+ "metricTypes":[
+ "readMetricsValue"
+ ],
+ "metrics":[
+ "meter_elasticsearch_node_process_cpu_percent"
+ ],
+ "moved":false,
+ "graph":{
+ "type":"Card",
+ "fontSize":14,
+ "textAlign":"center",
+ "showUnit":true
+ },
+ "widget":{
+ "title":"CPU Percent (%)"
Review Comment:
```suggestion
"title":"CPU Usage (%)"
```
--
This is an automated message from the Apache Git Service.
To respond to the message, please log on to GitHub and use the
URL above to go to the specific comment.
To unsubscribe, e-mail: notifications-unsubscribe@skywalking.apache.org
For queries about this service, please contact Infrastructure at:
users@infra.apache.org
[GitHub] [skywalking] wu-sheng commented on pull request #10690: Support Elasticsearch monitoring
Posted by "wu-sheng (via GitHub)" <gi...@apache.org>.
wu-sheng commented on PR #10690:
URL: https://github.com/apache/skywalking/pull/10690#issuecomment-1512558512

   @innerpeacez Do you have issues running e2e locally? I noticed you are adding tests step-by-step verified by CI directly, which costs a little more.


--
This is an automated message from the Apache Git Service.
To respond to the message, please log on to GitHub and use the
URL above to go to the specific comment.

To unsubscribe, e-mail: notifications-unsubscribe@skywalking.apache.org

For queries about this service, please contact Infrastructure at:
users@infra.apache.org
[GitHub] [skywalking] wu-sheng commented on a diff in pull request #10690: Support Elasticsearch monitoring
Posted by "wu-sheng (via GitHub)" <gi...@apache.org>.
wu-sheng commented on code in PR #10690:
URL: https://github.com/apache/skywalking/pull/10690#discussion_r1167923074


##########
docs/en/setup/backend/backend-elasticsearch-monitoring.md:
##########
@@ -0,0 +1,118 @@
+# Elasticsearch monitoring
+
+SkyWalking leverages elasticsearch-exporter for collecting metrics data from Elasticsearch. It leverages OpenTelemetry
+Collector to transfer the metrics to
+[OpenTelemetry receiver](opentelemetry-receiver.md) and into the [Meter System](./../../concepts-and-designs/meter.md).
+
+## Data flow
+
+1. The elasticsearch-exporter collect metrics data from Elasticsearch.
+2. OpenTelemetry Collector fetches metrics from elasticsearch-exporter via Prometheus Receiver and pushes metrics to
+   SkyWalking OAP Server via OpenTelemetry gRPC exporter.
+3. The SkyWalking OAP Server parses the expression with [MAL](../../concepts-and-designs/mal.md) to
+   filter/calculate/aggregate and store the results.
+
+## Setup
+
+1. Setup [elasticsearch-exporter](https://github.com/prometheus-community/elasticsearch_exporter).
+2. Set up [OpenTelemetry Collector ](https://opentelemetry.io/docs/collector/getting-started/#kubernetes). For details
+   on Redis Receiver in OpenTelemetry Collector, refer
+   to [here](../../../../test/e2e-v2/cases/elasticsearch/otel-collector-config.yaml).
+3. Config SkyWalking [OpenTelemetry receiver](opentelemetry-receiver.md).
+
+## Elasticsearch Monitoring
+
+Elasticsearch monitoring provides multidimensional metrics monitoring, such as cluster, node, and index.
+
+Elasticsearch cluster as a `Service` in OAP, Elasticsearch node as an `Instance` in OAP, Elasticsearch Index as an `Endpoint` in OAP, and land on the `Layer: Elasticsearch`.

Review Comment:
   ```suggestion
   Elasticsearch monitoring provides multidimensional metrics monitoring of Elasticsearch clusters as `Layer: ELASTICSEARCH` `Service` in the OAP. In each cluster, the nodes are represented as `Instance` and indices are `Endpoint`s.
   ```


--
This is an automated message from the Apache Git Service.
To respond to the message, please log on to GitHub and use the
URL above to go to the specific comment.

To unsubscribe, e-mail: notifications-unsubscribe@skywalking.apache.org

For queries about this service, please contact Infrastructure at:
users@infra.apache.org
[GitHub] [skywalking] wu-sheng commented on a diff in pull request #10690: Support Elasticsearch monitoring
Posted by "wu-sheng (via GitHub)" <gi...@apache.org>.
wu-sheng commented on code in PR #10690:
URL: https://github.com/apache/skywalking/pull/10690#discussion_r1168061275


##########
oap-server/server-starter/src/main/resources/ui-initialized-templates/elasticsearch/elasticsearch-index.json:
##########
@@ -0,0 +1,674 @@
+/**
+ * Licensed to the Apache Software Foundation (ASF) under one or more
+ * contributor license agreements.  See the NOTICE file distributed with
+ * this work for additional information regarding copyright ownership.
+ * The ASF licenses this file to You under the Apache License, Version 2.0
+ * (the "License"); you may not use this file except in compliance with
+ * the License.  You may obtain a copy of the License at
+ *
+ *      http://www.apache.org/licenses/LICENSE-2.0
+ *
+ * Unless required by applicable law or agreed to in writing, software
+ * distributed under the License is distributed on an "AS IS" BASIS,
+ * WITHOUT WARRANTIES OR CONDITIONS OF ANY KIND, either express or implied.
+ * See the License for the specific language governing permissions and
+ * limitations under the License.
+ */
+[
+  {
+    "id": "Elasticsearch-Index",
+    "configuration": {
+      "children":[
+        {
+          "x":0,
+          "y":6,
+          "w":12,
+          "h":13,
+          "i":"0",
+          "type":"Widget",
+          "id":"0",
+          "metricTypes":[
+            "readMetricsValues",
+            "readMetricsValues"
+          ],
+          "metrics":[
+            "meter_elasticsearch_index_stats_indexing_index_total_req_rate",
+            "meter_elasticsearch_index_stats_indexing_index_total_proc_rate"
+          ],
+          "moved":false,
+          "graph":{
+            "type":"Line",
+            "step":false,
+            "smooth":false,
+            "showSymbol":false,
+            "showXAxis":true,
+            "showYAxis":true
+          },
+          "widget":{
+            "title":"Indexing rate"
+          }
+        },
+        {
+          "x":12,
+          "y":6,
+          "w":12,
+          "h":13,
+          "i":"1",
+          "type":"Widget",
+          "id":"1",
+          "metricTypes":[
+            "readMetricsValues",
+            "readMetricsValues"
+          ],
+          "metrics":[
+            "meter_elasticsearch_index_stats_search_query_total_req_rate",
+            "meter_elasticsearch_index_stats_search_query_total_proc_rate"
+          ],
+          "moved":false,
+          "graph":{
+            "type":"Line",
+            "step":false,
+            "smooth":false,
+            "showSymbol":false,
+            "showXAxis":true,
+            "showYAxis":true
+          },
+          "widget":{
+            "title":"Searching rate"
+          }
+        },
+        {
+          "x":0,
+          "y":19,
+          "w":12,
+          "h":16,
+          "i":"2",
+          "type":"Widget",
+          "id":"2",
+          "metricTypes":[
+            "readMetricsValues",
+            "readMetricsValues",
+            "readMetricsValues",
+            "readMetricsValues",
+            "readMetricsValues",
+            "readMetricsValues",
+            "readMetricsValues",
+            "readMetricsValues",
+            "readMetricsValues",
+            "readMetricsValues",
+            "readMetricsValues"
+          ],
+          "metrics":[
+            "meter_elasticsearch_index_stats_merge_total_req_rate",
+            "meter_elasticsearch_index_stats_flush_total_req_rate",
+            "meter_elasticsearch_index_stats_refresh_total_req_rate",
+            "meter_elasticsearch_index_stats_warmer_total_req_rate",
+            "meter_elasticsearch_index_stats_indexing_delete_total_req_rate",
+            "meter_elasticsearch_index_stats_search_fetch_total_req_rate",
+            "meter_elasticsearch_index_stats_search_query_total_req_rate",
+            "meter_elasticsearch_index_stats_search_scroll_total_req_rate",
+            "meter_elasticsearch_index_stats_search_suggest_total_req_rate",
+            "meter_elasticsearch_index_stats_indexing_index_total_req_rate",
+            "meter_elasticsearch_index_stats_get_total_req_rate"
+          ],
+          "moved":false,
+          "graph":{
+            "type":"Line",
+            "step":false,
+            "smooth":false,
+            "showSymbol":false,
+            "showXAxis":true,
+            "showYAxis":true
+          },
+          "widget":{
+            "title":"All Operations ReqRate"
+          }
+        },
+        {
+          "x":12,
+          "y":19,
+          "w":12,
+          "h":16,
+          "i":"3",
+          "type":"Widget",
+          "id":"3",
+          "metricTypes":[
+            "readMetricsValues",
+            "readMetricsValues",
+            "readMetricsValues",
+            "readMetricsValues",
+            "readMetricsValues",
+            "readMetricsValues",
+            "readMetricsValues",
+            "readMetricsValues",
+            "readMetricsValues",
+            "readMetricsValues",
+            "readMetricsValues",
+            "readMetricsValues",
+            "readMetricsValues",
+            "readMetricsValues"
+          ],
+          "metrics":[
+            "meter_elasticsearch_index_stats_merge_time_seconds_total",
+            "meter_elasticsearch_index_stats_flush_time_seconds_total",
+            "meter_elasticsearch_index_stats_refresh_time_seconds_total",
+            "meter_elasticsearch_index_stats_warmer_time_seconds_total",
+            "meter_elasticsearch_index_stats_indexing_delete_time_seconds_total",
+            "meter_elasticsearch_index_stats_search_fetch_time_seconds_total",
+            "meter_elasticsearch_index_stats_search_query_time_seconds_total",
+            "meter_elasticsearch_index_stats_search_scroll_time_seconds_total",
+            "meter_elasticsearch_index_stats_search_suggest_time_seconds_total",
+            "meter_elasticsearch_index_stats_indexing_index_time_seconds_total",
+            "meter_elasticsearch_index_stats_get_time_seconds_total",
+            "meter_elasticsearch_index_stats_merge_stopped_time_seconds_total",
+            "meter_elasticsearch_index_stats_merge_throttle_time_seconds_total",
+            "meter_elasticsearch_index_stats_indexing_throttle_time_seconds_total"
+          ],
+          "moved":false,
+          "graph":{
+            "type":"Line",
+            "step":false,
+            "smooth":false,
+            "showSymbol":false,
+            "showXAxis":true,
+            "showYAxis":true
+          },
+          "widget":{
+            "title":"All Operations Runtime/s"
+          }
+        },
+        {
+          "x":0,
+          "y":35,
+          "w":8,
+          "h":13,
+          "i":"4",
+          "type":"Widget",
+          "id":"4",
+          "metricTypes":[
+            "readMetricsValues",
+            "readMetricsValues",
+            "readMetricsValues",
+            "readMetricsValues"
+          ],
+          "metrics":[
+            "meter_elasticsearch_index_search_fetch_avg_time",
+            "meter_elasticsearch_index_search_query_avg_time",
+            "meter_elasticsearch_index_search_scroll_avg_time",
+            "meter_elasticsearch_index_search_suggest_avg_time"
+          ],
+          "moved":false,
+          "graph":{
+            "type":"Line",
+            "step":false,
+            "smooth":false,
+            "showSymbol":false,
+            "showXAxis":true,
+            "showYAxis":true
+          },
+          "widget":{
+            "title":"Avg. Search Time Execute / Request (s)"
+          }
+        },
+        {
+          "x":8,
+          "y":35,
+          "w":8,
+          "h":13,
+          "i":"5",
+          "type":"Widget",
+          "id":"5",
+          "metricTypes":[
+            "readMetricsValues",
+            "readMetricsValues",
+            "readMetricsValues",
+            "readMetricsValues"
+          ],
+          "metrics":[
+            "meter_elasticsearch_index_stats_search_fetch_total_req_rate",
+            "meter_elasticsearch_index_stats_search_query_total_req_rate",
+            "meter_elasticsearch_index_stats_search_scroll_total_req_rate",
+            "meter_elasticsearch_index_stats_search_suggest_total_req_rate"
+          ],
+          "moved":false,
+          "graph":{
+            "type":"Line",
+            "step":false,
+            "smooth":false,
+            "showSymbol":false,
+            "showXAxis":true,
+            "showYAxis":true
+          },
+          "metricConfig":[
+
+          ],
+          "widget":{
+            "title":"Search Operations  Rate (req/s)"
+          }
+        },
+        {
+          "x":16,
+          "y":59,
+          "w":8,
+          "h":11,
+          "i":"6",
+          "type":"Widget",
+          "id":"6",
+          "metricTypes":[
+            "readMetricsValues"
+          ],
+          "metrics":[
+            "meter_elasticsearch_index_indices_store_size_bytes_total"
+          ],
+          "moved":false,
+          "graph":{
+            "type":"Line",
+            "step":false,
+            "smooth":false,
+            "showSymbol":false,
+            "showXAxis":true,
+            "showYAxis":true
+          },
+          "widget":{
+            "title":"Total size of stored index data (All Shards)"
+          },
+          "metricConfig":[
+            {
+              "calculation":"byteToMB"
+            }
+          ]
+        },
+        {
+          "x":0,
+          "y":59,
+          "w":8,
+          "h":11,
+          "i":"7",
+          "type":"Widget",
+          "id":"7",
+          "metricTypes":[
+            "readMetricsValues"
+          ],
+          "metrics":[
+            "meter_elasticsearch_index_indices_docs_total"
+          ],
+          "moved":false,
+          "graph":{
+            "type":"Line",
+            "step":false,
+            "smooth":false,
+            "showSymbol":false,
+            "showXAxis":true,
+            "showYAxis":true
+          },
+          "widget":{
+            "title":"Documents (All Shards)"
+          }
+        },
+        {
+          "x":8,
+          "y":59,
+          "w":8,
+          "h":11,
+          "i":"8",
+          "type":"Widget",
+          "id":"8",
+          "metricTypes":[
+            "readMetricsValues"
+          ],
+          "metrics":[
+            "meter_elasticsearch_index_indices_docs_total_rate"
+          ],
+          "moved":false,
+          "graph":{
+            "type":"Line",
+            "step":false,
+            "smooth":false,
+            "showSymbol":false,
+            "showXAxis":true,
+            "showYAxis":true
+          },
+          "widget":{
+            "title":"Documents Rate (All Shards)"
+          }
+        },
+        {
+          "x":0,
+          "y":48,
+          "w":8,
+          "h":11,
+          "i":"9",
+          "type":"Widget",
+          "id":"9",
+          "metricTypes":[
+            "readMetricsValues"
+          ],
+          "metrics":[
+            "meter_elasticsearch_index_indices_docs_primary"
+          ],
+          "moved":false,
+          "graph":{
+            "type":"Line",
+            "step":false,
+            "smooth":false,
+            "showSymbol":false,
+            "showXAxis":true,
+            "showYAxis":true
+          },
+          "widget":{
+            "title":"Documents (Primary Shards)"
+          }
+        },
+        {
+          "x":8,
+          "y":48,
+          "w":8,
+          "h":11,
+          "i":"10",
+          "type":"Widget",
+          "id":"10",
+          "metricTypes":[
+            "readMetricsValues"
+          ],
+          "metrics":[
+            "meter_elasticsearch_index_indices_docs_primary_rate"
+          ],
+          "moved":false,
+          "graph":{
+            "type":"Line",
+            "step":false,
+            "smooth":false,
+            "showSymbol":false,
+            "showXAxis":true,
+            "showYAxis":true
+          },
+          "widget":{
+            "title":"Documents Rate (Primary Shards)"
+          }
+        },
+        {
+          "x":16,
+          "y":48,
+          "w":8,
+          "h":11,
+          "i":"11",
+          "type":"Widget",
+          "id":"11",
+          "metricTypes":[
+            "readMetricsValues"
+          ],
+          "metrics":[
+            "meter_elasticsearch_index_indices_store_size_bytes_primary"
+          ],
+          "moved":false,
+          "graph":{
+            "type":"Line",
+            "step":false,
+            "smooth":false,
+            "showSymbol":false,
+            "showXAxis":true,
+            "showYAxis":true
+          },
+          "metricConfig":[
+            {
+              "calculation":"byteToMB"
+            }
+          ],
+          "widget":{
+            "title":"Total size of stored index data (Primary Shards) (MB)"

Review Comment:
   ```suggestion
               "title":"Total size of indices (Primary Shards) (MB)"
   ```

   I don't think there is an index not stored.


--
This is an automated message from the Apache Git Service.
To respond to the message, please log on to GitHub and use the
URL above to go to the specific comment.

To unsubscribe, e-mail: notifications-unsubscribe@skywalking.apache.org

For queries about this service, please contact Infrastructure at:
users@infra.apache.org
[GitHub] [skywalking] wu-sheng commented on a diff in pull request #10690: Support Elasticsearch monitoring
Posted by "wu-sheng (via GitHub)" <gi...@apache.org>.
wu-sheng commented on code in PR #10690:
URL: https://github.com/apache/skywalking/pull/10690#discussion_r1168106493


##########
oap-server/server-starter/src/main/resources/ui-initialized-templates/elasticsearch/elasticsearch-index.json:
##########
@@ -0,0 +1,674 @@
+/**
+ * Licensed to the Apache Software Foundation (ASF) under one or more
+ * contributor license agreements.  See the NOTICE file distributed with
+ * this work for additional information regarding copyright ownership.
+ * The ASF licenses this file to You under the Apache License, Version 2.0
+ * (the "License"); you may not use this file except in compliance with
+ * the License.  You may obtain a copy of the License at
+ *
+ *      http://www.apache.org/licenses/LICENSE-2.0
+ *
+ * Unless required by applicable law or agreed to in writing, software
+ * distributed under the License is distributed on an "AS IS" BASIS,
+ * WITHOUT WARRANTIES OR CONDITIONS OF ANY KIND, either express or implied.
+ * See the License for the specific language governing permissions and
+ * limitations under the License.
+ */
+[
+  {
+    "id": "Elasticsearch-Index",
+    "configuration": {
+      "children":[
+        {
+          "x":0,
+          "y":6,
+          "w":12,
+          "h":13,
+          "i":"0",
+          "type":"Widget",
+          "id":"0",
+          "metricTypes":[
+            "readMetricsValues",
+            "readMetricsValues"
+          ],
+          "metrics":[
+            "meter_elasticsearch_index_stats_indexing_index_total_req_rate",
+            "meter_elasticsearch_index_stats_indexing_index_total_proc_rate"
+          ],
+          "moved":false,
+          "graph":{
+            "type":"Line",
+            "step":false,
+            "smooth":false,
+            "showSymbol":false,
+            "showXAxis":true,
+            "showYAxis":true
+          },
+          "widget":{
+            "title":"Indexing rate"
+          }
+        },
+        {
+          "x":12,
+          "y":6,
+          "w":12,
+          "h":13,
+          "i":"1",
+          "type":"Widget",
+          "id":"1",
+          "metricTypes":[
+            "readMetricsValues",
+            "readMetricsValues"
+          ],
+          "metrics":[
+            "meter_elasticsearch_index_stats_search_query_total_req_rate",
+            "meter_elasticsearch_index_stats_search_query_total_proc_rate"
+          ],
+          "moved":false,
+          "graph":{
+            "type":"Line",
+            "step":false,
+            "smooth":false,
+            "showSymbol":false,

Review Comment:
   I don't think it will work. You would see this attribute is not changed at all. The only three options are
   1. Re-config all things from a clean env using the new UI.
   2. Manually change configurations one by one using the new UI.
   3. Change the field value from `false` to `true` manually.


--
This is an automated message from the Apache Git Service.
To respond to the message, please log on to GitHub and use the
URL above to go to the specific comment.

To unsubscribe, e-mail: notifications-unsubscribe@skywalking.apache.org

For queries about this service, please contact Infrastructure at:
users@infra.apache.org
[GitHub] [skywalking] innerpeacez commented on a diff in pull request #10690: Support Elasticsearch monitoring
Posted by "innerpeacez (via GitHub)" <gi...@apache.org>.
innerpeacez commented on code in PR #10690:
URL: https://github.com/apache/skywalking/pull/10690#discussion_r1167960447


##########
oap-server/server-starter/src/main/resources/otel-rules/elasticsearch/elasticsearch-index.yaml:
##########
@@ -0,0 +1,127 @@
+# Licensed to the Apache Software Foundation (ASF) under one or more
+# contributor license agreements.  See the NOTICE file distributed with
+# this work for additional information regarding copyright ownership.
+# The ASF licenses this file to You under the Apache License, Version 2.0
+# (the "License"); you may not use this file except in compliance with
+# the License.  You may obtain a copy of the License at
+#
+#     http://www.apache.org/licenses/LICENSE-2.0
+#
+# Unless required by applicable law or agreed to in writing, software
+# distributed under the License is distributed on an "AS IS" BASIS,
+# WITHOUT WARRANTIES OR CONDITIONS OF ANY KIND, either express or implied.
+# See the License for the specific language governing permissions and
+# limitations under the License.
+
+# This will parse a textual representation of a duration. The formats
+# accepted are based on the ISO-8601 duration format {@code PnDTnHnMn.nS}
+# with days considered to be exactly 24 hours.
+# <p>
+# Examples:
+# <pre>
+#    "PT20.345S" -- parses as "20.345 seconds"
+#    "PT15M"     -- parses as "15 minutes" (where a minute is 60 seconds)
+#    "PT10H"     -- parses as "10 hours" (where an hour is 3600 seconds)
+#    "P2D"       -- parses as "2 days" (where a day is 24 hours or 86400 seconds)
+#    "P2DT3H4M"  -- parses as "2 days, 3 hours and 4 minutes"
+#    "P-6H3M"    -- parses as "-6 hours and +3 minutes"
+#    "-P6H3M"    -- parses as "-6 hours and -3 minutes"
+#    "-P-6H+3M"  -- parses as "+6 hours and -3 minutes"
+# </pre>
+filter: "{ tags -> tags.job_name == 'elasticsearch-monitoring' }" # The OpenTelemetry job name
+expSuffix: tag({tags -> tags.cluster = 'elasticsearch::' + tags.cluster}).endpoint(['cluster'], ['index'], Layer.ELASTICSEARCH)
+metricPrefix: meter_elasticsearch_index
+metricsRules:
+  - name: stats_indexing_index_total_req_rate
+    exp: elasticsearch_index_stats_indexing_index_total.sum(['cluster' , 'index']).rate('PT1M')

Review Comment:
   That's because the official documentation doesn't seem to be maintained up to date.


--
This is an automated message from the Apache Git Service.
To respond to the message, please log on to GitHub and use the
URL above to go to the specific comment.

To unsubscribe, e-mail: notifications-unsubscribe@skywalking.apache.org

For queries about this service, please contact Infrastructure at:
users@infra.apache.org
[GitHub] [skywalking] innerpeacez commented on a diff in pull request #10690: Support Elasticsearch monitoring
Posted by "innerpeacez (via GitHub)" <gi...@apache.org>.
innerpeacez commented on code in PR #10690:
URL: https://github.com/apache/skywalking/pull/10690#discussion_r1167878602
##########
oap-server/server-starter/src/main/resources/ui-initialized-templates/elasticsearch/elasticsearch-cluster.json:
##########
@@ -0,0 +1,454 @@
+/**
+ * Licensed to the Apache Software Foundation (ASF) under one or more
+ * contributor license agreements. See the NOTICE file distributed with
+ * this work for additional information regarding copyright ownership.
+ * The ASF licenses this file to You under the Apache License, Version 2.0
+ * (the "License"); you may not use this file except in compliance with
+ * the License. You may obtain a copy of the License at
+ *
+ * http://www.apache.org/licenses/LICENSE-2.0
+ *
+ * Unless required by applicable law or agreed to in writing, software
+ * distributed under the License is distributed on an "AS IS" BASIS,
+ * WITHOUT WARRANTIES OR CONDITIONS OF ANY KIND, either express or implied.
+ * See the License for the specific language governing permissions and
+ * limitations under the License.
+ */
+[
+ {
+ "id": "Elasticsearch-Cluster",
+ "configuration": {
+ "children":[
+ {
+ "x":0,
+ "y":0,
+ "w":24,
+ "h":56,
+ "i":"0",
+ "type":"Tab",
+ "id":"0",
+ "metricTypes":[
+ ""
+ ],
+ "metrics":[
+ ""
+ ],
+ "activedTabIndex":0,
+ "children":[
+ {
+ "name":"Overview",
+ "children":[
+ {
+ "x":0,
+ "y":0,
+ "w":3,
+ "h":6,
+ "i":"0",
+ "type":"Widget",
+ "id":"0-0-0",
+ "metricTypes":[
+ "readLabeledMetricsValues"
+ ],
+ "metrics":[
+ "meter_elasticsearch_cluster_health_status"
+ ],
+ "moved":false,
+ "graph":{
+ "type":"Table",
+ "showTableValues":false,
+ "tableHeaderCol1":"status",
+ "tableHeaderCol2":""
+ },
+ "widget":{
+ "title":"Cluster health"
+ }
+ },
+ {
+ "x":15,
+ "y":0,
+ "w":3,
+ "h":6,
+ "i":"1",
+ "type":"Widget",
+ "id":"0-0-1",
+ "metricTypes":[
+ "readMetricsValue"
+ ],
+ "metrics":[
+ "meter_elasticsearch_cluster_nodes"
+ ],
+ "moved":false,
+ "graph":{
+ "type":"Card",
+ "fontSize":14,
+ "textAlign":"center",
+ "showUnit":true
+ },
+ "widget":{
+ "title":"Data nodes"
+ }
+ },
+ {
+ "x":12,
+ "y":0,
+ "w":3,
+ "h":6,
+ "i":"2",
+ "type":"Widget",
+ "id":"0-0-2",
+ "metricTypes":[
+ "readMetricsValue"
+ ],
+ "metrics":[
+ "meter_elasticsearch_cluster_nodes"
+ ],
+ "moved":false,
+ "graph":{
+ "type":"Card",
+ "fontSize":14,
+ "textAlign":"center",
+ "showUnit":true
+ },
+ "widget":{
+ "title":"Nodes"
+ }
+ },
+ {
+ "x":18,
+ "y":0,
+ "w":3,
+ "h":6,
+ "i":"3",
+ "type":"Widget",
+ "id":"0-0-3",
+ "metricTypes":[
+ "readMetricsValue"
+ ],
+ "metrics":[
+ "meter_elasticsearch_cluster_pending_tasks_total"
+ ],
+ "moved":false,
+ "graph":{
+ "type":"Card",
+ "fontSize":14,
+ "textAlign":"center",
+ "showUnit":true
+ },
+ "widget":{
+ "title":"Pending tasks"
+ }
+ },
+ {
+ "x":0,
+ "y":6,
+ "w":4,
+ "h":5,
+ "i":"4",
+ "type":"Widget",
+ "id":"0-0-4",
+ "metricTypes":[
+ "readMetricsValue"
+ ],
+ "metrics":[
+ "meter_elasticsearch_cluster_primary_shards_total"
+ ],
+ "moved":false,
+ "graph":{
+ "type":"Card",
+ "fontSize":14,
+ "textAlign":"center",
+ "showUnit":false
+ },
+ "widget":{
+ "title":"Active primary shards"
+ }
+ },
+ {
+ "x":4,
+ "y":6,
+ "w":4,
+ "h":5,
+ "i":"5",
+ "type":"Widget",
+ "id":"0-0-5",
+ "metricTypes":[
+ "readMetricsValue"
+ ],
+ "metrics":[
+ "meter_elasticsearch_cluster_shards_total"
+ ],
+ "moved":false,
+ "graph":{
+ "type":"Card",
+ "fontSize":14,
+ "textAlign":"center",
+ "showUnit":false
+ },
+ "widget":{
+ "title":"Active shards"
+ }
+ },
+ {
+ "x":8,
+ "y":6,
+ "w":4,
+ "h":5,
+ "i":"6",
+ "type":"Widget",
+ "id":"0-0-6",
+ "metricTypes":[
+ "readMetricsValue"
+ ],
+ "metrics":[
+ "meter_elasticsearch_cluster_initializing_shards_total"
+ ],
+ "moved":false,
+ "graph":{
+ "type":"Card",
+ "fontSize":14,
+ "textAlign":"center",
+ "showUnit":false
+ },
+ "widget":{
+ "title":"Initializing shards"
+ }
+ },
+ {
+ "x":16,
+ "y":6,
+ "w":4,
+ "h":5,
+ "i":"7",
+ "type":"Widget",
+ "id":"0-0-7",
+ "metricTypes":[
+ "readMetricsValue"
+ ],
+ "metrics":[
+ "meter_elasticsearch_cluster_delayed_unassigned_shards_total"
+ ],
+ "moved":false,
+ "graph":{
+ "type":"Card",
+ "fontSize":14,
+ "textAlign":"center",
+ "showUnit":false
+ },
+ "widget":{
+ "title":"Delayed unassigned shards"
+ }
+ },
+ {
+ "x":20,
+ "y":6,
+ "w":4,
+ "h":5,
+ "i":"8",
+ "type":"Widget",
+ "id":"0-0-8",
+ "metricTypes":[
+ "readMetricsValue"
+ ],
+ "metrics":[
+ "meter_elasticsearch_cluster_relocating_shards_total"
+ ],
+ "moved":false,
+ "graph":{
+ "type":"Card",
+ "fontSize":14,
+ "textAlign":"center",
+ "showUnit":false
+ },
+ "widget":{
+ "title":"Relocating shards"
+ }
+ },
+ {
+ "x":12,
+ "y":6,
+ "w":4,
+ "h":5,
+ "i":"9",
+ "type":"Widget",
+ "id":"0-0-9",
+ "metricTypes":[
+ "readMetricsValue"
+ ],
+ "metrics":[
+ "meter_elasticsearch_cluster_unassigned_shards_total"
+ ],
+ "moved":false,
+ "graph":{
+ "type":"Card",
+ "fontSize":14,
+ "textAlign":"center",
+ "showUnit":false
+ },
+ "widget":{
+ "title":"Unassigned shards"
+ }
+ },
+ {
+ "x":3,
+ "y":0,
+ "w":3,
+ "h":6,
+ "i":"12",
+ "type":"Widget",
+ "id":"0-0-12",
+ "metricTypes":[
+ "readMetricsValues"
+ ],
+ "metrics":[
+ "meter_elasticsearch_cluster_breakers_tripped"
+ ],
+ "moved":false,
+ "graph":{
+ "type":"Card",
+ "fontSize":14,
+ "textAlign":"center",
+ "showUnit":true
+ },
+ "widget":{
+ "title":"Tripped of breakers"
+ }
+ },
+ {
+ "x":6,
+ "y":0,
+ "w":3,
+ "h":6,
+ "i":"13",
+ "type":"Widget",
+ "id":"0-0-13",
+ "metricTypes":[
+ "readMetricsValue"
+ ],
+ "metrics":[
+ "meter_elasticsearch_cluster_cpu_usage_avg"
+ ],
+ "moved":false,
+ "graph":{
+ "type":"Card",
+ "fontSize":14,
+ "textAlign":"center",
+ "showUnit":true
+ },
+ "widget":{
+ "title":"CPU usage Avg (%)"
+ }
+ },
+ {
+ "x":9,
+ "y":0,
+ "w":3,
+ "h":6,
+ "i":"14",
+ "type":"Widget",
+ "id":"0-0-14",
+ "metricTypes":[
+ "readMetricsValue"
+ ],
+ "metrics":[
+ "meter_elasticsearch_cluster_jvm_memory_used_avg"
+ ],
+ "moved":false,
+ "graph":{
+ "type":"Card",
+ "fontSize":14,
+ "textAlign":"center",
+ "showUnit":true
+ },
+ "widget":{
+ "title":"JVM memory used Avg (%)"
+ }
+ },
+ {
+ "x":21,
+ "y":0,
+ "w":3,
+ "h":6,
+ "i":"15",
+ "type":"Widget",
+ "id":"0-0-15",
+ "metricTypes":[
+ "readMetricsValue"
+ ],
+ "metrics":[
+ "meter_elasticsearch_cluster_open_file_descriptors"
Review Comment:
> 1. You should keep upper/lower cases consistent. Such as put all first letters of words in upper case.
> 2. `/s` should be `(/s)` or `Per Second`
>
> After the e2e tests added and merged, you should update showcase to add ElasticSearch monitoring too.
Sure, I will write a showcase.
--
This is an automated message from the Apache Git Service.
To respond to the message, please log on to GitHub and use the
URL above to go to the specific comment.
To unsubscribe, e-mail: notifications-unsubscribe@skywalking.apache.org
For queries about this service, please contact Infrastructure at:
users@infra.apache.org
[GitHub] [skywalking] innerpeacez commented on a diff in pull request #10690: Support Elasticsearch monitoring
Posted by "innerpeacez (via GitHub)" <gi...@apache.org>.
innerpeacez commented on code in PR #10690:
URL: https://github.com/apache/skywalking/pull/10690#discussion_r1168098214


##########
oap-server/server-starter/src/main/resources/ui-initialized-templates/elasticsearch/elasticsearch-index.json:
##########
@@ -0,0 +1,674 @@
+/**
+ * Licensed to the Apache Software Foundation (ASF) under one or more
+ * contributor license agreements.  See the NOTICE file distributed with
+ * this work for additional information regarding copyright ownership.
+ * The ASF licenses this file to You under the Apache License, Version 2.0
+ * (the "License"); you may not use this file except in compliance with
+ * the License.  You may obtain a copy of the License at
+ *
+ *      http://www.apache.org/licenses/LICENSE-2.0
+ *
+ * Unless required by applicable law or agreed to in writing, software
+ * distributed under the License is distributed on an "AS IS" BASIS,
+ * WITHOUT WARRANTIES OR CONDITIONS OF ANY KIND, either express or implied.
+ * See the License for the specific language governing permissions and
+ * limitations under the License.
+ */
+[
+  {
+    "id": "Elasticsearch-Index",
+    "configuration": {
+      "children":[
+        {
+          "x":0,
+          "y":6,
+          "w":12,
+          "h":13,
+          "i":"0",
+          "type":"Widget",
+          "id":"0",
+          "metricTypes":[
+            "readMetricsValues",
+            "readMetricsValues"
+          ],
+          "metrics":[
+            "meter_elasticsearch_index_stats_indexing_index_total_req_rate",
+            "meter_elasticsearch_index_stats_indexing_index_total_proc_rate"
+          ],
+          "moved":false,
+          "graph":{
+            "type":"Line",
+            "step":false,
+            "smooth":false,
+            "showSymbol":false,
+            "showXAxis":true,
+            "showYAxis":true
+          },
+          "widget":{
+            "title":"Indexing rate"
+          }
+        },
+        {
+          "x":12,
+          "y":6,
+          "w":12,
+          "h":13,
+          "i":"1",
+          "type":"Widget",
+          "id":"1",
+          "metricTypes":[
+            "readMetricsValues",
+            "readMetricsValues"
+          ],
+          "metrics":[
+            "meter_elasticsearch_index_stats_search_query_total_req_rate",
+            "meter_elasticsearch_index_stats_search_query_total_proc_rate"
+          ],
+          "moved":false,
+          "graph":{
+            "type":"Line",
+            "step":false,
+            "smooth":false,
+            "showSymbol":false,

Review Comment:
   If I re-save the data using the new UI (latest commit), will it take effect?


--
This is an automated message from the Apache Git Service.
To respond to the message, please log on to GitHub and use the
URL above to go to the specific comment.

To unsubscribe, e-mail: notifications-unsubscribe@skywalking.apache.org

For queries about this service, please contact Infrastructure at:
users@infra.apache.org