You are viewing a plain text version of this content. The canonical link for it is here.
Posted to issues@flink.apache.org by GitBox <gi...@apache.org> on 2019/12/17 15:37:05 UTC
[GitHub] [flink] shuttie edited a comment on issue #10529: [FLINK-15171]
[serialization] fix performance regression caused by too many buffer
allocations on string serialization
shuttie edited a comment on issue #10529: [FLINK-15171] [serialization] fix performance regression caused by too many buffer allocations on string serialization
URL: https://github.com/apache/flink/pull/10529#issuecomment-566545321
@pnowojski @rkhachatryan So looks like that I was able to understand what's going on with this performance regression. To reproduce the issue I had to write yet another benchmark mimicking the one in `SerializationFrameworkMiniBenchmarks.serializerTuple`, but without job setup overhead (as it may take almost 50% of the benchmark runtime). This benchmark just roundtrips the `Tuple8` to byte array and back, using different serializer implementations (I will make a PR to `flink-benchmarks` later).
```
Benchmark Mode Cnt Score Error Units
roundtripTuple thrpt 50 623.194 ± 4.601 ops/ms pre-FLINK-14346
roundtripTuple thrpt 50 590.663 ± 3.570 ops/ms FLINK-14346
```
Compared to the original pre-1.10 implementation, we do much more things in the new version:
1. compute exact buffer size
2. allocate the buffer itself
3. encode chars to the buffer (and not to the stream directly)
4. flush the buffer to the stream
As @pnowojski suggested, there is no need to compute exact buffer size while doing serialization on step 1, we can allocate a small buffer and flush it when it's exhausted. Also, as this small buffer has fixed size, a simple idea was to allocate it once in ThreadLocal and reuse it later:
```
Benchmark Mode Cnt Score Error Units
roundtripTuple thrpt 50 623.194 ± 4.601 ops/ms pre-FLINK-14346
roundtripTuple thrpt 50 590.663 ± 3.570 ops/ms FLINK-14346
roundtripTuple thrpt 50 613.878 ± 2.498 ops/ms FLINK-15171 with ThreadLocal
```
The results were a bit better, as we never scanned the string twice and significantly reduced the number of allocations. But the results were still not that good as before. Surprisingly, ThreadLocal manipulations took most of the time:
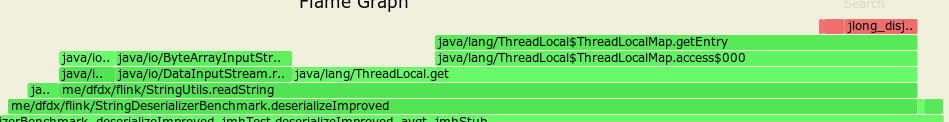
Then we made a test without ThreadLocal, but with fixed-size allocated buffer of size 8 and 16:
```
Benchmark Mode Cnt Score Error Units
roundtripTuple thrpt 50 623.194 ± 4.601 ops/ms pre-FLINK-14346
roundtripTuple thrpt 50 590.663 ± 3.570 ops/ms FLINK-14346
roundtripTuple thrpt 50 613.878 ± 2.498 ops/ms FLINK-15171 with ThreadLocal
roundtripTuple thrpt 50 622.679 ± 4.347 ops/ms FLINK-15171 buffer[8]
roundtripTuple thrpt 50 631.729 ± 4.937 ops/ms FLINK-15171 buffer[16]
```
It improved the situation quite dramatically. We also did a set of benchmarks to observe the impact of buffer size on read/write performance for strings of different length: usually the larger the buffer, the better the performance.
```
[info] Benchmark (bufferSize) (length) (stringType) Mode Cnt Score Error Units
[info] deserializeImproved 8 1 ascii avgt 10 50.854 ± 1.187 ns/op
[info] deserializeImproved 8 4 ascii avgt 10 51.080 ± 1.235 ns/op
[info] deserializeImproved 8 16 ascii avgt 10 67.324 ± 2.230 ns/op
[info] deserializeImproved 8 256 ascii avgt 10 568.002 ± 16.895 ns/op
[info] deserializeImproved 16 1 ascii avgt 10 51.080 ± 1.846 ns/op
[info] deserializeImproved 16 4 ascii avgt 10 51.044 ± 1.862 ns/op
[info] deserializeImproved 16 16 ascii avgt 10 55.298 ± 0.419 ns/op
[info] deserializeImproved 16 256 ascii avgt 10 400.586 ± 1.440 ns/op
[info] deserializeImproved 32 1 ascii avgt 10 51.196 ± 0.443 ns/op
[info] deserializeImproved 32 4 ascii avgt 10 51.587 ± 0.881 ns/op
[info] deserializeImproved 32 16 ascii avgt 10 56.025 ± 0.159 ns/op
[info] deserializeImproved 32 256 ascii avgt 10 335.878 ± 1.231 ns/op
[info] serializeImproved 8 1 ascii avgt 50 30.823 ± 1.189 ns/op
[info] serializeImproved 8 4 ascii avgt 50 31.606 ± 0.479 ns/op
[info] serializeImproved 8 16 ascii avgt 50 87.594 ± 0.700 ns/op
[info] serializeImproved 8 256 ascii avgt 50 861.818 ± 3.382 ns/op
[info] serializeImproved 16 1 ascii avgt 50 30.295 ± 0.429 ns/op
[info] serializeImproved 16 4 ascii avgt 50 32.123 ± 0.406 ns/op
[info] serializeImproved 16 16 ascii avgt 50 70.481 ± 0.830 ns/op
[info] serializeImproved 16 256 ascii avgt 50 522.778 ± 3.020 ns/op
[info] serializeImproved 32 1 ascii avgt 50 30.973 ± 0.284 ns/op
[info] serializeImproved 32 4 ascii avgt 50 32.353 ± 0.313 ns/op
[info] serializeImproved 32 16 ascii avgt 50 38.090 ± 0.383 ns/op
[info] serializeImproved 32 256 ascii avgt 50 418.664 ± 4.335 ns/op
```
But allocating a large buffer for a short string seems to be a bit wasteful, so we tried to make a flexible implementation of buffer sizing (like `min(32, max(8, 1+strlen))` and surprizingly the results degraded quite significantly:
```
Benchmark Mode Cnt Score Error Units
roundtripTuple thrpt 50 623.194 ± 4.601 ops/ms pre-FLINK-14346
roundtripTuple thrpt 50 590.663 ± 3.570 ops/ms FLINK-14346
roundtripTuple thrpt 50 613.878 ± 2.498 ops/ms FLINK-15171 with ThreadLocal
roundtripTuple thrpt 50 622.679 ± 4.347 ops/ms FLINK-15171 buffer[8]
roundtripTuple thrpt 50 631.729 ± 4.937 ops/ms FLINK-15171 buffer[16]
roundtripTuple thrpt 50 547.097 ± 2.687 ops/ms FLINK-15171 buffer[dynamic]
```
If you check the output of perfasm profiler comparing buffer[16] and buffer[dynamic] variants, you will notice that when you allocate a small byte array with known size at the moment of compilation, then JVM can do scalarisation: skip heap allocation, and allocate only 16 bytes right on the stack.
When the buffer is dynamic, then it's always going to heap with significant performance penalty.
As for the increased number of char[] allocations - it looks like to be related to the benchmarking process. As if you increase throughput, then you increase the number of Strings produced by serializer, then increasing the number of chars[] allocated.
So, to sum up the current status of this PR:
1. ~The current version of the regression fix is ready for review.~ Not yet ready, need to fix the issue with `HybridMemorySegment`, see the next comment.
2. The `flink-benchmark` PR with a narrower reproducer used here for the performance regression will be created tomorrow.
3. I also would like to make a PR to `flink-benchmark` to extract all the flink job setup code in the `SerializationFrameworkMiniBenchmarks` out of the main benchmark code, so the results will be much more reproducible and representable. Currently job setup code it highly sensitive to system RAM throughput, that's why I was not able to see this regression, as my RAM is ~15% faster than the one on benchmark machine.
----------------------------------------------------------------
This is an automated message from the Apache Git Service.
To respond to the message, please log on to GitHub and use the
URL above to go to the specific comment.
For queries about this service, please contact Infrastructure at:
users@infra.apache.org
With regards,
Apache Git Services