You are viewing a plain text version of this content. The canonical link for it is here.
Posted to commits@echarts.apache.org by GitBox <gi...@apache.org> on 2019/08/30 12:01:16 UTC
[GitHub] [incubator-echarts] MINDoSOFT commented on issue #10950: Custom
axis ticks min
MINDoSOFT commented on issue #10950: Custom axis ticks min
URL: https://github.com/apache/incubator-echarts/issues/10950#issuecomment-526574937
Basically I want to I achieve what is shown in this screenshot.
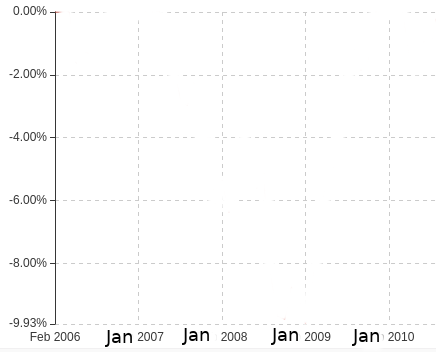
Data starts from Feb 2006 (or any month except January) but I want to render the next x axis tick on Jan 2007 because it makes more sense for someone looking at a chart where the x axis represents months, for the axis ticks/lines to appear when the year changes (e.g. January).
I hope that helps !
----------------------------------------------------------------
This is an automated message from the Apache Git Service.
To respond to the message, please log on to GitHub and use the
URL above to go to the specific comment.
For queries about this service, please contact Infrastructure at:
users@infra.apache.org
With regards,
Apache Git Services
---------------------------------------------------------------------
To unsubscribe, e-mail: commits-unsubscribe@echarts.apache.org
For additional commands, e-mail: commits-help@echarts.apache.org