You are viewing a plain text version of this content. The canonical link for it is here.
Posted to dev@echarts.apache.org by GitBox <gi...@apache.org> on 2019/01/23 04:08:23 UTC
[GitHub] JohnRock0422 opened a new issue #9826: How to use Pictorial Bar to
show Amount Comparison in SVG?
JohnRock0422 opened a new issue #9826: How to use Pictorial Bar to show Amount Comparison in SVG?
URL: https://github.com/apache/incubator-echarts/issues/9826
Hi, I want to show a pictorial chart to show amount comparison, like this:
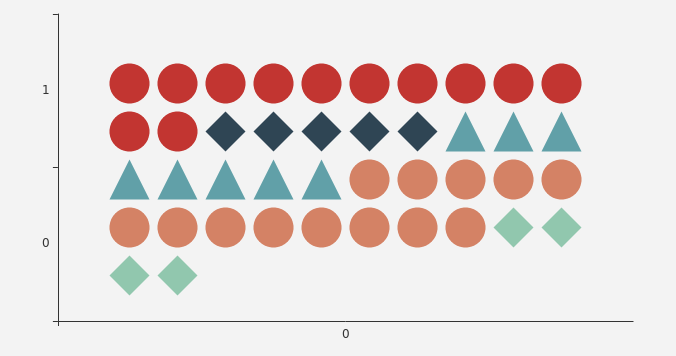
I can do it by using different **data** with different **symbolOffset** to show the symbols one by one,
and it works on echarts demo page (https://ecomfe.github.io/echarts-examples/public/editor.html):
```
option = {
xAxis: {type: 'category', data: [0]},
yAxis: {type: 'category', data: [0, 1]},
series: [
{
type: 'pictorialBar',
symbolPosition: 'center',
symbolRepeat: false,
symbol: 'circle',
symbolSize: [40, 40],
data: [
{value: [0, 1], symbolOffset: ['-540%', '-210%']},
{value: [0, 1], symbolOffset: ['-420%', '-210%']},
{value: [0, 1], symbolOffset: ['-300%', '-210%']},
{value: [0, 1], symbolOffset: ['-180%', '-210%']},
{value: [0, 1], symbolOffset: ['-060%', '-210%']},
{value: [0, 1], symbolOffset: ['60%', '-210%']},
{value: [0, 1], symbolOffset: ['180%', '-210%']},
{value: [0, 1], symbolOffset: ['300%', '-210%']},
{value: [0, 1], symbolOffset: ['420%', '-210%']},
{value: [0, 1], symbolOffset: ['540%', '-210%']},
{value: [0, 1], symbolOffset: ['-540%', '-090%']},
{value: [0, 1], symbolOffset: ['-420%', '-090%']},
]
},
{
type: 'pictorialBar',
symbolPosition: 'center',
symbolRepeat: false,
symbol: 'diamond',
symbolSize: [40, 40],
data: [
{value: [0, 1], symbolOffset: ['-300%', '-090%']},
{value: [0, 1], symbolOffset: ['-180%', '-090%']},
{value: [0, 1], symbolOffset: ['-060%', '-090%']},
{value: [0, 1], symbolOffset: ['60%', '-090%']},
{value: [0, 1], symbolOffset: ['180%', '-090%']},
]
},
{
type: 'pictorialBar',
symbolPosition: 'center',
symbolRepeat: false,
symbol: 'triangle',
symbolSize: [40, 40],
data: [
{value: [0, 1], symbolOffset: ['300%', '-090%']},
{value: [0, 1], symbolOffset: ['420%', '-090%']},
{value: [0, 1], symbolOffset: ['540%', '-090%']},
{value: [0, 1], symbolOffset: ['-540%', '30%']},
{value: [0, 1], symbolOffset: ['-420%', '30%']},
{value: [0, 1], symbolOffset: ['-300%', '30%']},
{value: [0, 1], symbolOffset: ['-180%', '30%']},
{value: [0, 1], symbolOffset: ['-060%', '30%']},
]
},
{
type: 'pictorialBar',
symbolPosition: 'center',
symbolRepeat: false,
symbol: 'circle',
symbolSize: [40, 40],
data: [
{value: [0, 1], symbolOffset: ['60%', '30%']},
{value: [0, 1], symbolOffset: ['180%', '30%']},
{value: [0, 1], symbolOffset: ['300%', '30%']},
{value: [0, 1], symbolOffset: ['420%', '30%']},
{value: [0, 1], symbolOffset: ['540%', '30%']},
{value: [0, 1], symbolOffset: ['-540%', '150%']},
{value: [0, 1], symbolOffset: ['-420%', '150%']},
{value: [0, 1], symbolOffset: ['-300%', '150%']},
{value: [0, 1], symbolOffset: ['-180%', '150%']},
{value: [0, 1], symbolOffset: ['-060%', '150%']},
{value: [0, 1], symbolOffset: ['60%', '150%']},
{value: [0, 1], symbolOffset: ['180%', '150%']},
{value: [0, 1], symbolOffset: ['300%', '150%']},
]
},
{
type: 'pictorialBar',
symbolPosition: 'center',
symbolRepeat: false,
symbol: 'diamond',
symbolSize: [40, 40],
data: [
{value: [0, 1], symbolOffset: ['420%', '150%']},
{value: [0, 1], symbolOffset: ['540%', '150%']},
{value: [0, 1], symbolOffset: ['-540%', '270%']},
{value: [0, 1], symbolOffset: ['-420%', '270%']}
]
}
]
};
```
But when I show it on my page, and render the chart in SVG, 1 symbol will create 1 unknown 'background' with `fill=rgba(0, 0, 0, 0.0002)`.
When the charts show more symbol(s), the 'background'(s) will show a dark gray rectangle(s).


How to clear the gray rectangle(s)?
or, Is there another way to construct this chart?
Thanks.
----------------------------------------------------------------
This is an automated message from the Apache Git Service.
To respond to the message, please log on GitHub and use the
URL above to go to the specific comment.
For queries about this service, please contact Infrastructure at:
users@infra.apache.org
With regards,
Apache Git Services
---------------------------------------------------------------------
To unsubscribe, e-mail: dev-unsubscribe@echarts.apache.org
For additional commands, e-mail: dev-help@echarts.apache.org