You are viewing a plain text version of this content. The canonical link for it is here.
Posted to dev@echarts.apache.org by GitBox <gi...@apache.org> on 2018/09/06 08:01:17 UTC
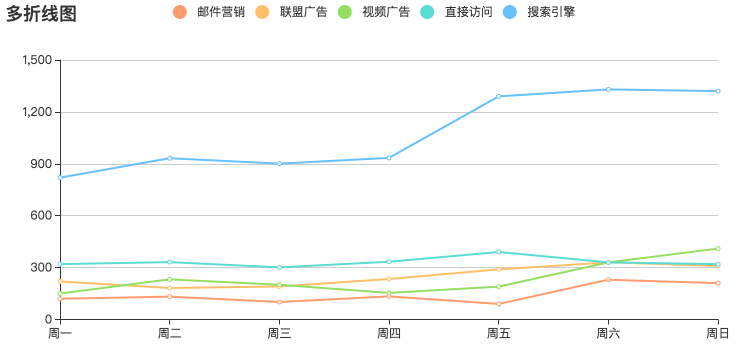
[GitHub] wlc534 opened a new issue #9022: dataset提供渲染数据,怎么定制legend样式?
wlc534 opened a new issue #9022: dataset提供渲染数据,怎么定制legend样式?
URL: https://github.com/apache/incubator-echarts/issues/9022
### One-line summary [问题简述]
在使用dataset提供数据,按列的 key-value 形式。怎么定制legend样式?
### Version & Environment [版本及环境]
+ ECharts version [ECharts 版本]:v4.1.0
+ Browser version [浏览器类型和版本]:chrome 69
+ OS Version [操作系统类型和版本]:macOS
### Expected behaviour [期望结果]
正常显示legend
### ECharts option [ECharts配置项]
<!-- Copy and paste your 'echarts option' here. -->
<!-- [下方贴你的option,注意不要删掉下方 ```javascript 和 尾部的 ``` 字样。最好是我们能够直接运行的 option。如何得到能运行的 option 参见上方的 guidelines for contributing] -->
```javascript
option = {
title: {
text: '多折线图'
},
tooltip: {
trigger: 'axis'
},
legend: {
data:[
{icon:'circle'},
{icon:'circle'},
{icon:'circle'},
{icon:'circle'},
{icon:'circle'},
]
},
dataset:{
source:{
week:['周一','周二','周三','周四','周五','周六','周日'],
'邮件营销':[120, 132, 101, 134, 90, 230, 210],
'联盟广告':[220, 182, 191, 234, 290, 330, 310],
'视频广告':[150, 232, 201, 154, 190, 330, 410],
'直接访问':[320, 332, 301, 334, 390, 330, 320],
'搜索引擎':[820, 932, 901, 934, 1290, 1330, 1320],
}
},
grid: {
left: '3%',
right: '4%',
bottom: '3%',
containLabel: true
},
toolbox: {
feature: {
saveAsImage: {}
}
},
xAxis: {
type: 'category',
boundaryGap: false,
},
yAxis: {
type: 'value'
},
series: [
{
type:'line'
},
{
type:'line'
},
{
type:'line'
},
{
type:'line'
},
{
type:'line'
},
],
color: [
'#FF9C6E', '#FFC069', '#95DE64', '#5CDBD3', '#69C0FF', '#85A5FF', '#B37FEB', '#FF85C0'
]
}
```
### Other comments [其他信息]
<!-- For example: Screenshot or Online demo -->
<!-- [例如,截图或线上实例 (JSFiddle/JSBin/Codepen)] -->
是否可以考虑简化series、legend中配置,直接根据dataset自动生成。不然感觉冗余数据太多了。
legend: {
data:['邮件营销','联盟广告','视频广告','直接访问','搜索引擎']
},
series: [
{
type:'line'
},
{
type:'line'
},
{
type:'line'
},
{
type:'line'
},
{
type:'line'
},
],
----------------------------------------------------------------
This is an automated message from the Apache Git Service.
To respond to the message, please log on GitHub and use the
URL above to go to the specific comment.
For queries about this service, please contact Infrastructure at:
users@infra.apache.org
With regards,
Apache Git Services
---------------------------------------------------------------------
To unsubscribe, e-mail: dev-unsubscribe@echarts.apache.org
For additional commands, e-mail: dev-help@echarts.apache.org