You are viewing a plain text version of this content. The canonical link for it is here.
Posted to commits@mxnet.apache.org by GitBox <gi...@apache.org> on 2019/05/25 00:30:42 UTC
[GitHub] [incubator-mxnet] ZhaoqiZhu opened a new issue #15069: Profiler
RFC: Introducing new APIs
ZhaoqiZhu opened a new issue #15069: Profiler RFC: Introducing new APIs
URL: https://github.com/apache/incubator-mxnet/issues/15069
# Profiler RFC: Introducing new APIs
## Introducing New APIs
### Motivation
MXNet comes with a profiler that allows users to monitor the performance of their models in two metrics: time and memory consumption. Internally, operator calls, C API calls, and memory allocation/deallocation are represented as events. For functions calls, we know the start and finish time of the events and therefore the duration. For memory operations, we know the time of the allocation/deallocation and the size of the memory chunk.
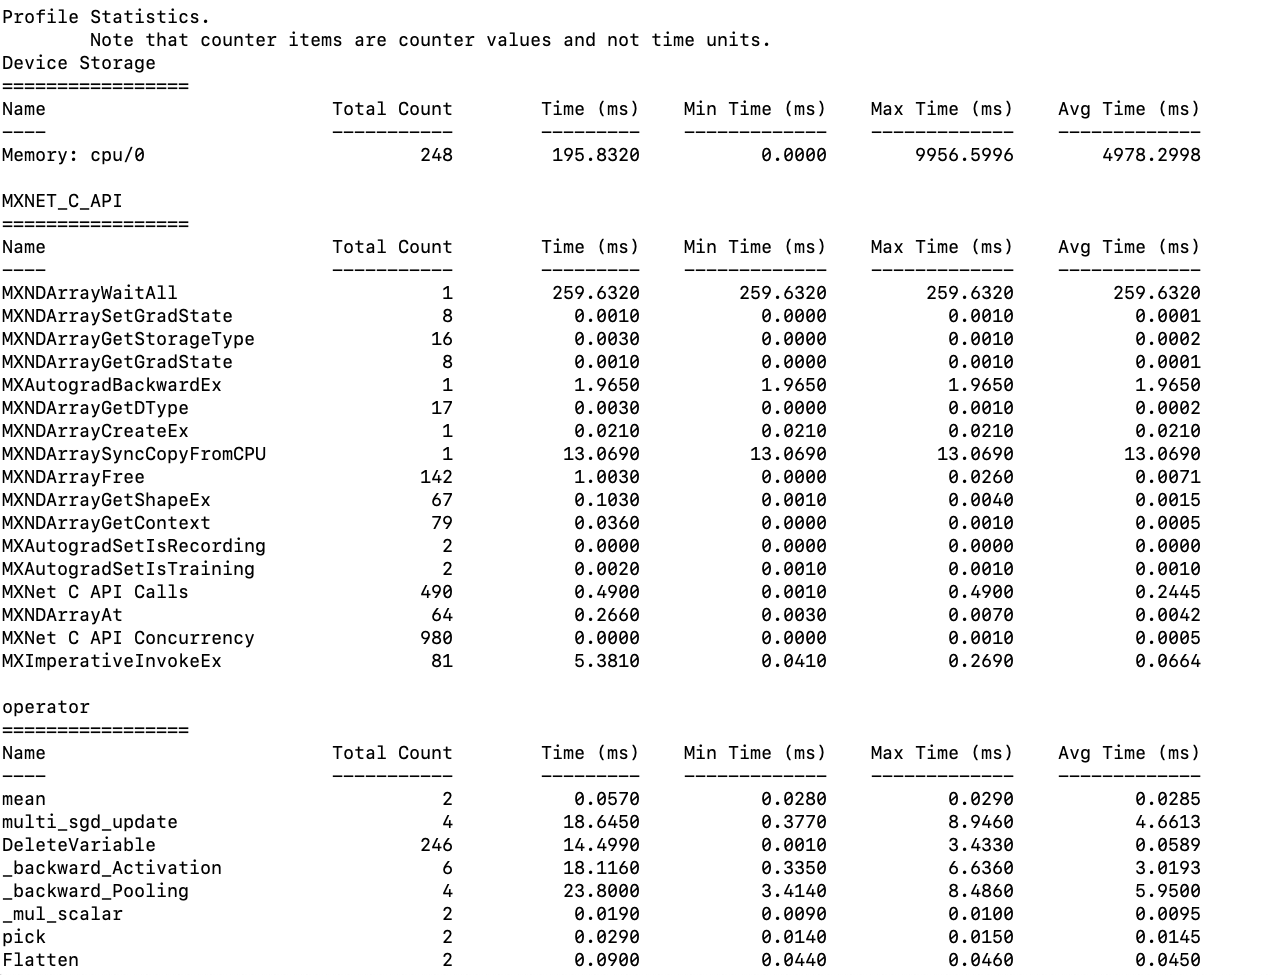
Currently, the profiler has a function called `dumps()` that will return the aggregate statistics, which include min, max, and average for entries in Device Memory, Operator, and C_API. The current return value is string and the data is presented in a table fashion (refer to the screenshot above). However, while the table is nicely formatted, it is only meant to be read by humans but is not easily parse-able otherwise by program. So, there is a need for an API that returns the same aggregate stats in a JSON string.
### Specification
A new API, `get_summary()`, will be introduced. It will have two parameters:
1. “sort_by” which specifies by which statistic should we sort the entries. It defaults to “avg” and valid options are [“min”, “max”, “avg”].
2. “ascending” which specifies how the entries should be sorted. It defaults to False and valid options are [True, False].
Expected use cases of `get_summary()` include:
1. If customers are more interested in some events or stats than the others, they can customize the data presentation to more efficiently monitor their models.
2. Customers can easily pass the stats to automated performance tests or monitoring tools. They do not need to parse the table-like string returned by `dumps()`.
3. This new API will be immediately useful to a new operator-level benchmark tool that Sandeep and I are working on. cwiki: https://cwiki.apache.org/confluence/display/MXNET/MXNet+Operator+Benchmarks.
The structure of the JSON return value is shown below. It is a four layer dictionary structure. The 1st layer is “Time”, “Memory”, and “Unit”. The 2nd layer is the category that the operators/APIs fall into. The 3rd layer is the operators/APIs. Finally, the 4th layer is the stats. Notice that the time unit is ms and the memory unit is byte.
```
{
"Time": {
"operator": {
"mean ": {
"Total Count": 2,
"Total Time": 0.0490,
"Min Time": 0.0240,
"Max Time": 0.0250,
"Avg Time": 0.0245
}
...
}
,
"MXNET_C_API": {
"MXNDArrayWaitAll": {
"Total Count": 1,
"Total Time": 205.9560,
"Min Time": 205.9560,
"Max Time": 205.9560,
"Avg Time": 205.9560
}
,
"MXNDArraySetGradState": {
"Total Count": 8,
"Total Time": 0.0050,
"Min Time": 0.0000,
"Max Time": 0.0010,
"Avg Time": 0.0006
}
...
}
}
,
"Memory": {
"Device Storage": {
"Memory: cpu/0 ": {
"Count": 1,
"Max Usage": 109037988,
"Min Usage": 0,
"Avg Usage": 54518999
}
,
"Memory: gpu/0 ": {
"Count": 1,
"Max Usage": 109037988,
"Min Usage": 0,
"Avg Usage": 54518999
}
}
,
"Pool Memory": {
"Pool:gpu/0 Pool Free": {
"Count": 1,
"Max Usage": 1,
"Min Usage": 2,
"Avg Usage": 3
}
,
"Pool:gpu/0 Pool Used": {
"Count": 1,
"Max Usage": 0,
"Min Usage": 1,
"Avg Usage": 2
}
...
}
}
"Unit": {
"Time": "ms",
"Memory": "byte"
}
}
```
Asides from `get_summary(),` we will also have another new API, `reset()`, which will clear the aggregate statistics up until now. A typical use case is like:
```
# we don't care what happened before this point
profiler.reset()
# model
profiler.set_state('run')
run_training_iteration(*next(itr))
mx.nd.waitall()
profiler.set_state('stop')
# end model
func(profiler.get_summary())
```
In a more complex case, suppose we want to use the same profiler to benchmark various sections of a model, we can then call `get_summary()` and `reset()` at the end of each section or supposedly at the end of a loop neatly like:
```
# model section 1
profiler.set_state('run')
# model code here
profiler.set_state('stop')
print(profiler.get_summary())
profiler.reset()
# model section 2
profiler.set_state('run')
# model code here
profiler.set_state('stop')
func(profiler.get_summary())
profiler.reset()
```
OR
```
# loop through tests functions
for f in benchmark_tests:
profiler.set_state('run')
f()
mx.nd.waitall()
profiler.set_state('stop')
print(profiler.get_summary())
profiler.reset()
```
## Fixing the Output of Dumps()
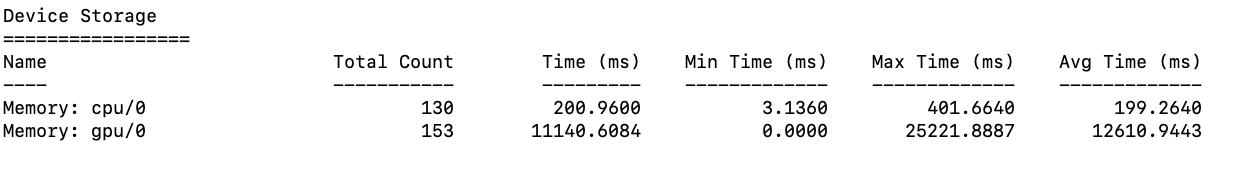
Currently labeling in the table is slightly off. For memory-related entries the labels should be “Usage” rather than “Time”. The “Time (ms)” column also does not make sense for memory entries, so it should be removed for memory entries.
The new table labeling should look like:
`// For time entries`
`Name Total Count Total Time (ms) Min Time (ms) Max Time (ms) Avg Time (ms)`
`// For memory entries`
`Name Total Count Min Usage (MB) Max Usage (MB) Avg Usage (MB)`
## F&Q
1. Why can we use the current dumps() API?
We can use the current dumps API and basically get the save information, but then we need to manually parse the table which is not a good user experience.
1. Why add a new profiler API `get_summary()` in the back-end rather than a python parser utility that returns in JSON?
This is we can use this new API in different languages and make sure the return is consistent.
----------------------------------------------------------------
This is an automated message from the Apache Git Service.
To respond to the message, please log on to GitHub and use the
URL above to go to the specific comment.
For queries about this service, please contact Infrastructure at:
users@infra.apache.org
With regards,
Apache Git Services