You are viewing a plain text version of this content. The canonical link for it is here.
Posted to dev@storm.apache.org by jerrypeng <gi...@git.apache.org> on 2015/11/03 23:47:37 UTC
[GitHub] storm pull request: [STORM-1158] -Storm metrics to profile various...
GitHub user jerrypeng opened a pull request:

    https://github.com/apache/storm/pull/850

    [STORM-1158]  -Storm metrics to profile various storm functions

    It would be nice to have mechanism that would user to collect performance stats on various storm internal actions such as thrift API call and http requests. This will allow users to understand better the performance of many of Storm's internal as well as potentially identifying performance problems and bottlenecks.

    Also wrote a piece of documentation to what is being done:

    docs/documentation/storm-metrics-profiling-internal-actions.md

You can merge this pull request into a Git repository by running:

    $ git pull https://github.com/jerrypeng/storm STORM-1158

Alternatively you can review and apply these changes as the patch at:

    https://github.com/apache/storm/pull/850.patch

To close this pull request, make a commit to your master/trunk branch
with (at least) the following in the commit message:

    This closes #850

----
commit d0d12f110476fd2443f8f163c1cfd892f58a7856
Author: Boyang Jerry Peng <je...@yahoo-inc.com>
Date:   2015-11-03T20:36:55Z

    [STORM-1158] - Storm metrics to profile various storm functions

commit 7ff61ce4e540c5e026ccdfe3bc84fe5266b158da
Author: Boyang Jerry Peng <je...@yahoo-inc.com>
Date:   2015-11-03T22:36:29Z

    adding documentation for storm metrics

----


---
If your project is set up for it, you can reply to this email and have your
reply appear on GitHub as well. If your project does not have this feature
enabled and wishes so, or if the feature is enabled but not working, please
contact infrastructure at infrastructure@apache.org or file a JIRA ticket
with INFRA.
---
[GitHub] storm pull request: [STORM-1158] -Storm metrics to profile various...
Posted by redsanket <gi...@git.apache.org>.
Github user redsanket commented on a diff in the pull request:

    https://github.com/apache/storm/pull/850#discussion_r43922551

    --- Diff: storm-core/src/clj/backtype/storm/daemon/logviewer.clj ---
    @@ -39,10 +39,18 @@
                 [ring.util.codec :as codec]
                 [ring.util.response :as resp]
                 [clojure.string :as string])
    +  (:require [metrics.meters :refer [defmeter mark!]])
    +  (:use [backtype.storm.daemon.common :only [start-metrics-reporters]])
       (:gen-class))

     (def ^:dynamic *STORM-CONF* (read-storm-config))

    +(defmeter num:logviewer-log-page-httpRequests)
    +(defmeter num:logviewer-daemonlog-page-httpRequests)
    +(defmeter num:logviewer-download-log-file-httpRequests)
    +(defmeter num:logviewer-download-log-daemon-file-httpRequests)
    +(defmeter num:logviewer-list-logs-httpRequests)
    --- End diff --

    camel case and clojure naming convention in the same line? httpRequests


---
If your project is set up for it, you can reply to this email and have your
reply appear on GitHub as well. If your project does not have this feature
enabled and wishes so, or if the feature is enabled but not working, please
contact infrastructure at infrastructure@apache.org or file a JIRA ticket
with INFRA.
---
[GitHub] storm pull request: [STORM-1158] -Storm metrics to profile various...
Posted by jerrypeng <gi...@git.apache.org>.
Github user jerrypeng commented on a diff in the pull request:

    https://github.com/apache/storm/pull/850#discussion_r44036638

    --- Diff: storm-core/pom.xml ---
    @@ -602,6 +612,42 @@
                               <pattern>org.eclipse.jetty</pattern>
                               <shadedPattern>org.apache.storm.shade.org.eclipse.jetty</shadedPattern>
                             </relocation>
    +                        <relocation>
    +                            <pattern>com.codahale.metrics</pattern>
    +                            <shadedPattern>org.apache.storm.shade.com.codahale.metrics</shadedPattern>
    +                        </relocation>
    --- End diff --

    Will include a comment in the documentation to state that reporting via JMX is supported at this time since shading may prevent other plugins from working correctly.  Will file a follow-up jira to investigate whether supporting additional plugins is need


---
If your project is set up for it, you can reply to this email and have your
reply appear on GitHub as well. If your project does not have this feature
enabled and wishes so, or if the feature is enabled but not working, please
contact infrastructure at infrastructure@apache.org or file a JIRA ticket
with INFRA.
---
[GitHub] storm pull request: [STORM-1158] -Storm metrics to profile various...
Posted by revans2 <gi...@git.apache.org>.
Github user revans2 commented on a diff in the pull request:

    https://github.com/apache/storm/pull/850#discussion_r43938005

    --- Diff: storm-core/pom.xml ---
    @@ -602,6 +612,42 @@
                               <pattern>org.eclipse.jetty</pattern>
                               <shadedPattern>org.apache.storm.shade.org.eclipse.jetty</shadedPattern>
                             </relocation>
    +                        <relocation>
    +                            <pattern>com.codahale.metrics</pattern>
    +                            <shadedPattern>org.apache.storm.shade.com.codahale.metrics</shadedPattern>
    +                        </relocation>
    --- End diff --

    If we are shading the codahale API the normal way of installing a custom metrics reporter is not going to work.  We should probably look at either not shading this, or at providing instructions on how to make other Reporters work.  But that can probably be in a follow on JIRA.


---
If your project is set up for it, you can reply to this email and have your
reply appear on GitHub as well. If your project does not have this feature
enabled and wishes so, or if the feature is enabled but not working, please
contact infrastructure at infrastructure@apache.org or file a JIRA ticket
with INFRA.
---
[GitHub] storm pull request: [STORM-1158] -Storm metrics to profile various...
Posted by kishorvpatil <gi...@git.apache.org>.
Github user kishorvpatil commented on the pull request:

    https://github.com/apache/storm/pull/850#issuecomment-153950932

    On nimbus, we need two additional counters for following Nimbus thrift ops
    `setWorkerProfiler` and `getComponentPendingProfileActions`


---
If your project is set up for it, you can reply to this email and have your
reply appear on GitHub as well. If your project does not have this feature
enabled and wishes so, or if the feature is enabled but not working, please
contact infrastructure at infrastructure@apache.org or file a JIRA ticket
with INFRA.
---
[GitHub] storm pull request: [STORM-1158] -Storm metrics to profile various...
Posted by revans2 <gi...@git.apache.org>.
Github user revans2 commented on the pull request:

    https://github.com/apache/storm/pull/850#issuecomment-154124771

    One minor doc change and then I am +1.


---
If your project is set up for it, you can reply to this email and have your
reply appear on GitHub as well. If your project does not have this feature
enabled and wishes so, or if the feature is enabled but not working, please
contact infrastructure at infrastructure@apache.org or file a JIRA ticket
with INFRA.
---
[GitHub] storm pull request: [STORM-1158] -Storm metrics to profile various...
Posted by jerrypeng <gi...@git.apache.org>.
Github user jerrypeng commented on a diff in the pull request:
https://github.com/apache/storm/pull/850#discussion_r44038817
--- Diff: docs/documentation/storm-metrics-profiling-internal-actions.md ---
@@ -0,0 +1,70 @@
+# Storm Metrics for Profiling Various Storm Internal Actions
+
+With the addition of these metrics, Storm users can collect, view, and analyze the performance of various internal actions. The actions that are profiled include thrift rpc calls and http quests within the storm daemons. For instance, in the Storm Nimbus daemon, the following thrift calls defined in the Nimbus$Iface are profiled:
+
+- submitTopology
+- submitTopologyWithOpts
+- killTopology
+- killTopologyWithOpts
+- activate
+- deactivate
+- rebalance
+- setLogConfig
+- getLogConfig
+
+Various HTTP GET and POST requests are marked for profiling as well such as the GET and POST requests for the Storm UI daemon (ui/core.cj)
+To implement these metrics the following packages are used:
+- io.dropwizard.metrics
+- metrics-clojure
+
+## How it works
+
+By using packages io.dropwizard.metrics and metrics-clojure (clojure wrapper for the metrics Java API), we can mark functions to profile by declaring (defmeter num-some-func-calls) and then adding the (mark! num-some-func-calls) to where the function is invoked. For example:
+
+ (defmeter num-some-func-calls)
+ (defn some-func [args]
+ (mark! num-some-func-calls)
+ (body))
+
+What essentially the mark! API call does is increment a counter that represents how many times a certain action occured. For instantanous measurements user can use gauges. For example:
+
+ (defgauge nimbus:num-supervisors
+ (fn [] (.size (.supervisors (:storm-cluster-state nimbus) nil))))
+
+The above example will get the number of supervisors in the cluster. This metric is not accumlative like one previously discussed.
+
+A metrics reporting server needs to also be activated to collect the metrics. You can do this by calling the following function:
+
+ (defn start-metrics-reporters []
+ (jmx/start (jmx/reporter {})))
+
+## How to collect the metrics
+
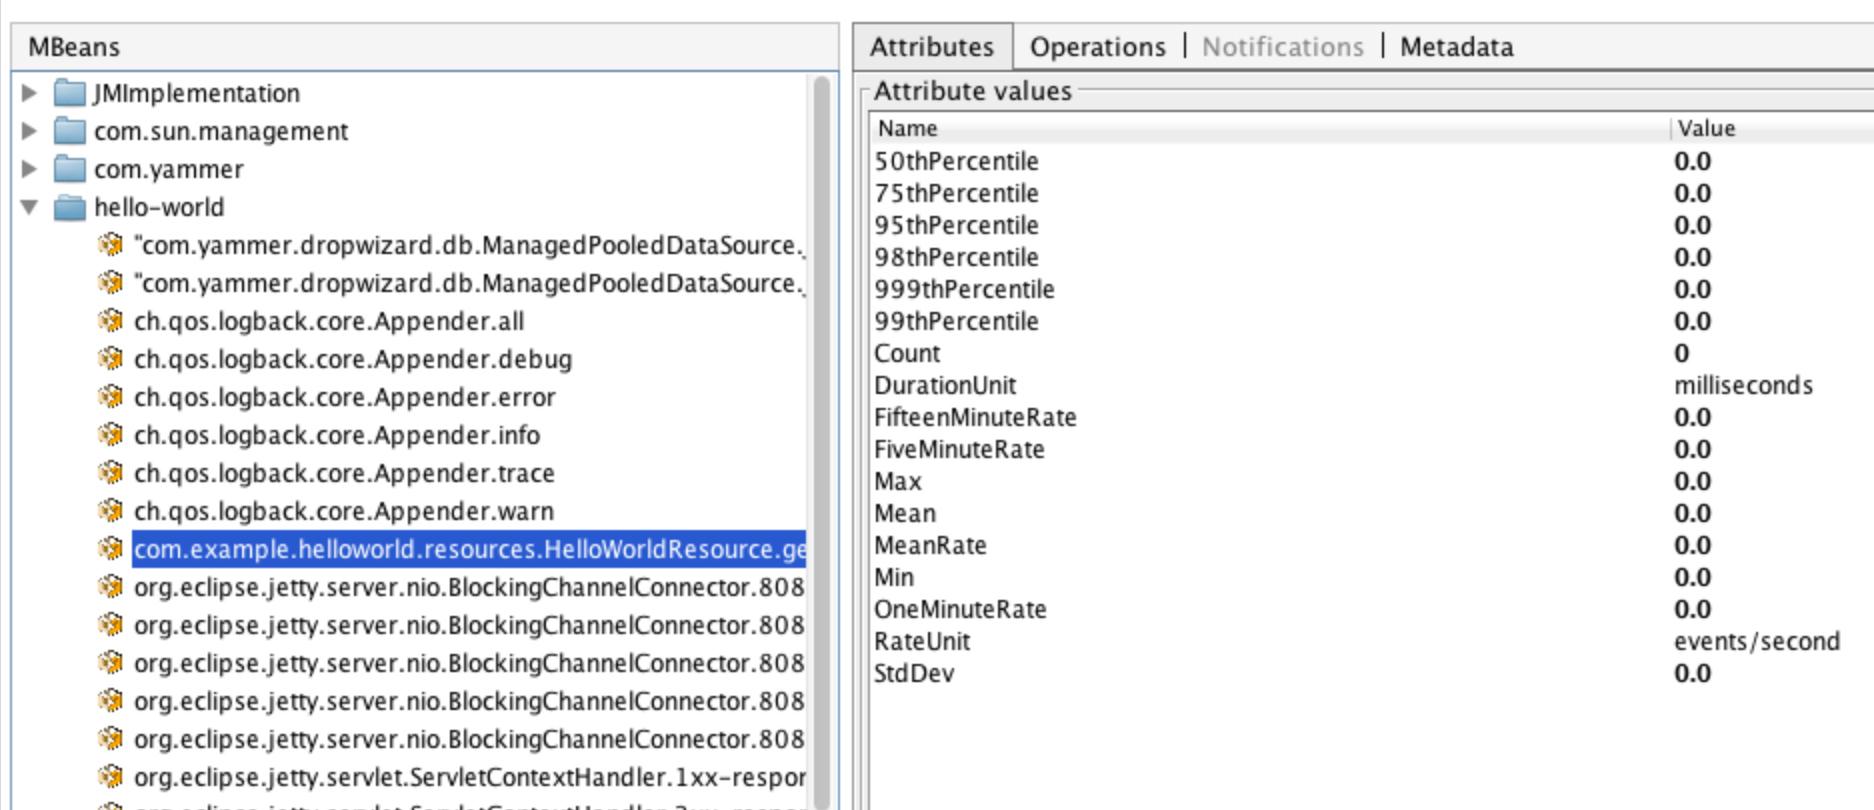
+Metrics can be reported via JMX or HTTP. A user can use JConsole or VisualVM to connect to the jvm process and view the stats.
+
+To view the metrics in a GUI use VisualVM or JConsole. Screenshot of using VisualVm for metrics:
+
+
+
+For detailed information regarding how to collect the metrics please reference:
+
+https://dropwizard.github.io/metrics/3.1.0/getting-started/
+
+If you want use JMX and view metrics through JConsole or VisualVM, remember launch JVM processes your want to profile with the correct JMX configurations. For example in Storm you would add the following to conf/storm.yaml
+
+ nimbus.childopts: "-Xmx1024m -Dcom.sun.management.jmxremote.local.only=false -Dcom.sun.management.jmxremote -Dcom.sun.management.jmxremote.port=3333 -Dcom.sun.management.jmxremote.ssl=false -Dcom.sun.management.jmxremote.authenticate=false"
+
+ ui.childopts: "-Xmx768m -Dcom.sun.management.jmxremote.port=3334 -Dcom.sun.management.jmxremote.local.only=false -Dcom.sun.management.jmxremote -Dcom.sun.management.jmxremote.ssl=false -Dcom.sun.management.jmxremote.authenticate=false"
+
+ logviewer.childopts: "-Xmx128m -Dcom.sun.management.jmxremote.port=3335 -Dcom.sun.management.jmxremote.local.only=false -Dcom.sun.management.jmxremote -Dcom.sun.management.jmxremote.ssl=false -Dcom.sun.management.jmxremote.authenticate=false"
+
+ drpc.childopts: "-Xmx768m -Dcom.sun.management.jmxremote.port=3336 -Dcom.sun.management.jmxremote.local.only=false -Dcom.sun.management.jmxremote -Dcom.sun.management.jmxremote.ssl=false -Dcom.sun.management.jmxremote.authenticate=false"
+
+ supervisor.childopts: "-Xmx256m -Dcom.sun.management.jmxremote.port=3337 -Dcom.sun.management.jmxremote.local.only=false -Dcom.sun.management.jmxremote -Dcom.sun.management.jmxremote.ssl=false -Dcom.sun.management.jmxremote.authenticate=false"
+
+### Please Note:
+Since we shade all of the packages we use, additional plugins for collecting metrics might not work at this time. Currently collecting the metrics via JMX is supported. We can file a follow up Jira to investigate whether we need to support other plugins for collecting the metrics.
--- End diff --
sure
---
If your project is set up for it, you can reply to this email and have your
reply appear on GitHub as well. If your project does not have this feature
enabled and wishes so, or if the feature is enabled but not working, please
contact infrastructure at infrastructure@apache.org or file a JIRA ticket
with INFRA.
---
[GitHub] storm pull request: [STORM-1158] -Storm metrics to profile various...
Posted by revans2 <gi...@git.apache.org>.
Github user revans2 commented on the pull request:

    https://github.com/apache/storm/pull/850#issuecomment-153862641

    For the most part it all looks great, just a few comments some of which can probably be addressed in a follow on JIRA.


---
If your project is set up for it, you can reply to this email and have your
reply appear on GitHub as well. If your project does not have this feature
enabled and wishes so, or if the feature is enabled but not working, please
contact infrastructure at infrastructure@apache.org or file a JIRA ticket
with INFRA.
---
[GitHub] storm pull request: [STORM-1158] -Storm metrics to profile various...
Posted by asfgit <gi...@git.apache.org>.
Github user asfgit closed the pull request at:

    https://github.com/apache/storm/pull/850


---
If your project is set up for it, you can reply to this email and have your
reply appear on GitHub as well. If your project does not have this feature
enabled and wishes so, or if the feature is enabled but not working, please
contact infrastructure at infrastructure@apache.org or file a JIRA ticket
with INFRA.
---
[GitHub] storm pull request: [STORM-1158] -Storm metrics to profile various...
Posted by kishorvpatil <gi...@git.apache.org>.
Github user kishorvpatil commented on the pull request:

    https://github.com/apache/storm/pull/850#issuecomment-154468111

    LGTM. +1. Good bunch..


---
If your project is set up for it, you can reply to this email and have your
reply appear on GitHub as well. If your project does not have this feature
enabled and wishes so, or if the feature is enabled but not working, please
contact infrastructure at infrastructure@apache.org or file a JIRA ticket
with INFRA.
---
[GitHub] storm pull request: [STORM-1158] -Storm metrics to profile various...
Posted by revans2 <gi...@git.apache.org>.
Github user revans2 commented on a diff in the pull request:
https://github.com/apache/storm/pull/850#discussion_r43937323
--- Diff: docs/documentation/storm-metrics-profiling-internal-actions.md ---
@@ -0,0 +1,70 @@
+# Storm Metrics for Profiling Various Storm Internal Actions
+
+With the addition of these metrics, Storm users can collect, view, and analyze the performance of various internal actions. The actions that are profiled include thrift rpc calls and http quests within the storm daemons. For instance, in the Storm Nimbus daemon, the following thrift calls defined in the Nimbus$Iface are profiled:
+
+- submitTopology
+- submitTopologyWithOpts
+- killTopology
+- killTopologyWithOpts
+- activate
+- deactivate
+- rebalance
+- setLogConfig
+- getLogConfig
+
+Various HTTP GET and POST requests are marked for profiling as well such as the GET and POST requests for the Storm UI daemon (ui/core.cj)
+To implement these metrics the following packages are used:
+- io.dropwizard.metrics
+- metrics-clojure
+
+## How it works
+
+By using packages io.dropwizard.metrics and metrics-clojure (clojure wrapper for the metrics Java API), we can mark functions to profile by declaring (defmeter num-some-func-calls) and then adding the (mark! num-some-func-calls) to where the function is invoked. For example:
+
+ (defmeter num-some-func-calls)
+ (defn some-func [args]
+ (mark! num-some-func-calls)
+ (body))
+
+What essentially the mark! API call does is increment a counter that represents how many times a certain action occured. For instantanous measurements user can use gauges. For example:
+
+ (defgauge nimbus:num-supervisors
+ (fn [] (.size (.supervisors (:storm-cluster-state nimbus) nil))))
+
+The above example will get the number of supervisors in the cluster. This metric is not accumlative like one previously discussed.
+
+A metrics reporting server needs to also be activated to collect the metrics. You can do this by calling the following function:
+
+ (defn start-metrics-reporters []
+ (jmx/start (jmx/reporter {})))
+
+## How to collect the metrics
+
+Metrics can be reported via JMX or HTTP. A user can use JConsole or VisualVM to connect to the jvm process and view the stats.
+
+To view the metrics in a GUI use VisualVM or JConsole. Screenshot of using VisualVm for metrics:
+
+
--- End diff --
Can we host our own image instead of relying on an image on some external server?
---
If your project is set up for it, you can reply to this email and have your
reply appear on GitHub as well. If your project does not have this feature
enabled and wishes so, or if the feature is enabled but not working, please
contact infrastructure at infrastructure@apache.org or file a JIRA ticket
with INFRA.
---
[GitHub] storm pull request: [STORM-1158] -Storm metrics to profile various...
Posted by redsanket <gi...@git.apache.org>.
Github user redsanket commented on a diff in the pull request:

    https://github.com/apache/storm/pull/850#discussion_r43922172

    --- Diff: storm-core/src/clj/backtype/storm/daemon/nimbus.clj ---
    @@ -50,9 +50,39 @@
       (:import [backtype.storm.utils VersionInfo])
       (:require [clj-time.core :as time])
       (:require [clj-time.coerce :as coerce])
    +  (:require [metrics.meters :refer [defmeter mark!]])
    +  (:require [metrics.gauges :refer [defgauge]])
       (:gen-class
         :methods [^{:static true} [launch [backtype.storm.scheduler.INimbus] void]]))

    +
    --- End diff --

    blank line?


---
If your project is set up for it, you can reply to this email and have your
reply appear on GitHub as well. If your project does not have this feature
enabled and wishes so, or if the feature is enabled but not working, please
contact infrastructure at infrastructure@apache.org or file a JIRA ticket
with INFRA.
---
[GitHub] storm pull request: [STORM-1158] -Storm metrics to profile various...
Posted by revans2 <gi...@git.apache.org>.
Github user revans2 commented on the pull request:

    https://github.com/apache/storm/pull/850#issuecomment-154200968

    +1 @kishorvpatil do you have any other comments?


---
If your project is set up for it, you can reply to this email and have your
reply appear on GitHub as well. If your project does not have this feature
enabled and wishes so, or if the feature is enabled but not working, please
contact infrastructure at infrastructure@apache.org or file a JIRA ticket
with INFRA.
---
[GitHub] storm pull request: [STORM-1158] -Storm metrics to profile various...
Posted by jerrypeng <gi...@git.apache.org>.
Github user jerrypeng commented on a diff in the pull request:
https://github.com/apache/storm/pull/850#discussion_r44036412
--- Diff: docs/documentation/storm-metrics-profiling-internal-actions.md ---
@@ -0,0 +1,70 @@
+# Storm Metrics for Profiling Various Storm Internal Actions
+
+With the addition of these metrics, Storm users can collect, view, and analyze the performance of various internal actions. The actions that are profiled include thrift rpc calls and http quests within the storm daemons. For instance, in the Storm Nimbus daemon, the following thrift calls defined in the Nimbus$Iface are profiled:
+
+- submitTopology
+- submitTopologyWithOpts
+- killTopology
+- killTopologyWithOpts
+- activate
+- deactivate
+- rebalance
+- setLogConfig
+- getLogConfig
+
+Various HTTP GET and POST requests are marked for profiling as well such as the GET and POST requests for the Storm UI daemon (ui/core.cj)
+To implement these metrics the following packages are used:
+- io.dropwizard.metrics
+- metrics-clojure
+
+## How it works
+
+By using packages io.dropwizard.metrics and metrics-clojure (clojure wrapper for the metrics Java API), we can mark functions to profile by declaring (defmeter num-some-func-calls) and then adding the (mark! num-some-func-calls) to where the function is invoked. For example:
+
+ (defmeter num-some-func-calls)
+ (defn some-func [args]
+ (mark! num-some-func-calls)
+ (body))
+
+What essentially the mark! API call does is increment a counter that represents how many times a certain action occured. For instantanous measurements user can use gauges. For example:
+
+ (defgauge nimbus:num-supervisors
+ (fn [] (.size (.supervisors (:storm-cluster-state nimbus) nil))))
+
+The above example will get the number of supervisors in the cluster. This metric is not accumlative like one previously discussed.
+
+A metrics reporting server needs to also be activated to collect the metrics. You can do this by calling the following function:
+
+ (defn start-metrics-reporters []
+ (jmx/start (jmx/reporter {})))
+
+## How to collect the metrics
+
+Metrics can be reported via JMX or HTTP. A user can use JConsole or VisualVM to connect to the jvm process and view the stats.
+
+To view the metrics in a GUI use VisualVM or JConsole. Screenshot of using VisualVm for metrics:
+
+
--- End diff --
we include a native image
---
If your project is set up for it, you can reply to this email and have your
reply appear on GitHub as well. If your project does not have this feature
enabled and wishes so, or if the feature is enabled but not working, please
contact infrastructure at infrastructure@apache.org or file a JIRA ticket
with INFRA.
---
[GitHub] storm pull request: [STORM-1158] -Storm metrics to profile various...
Posted by revans2 <gi...@git.apache.org>.
Github user revans2 commented on a diff in the pull request:
https://github.com/apache/storm/pull/850#discussion_r44038365
--- Diff: docs/documentation/storm-metrics-profiling-internal-actions.md ---
@@ -0,0 +1,70 @@
+# Storm Metrics for Profiling Various Storm Internal Actions
+
+With the addition of these metrics, Storm users can collect, view, and analyze the performance of various internal actions. The actions that are profiled include thrift rpc calls and http quests within the storm daemons. For instance, in the Storm Nimbus daemon, the following thrift calls defined in the Nimbus$Iface are profiled:
+
+- submitTopology
+- submitTopologyWithOpts
+- killTopology
+- killTopologyWithOpts
+- activate
+- deactivate
+- rebalance
+- setLogConfig
+- getLogConfig
+
+Various HTTP GET and POST requests are marked for profiling as well such as the GET and POST requests for the Storm UI daemon (ui/core.cj)
+To implement these metrics the following packages are used:
+- io.dropwizard.metrics
+- metrics-clojure
+
+## How it works
+
+By using packages io.dropwizard.metrics and metrics-clojure (clojure wrapper for the metrics Java API), we can mark functions to profile by declaring (defmeter num-some-func-calls) and then adding the (mark! num-some-func-calls) to where the function is invoked. For example:
+
+ (defmeter num-some-func-calls)
+ (defn some-func [args]
+ (mark! num-some-func-calls)
+ (body))
+
+What essentially the mark! API call does is increment a counter that represents how many times a certain action occured. For instantanous measurements user can use gauges. For example:
+
+ (defgauge nimbus:num-supervisors
+ (fn [] (.size (.supervisors (:storm-cluster-state nimbus) nil))))
+
+The above example will get the number of supervisors in the cluster. This metric is not accumlative like one previously discussed.
+
+A metrics reporting server needs to also be activated to collect the metrics. You can do this by calling the following function:
+
+ (defn start-metrics-reporters []
+ (jmx/start (jmx/reporter {})))
+
+## How to collect the metrics
+
+Metrics can be reported via JMX or HTTP. A user can use JConsole or VisualVM to connect to the jvm process and view the stats.
+
+To view the metrics in a GUI use VisualVM or JConsole. Screenshot of using VisualVm for metrics:
+
+
+
+For detailed information regarding how to collect the metrics please reference:
+
+https://dropwizard.github.io/metrics/3.1.0/getting-started/
+
+If you want use JMX and view metrics through JConsole or VisualVM, remember launch JVM processes your want to profile with the correct JMX configurations. For example in Storm you would add the following to conf/storm.yaml
+
+ nimbus.childopts: "-Xmx1024m -Dcom.sun.management.jmxremote.local.only=false -Dcom.sun.management.jmxremote -Dcom.sun.management.jmxremote.port=3333 -Dcom.sun.management.jmxremote.ssl=false -Dcom.sun.management.jmxremote.authenticate=false"
+
+ ui.childopts: "-Xmx768m -Dcom.sun.management.jmxremote.port=3334 -Dcom.sun.management.jmxremote.local.only=false -Dcom.sun.management.jmxremote -Dcom.sun.management.jmxremote.ssl=false -Dcom.sun.management.jmxremote.authenticate=false"
+
+ logviewer.childopts: "-Xmx128m -Dcom.sun.management.jmxremote.port=3335 -Dcom.sun.management.jmxremote.local.only=false -Dcom.sun.management.jmxremote -Dcom.sun.management.jmxremote.ssl=false -Dcom.sun.management.jmxremote.authenticate=false"
+
+ drpc.childopts: "-Xmx768m -Dcom.sun.management.jmxremote.port=3336 -Dcom.sun.management.jmxremote.local.only=false -Dcom.sun.management.jmxremote -Dcom.sun.management.jmxremote.ssl=false -Dcom.sun.management.jmxremote.authenticate=false"
+
+ supervisor.childopts: "-Xmx256m -Dcom.sun.management.jmxremote.port=3337 -Dcom.sun.management.jmxremote.local.only=false -Dcom.sun.management.jmxremote -Dcom.sun.management.jmxremote.ssl=false -Dcom.sun.management.jmxremote.authenticate=false"
+
+### Please Note:
+Since we shade all of the packages we use, additional plugins for collecting metrics might not work at this time. Currently collecting the metrics via JMX is supported. We can file a follow up Jira to investigate whether we need to support other plugins for collecting the metrics.
--- End diff --
Instead of saying we can file a follow up JIRA could we just file one and remove that pert?
---
If your project is set up for it, you can reply to this email and have your
reply appear on GitHub as well. If your project does not have this feature
enabled and wishes so, or if the feature is enabled but not working, please
contact infrastructure at infrastructure@apache.org or file a JIRA ticket
with INFRA.
---
[GitHub] storm pull request: [STORM-1158] -Storm metrics to profile various...
Posted by jerrypeng <gi...@git.apache.org>.
Github user jerrypeng commented on the pull request:

    https://github.com/apache/storm/pull/850#issuecomment-154121467

    @kishorvpatil will add the two metrics


---
If your project is set up for it, you can reply to this email and have your
reply appear on GitHub as well. If your project does not have this feature
enabled and wishes so, or if the feature is enabled but not working, please
contact infrastructure at infrastructure@apache.org or file a JIRA ticket
with INFRA.
---
[GitHub] storm pull request: [STORM-1158] -Storm metrics to profile various...
Posted by jerrypeng <gi...@git.apache.org>.
Github user jerrypeng commented on the pull request:

    https://github.com/apache/storm/pull/850#issuecomment-154122052

    @revans2 and @kishorvpatil thank you for your reviews.  I just made pushed another commit that hopefully address all of your comments


---
If your project is set up for it, you can reply to this email and have your
reply appear on GitHub as well. If your project does not have this feature
enabled and wishes so, or if the feature is enabled but not working, please
contact infrastructure at infrastructure@apache.org or file a JIRA ticket
with INFRA.
---