You are viewing a plain text version of this content. The canonical link for it is here.
Posted to notifications@apisix.apache.org by GitBox <gi...@apache.org> on 2020/12/02 02:57:35 UTC
[GitHub] [apisix] Ben0625 opened a new issue #2919: bug: failed to fetch data from etcd: failed to watch data, response code: 404
Ben0625 opened a new issue #2919:
URL: https://github.com/apache/apisix/issues/2919


   ### Issue description
   Once I start apisix, the error log keeps flushing the following error information periodically without stopping:
   2020/12/02 10:43:42 [error] 31184#31184: *584 [lua] config_etcd.lua:428: failed to fetch data from etcd: failed to watch data, response code: 404,  etcd key: /apisix/proto, context: ngx.timer
   2020/12/02 10:43:42 [error] 31181#31181: *660 [lua] config_etcd.lua:428: failed to fetch data from etcd: failed to watch data, response code: 404,  etcd key: /apisix/ssl, context: ngx.timer
   2020/12/02 10:43:42 [error] 31181#31181: *682 [lua] config_etcd.lua:428: failed to fetch data from etcd: failed to watch data, response code: 404,  etcd key: /apisix/consumers, context: ngx.timer
   2020/12/02 10:43:42 [error] 31181#31181: *662 [lua] config_etcd.lua:428: failed to fetch data from etcd: failed to watch data, response code: 404,  etcd key: /apisix/global_rules, context: ngx.timer
   2020/12/02 10:43:42 [error] 31180#31180: *698 [lua] config_etcd.lua:428: failed to fetch data from etcd: failed to watch data, response code: 404,  etcd key: /apisix/services, context: ngx.timer
   2020/12/02 10:43:42 [error] 31180#31180: *726 [lua] config_etcd.lua:428: failed to fetch data from etcd: failed to watch data, response code: 404,  etcd key: /apisix/upstreams, context: ngx.timer
   2020/12/02 10:43:42 [error] 31180#31180: *714 [lua] config_etcd.lua:428: failed to fetch data from etcd: failed to watch data, response code: 404,  etcd key: /apisix/consumers, context: ngx.timer
   ......

   ### Environment

   * apisix version (cmd: `apisix version`): 2.0
   * OS: Centos7
   * etcd cluster version:
   $ ./etcd --version
   etcd Version: 3.4.13
   Git SHA: ae9734ed2
   Go Version: go1.12.17
   Go OS/Arch: linux/amd64

   ### What's the actual result? (including assertion message & call stack if applicable)
   Strangely, the etcd cluster is running well and so does apisix:

   **etcd configuration in config.yaml of apisix:**
   etcd:
       host:
        - "http://10.193.161.151:2389"
        - "http://10.193.161.153:2389"
        - "http://10.193.161.156:2389"


   **One of the yaml files to start etcd cluster:**
    name: etcd-161-151-noauth
   data-dir: /home/nlu/etcd/data2-noauth
   listen-client-urls: http://10.193.161.151:2389,http://127.0.0.1:2389
   advertise-client-urls: http://10.193.161.151:2389,http://127.0.0.1:2389
   listen-peer-urls: http://10.193.161.151:2390
   initial-advertise-peer-urls: http://10.193.161.151:2390
   initial-cluster: etcd-161-153-noauth=http://10.193.161.153:2390,etcd-161-156-noauth=http://10.193.161.156:2390,etcd-161-151-noauth=http://10.193.161.151:2390
   initial-cluster-token: etcd-cluster-token-3
   initial-cluster-state: new
   enable-grpc-gateway: true
   logger: zap


   **Keys in etcd cluster:**
   /apisix/consumers/
   init_dir
   /apisix/global_rules/
   init_dir
   /apisix/node_status/
   init_dir
   /apisix/plugin_metadata/
   init_dir
   /apisix/plugins/
   init_dir
   /apisix/proto/
   init_dir
   /apisix/routes/
   init_dir
   /apisix/routes/330835041972126084
   {"id":"330835041972126084","create_time":1606722651,"update_time":1606806589,"uris":["/test"],"name":"test","methods":["GET","HEAD","POST","PUT","DELETE","OPTIONS","PATCH"],"vars":[],"upstream_id":"330834478979088772"}
   /apisix/services/
   init_dir
   /apisix/ssl/
   init_dir
   /apisix/stream_routes/
   init_dir
   /apisix/upstreams/
   init_dir
   /apisix/upstreams/330834478979088772
   {"id":"330834478979088772","create_time":1606722315,"update_time":1606806983,"nodes":[{"host":"10.102.136.44","port":6666,"weight":1},{"host":"10.102.136.44","port":6667,"weight":1}],"timeout":{"connect":6000,"read":6000,"send":6000},"type":"roundrobin","checks":{"active":{"healthy":{"interval":1,"successes":1},"host":"l","http_path":"/","timeout":1,"unhealthy":{"http_failures":1,"interval":1}},"passive":{"healthy":{"successes":1},"unhealthy":{"http_failures":1,"tcp_failures":1}}},"name":"test"}

   I create a route with limit-count plugin and it works fine.

   ### What's the expected result?
   No error information in error.log


----------------------------------------------------------------
This is an automated message from the Apache Git Service.
To respond to the message, please log on to GitHub and use the
URL above to go to the specific comment.

For queries about this service, please contact Infrastructure at:
users@infra.apache.org
[GitHub] [apisix] Ben0625 edited a comment on issue #2919: bug: failed to fetch data from etcd: failed to watch data, response code: 404
Posted by GitBox <gi...@apache.org>.
Ben0625 edited a comment on issue #2919:
URL: https://github.com/apache/apisix/issues/2919#issuecomment-737111339


   If I use a single-node etcd (also 3.4.13 version), it works as expected. (Nothing shows in error.log and the functions of apisix still works fine)


----------------------------------------------------------------
This is an automated message from the Apache Git Service.
To respond to the message, please log on to GitHub and use the
URL above to go to the specific comment.

For queries about this service, please contact Infrastructure at:
users@infra.apache.org
[GitHub] [apisix] Ben0625 commented on issue #2919: bug: failed to fetch data from etcd: failed to watch data, response code: 404
Posted by GitBox <gi...@apache.org>.
Ben0625 commented on issue #2919:
URL: https://github.com/apache/apisix/issues/2919#issuecomment-737724180
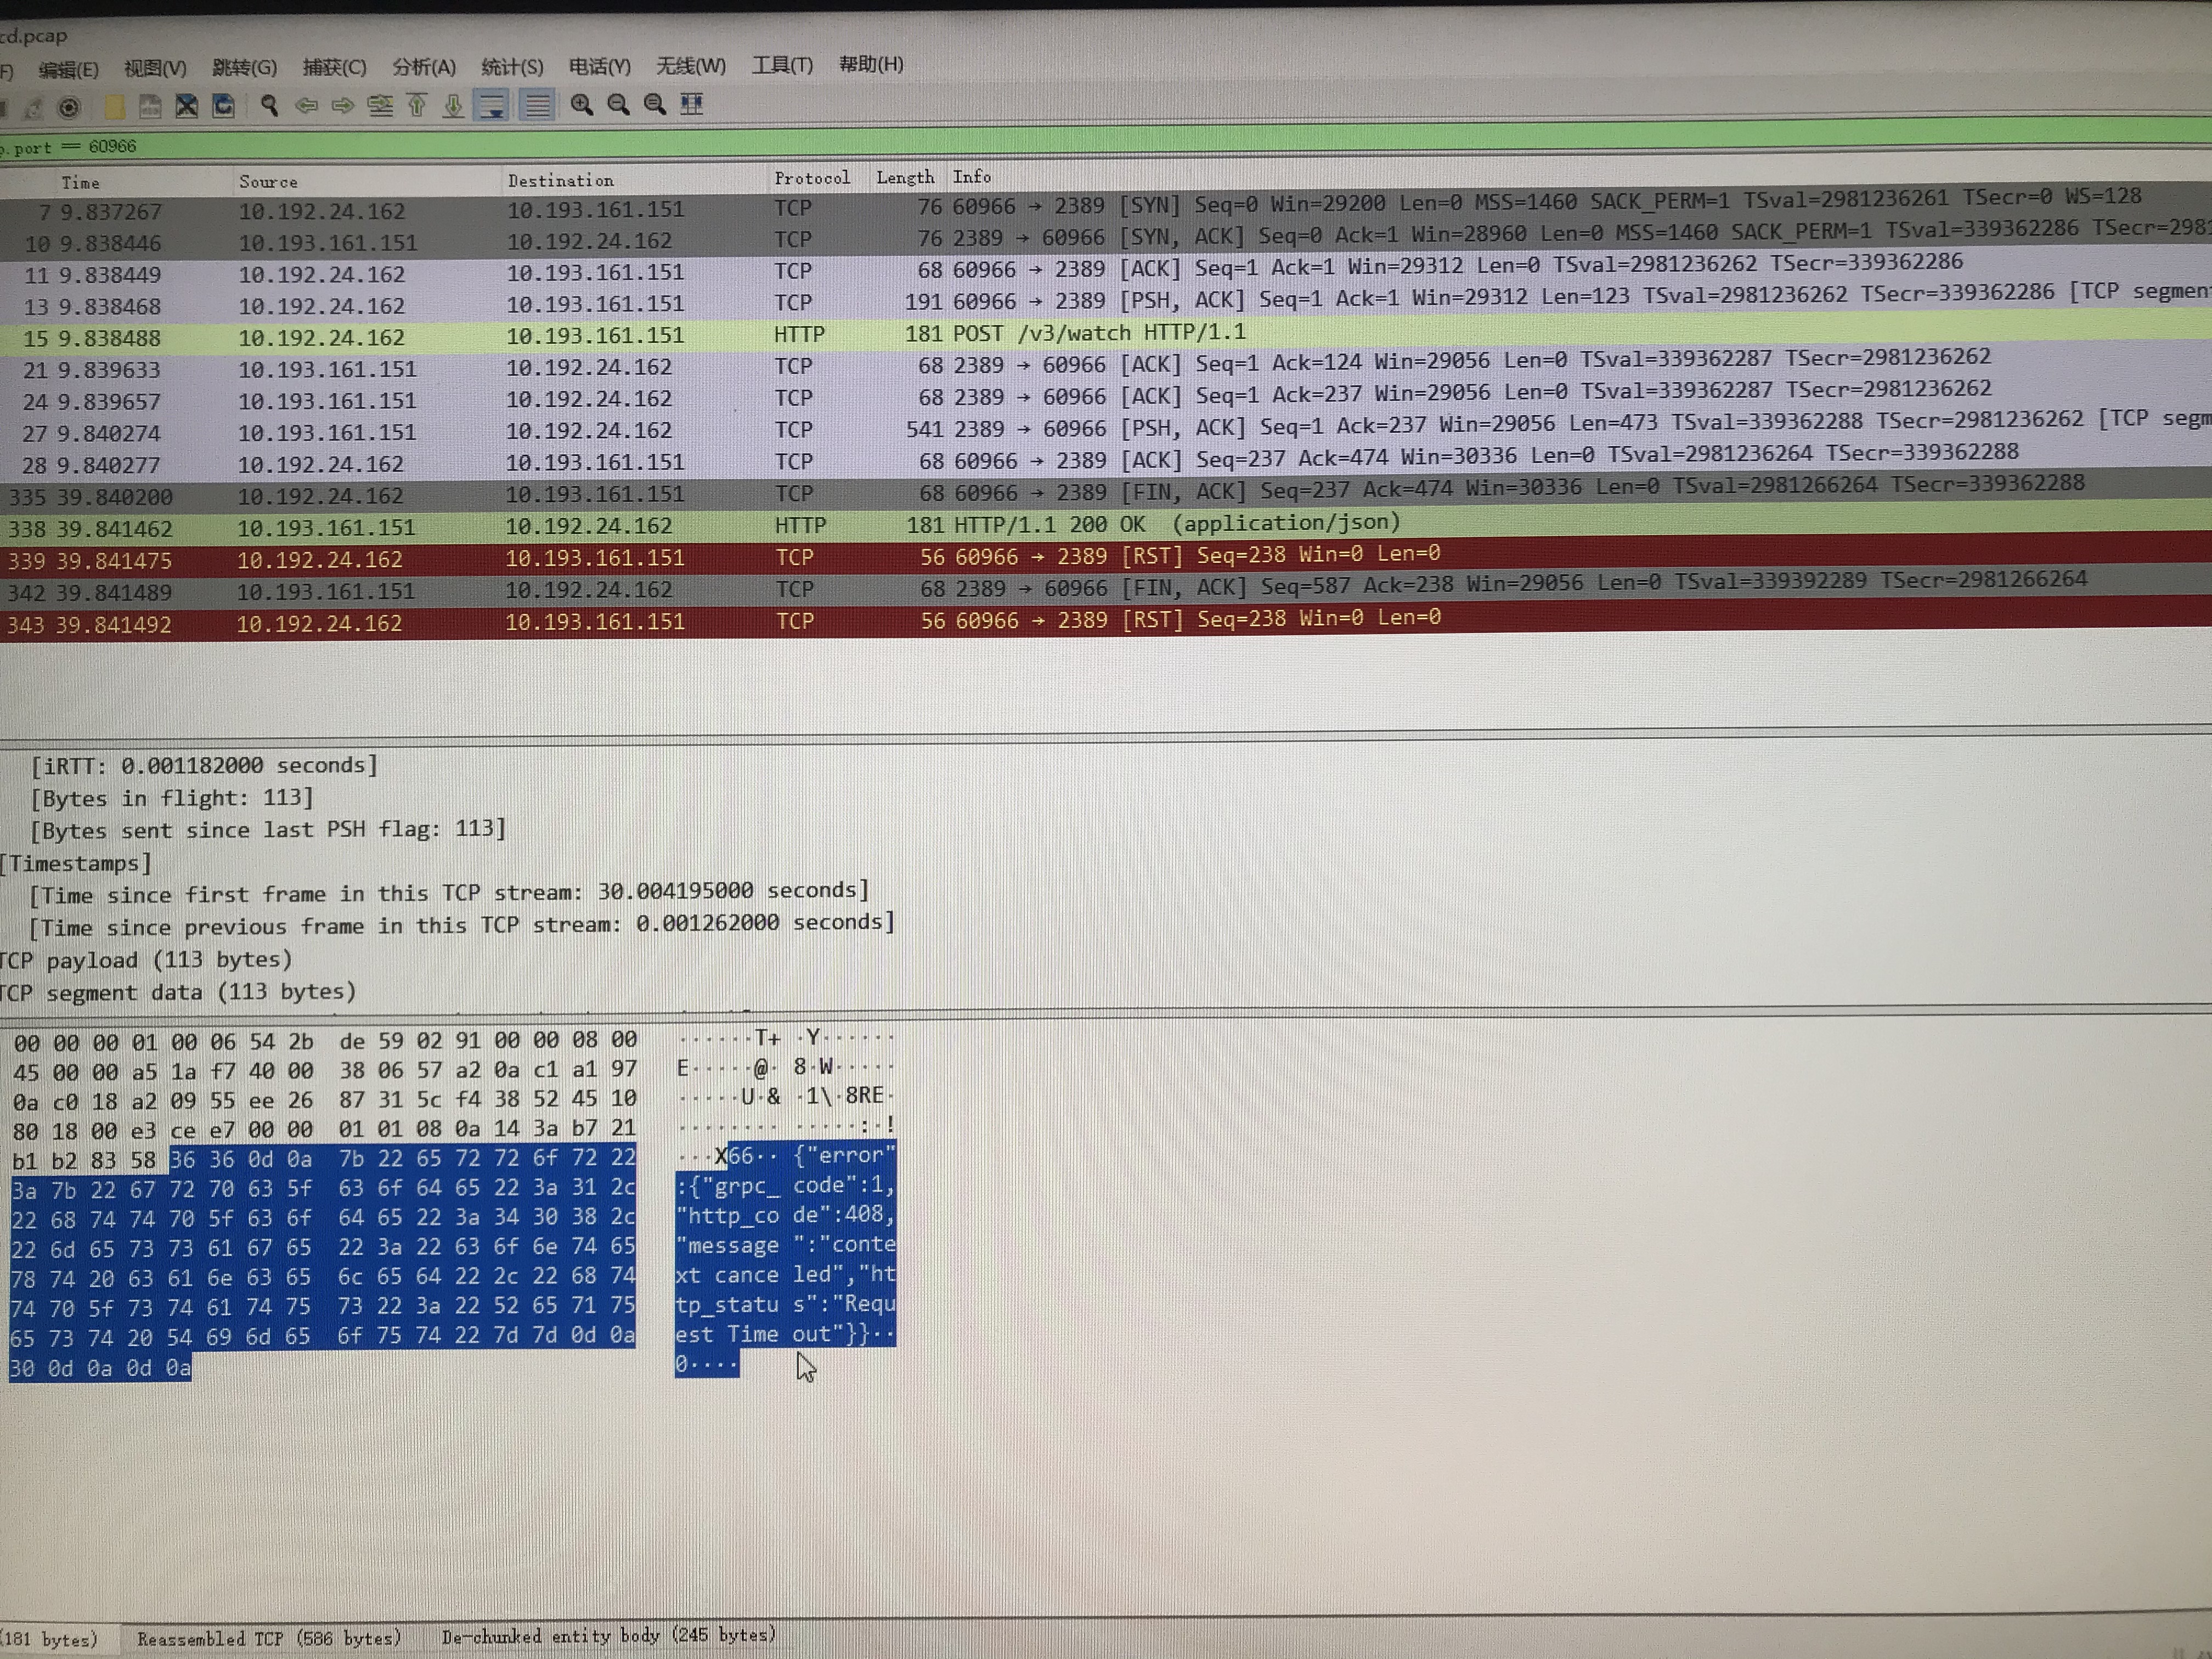
This is one of the watch request and response. Etcd is using Port 2389. I have no idea why there is a request timeout..
----------------------------------------------------------------
This is an automated message from the Apache Git Service.
To respond to the message, please log on to GitHub and use the
URL above to go to the specific comment.
For queries about this service, please contact Infrastructure at:
users@infra.apache.org
[GitHub] [apisix] Ben0625 commented on issue #2919: bug: failed to fetch data from etcd: failed to watch data, response code: 404
Posted by GitBox <gi...@apache.org>.
Ben0625 commented on issue #2919:
URL: https://github.com/apache/apisix/issues/2919#issuecomment-737099508


   > how do you install the apisix? by rpm, docker or source code?

   By source code. After installing the dependencies and changing the etcd configuratoin of config.yaml, I start apisix using "make deps" and "./bin/apisix start", which seems to be normal.


----------------------------------------------------------------
This is an automated message from the Apache Git Service.
To respond to the message, please log on to GitHub and use the
URL above to go to the specific comment.

For queries about this service, please contact Infrastructure at:
users@infra.apache.org
[GitHub] [apisix] tokers commented on issue #2919: bug: failed to fetch data from etcd: failed to watch data, response code: 404
Posted by GitBox <gi...@apache.org>.
tokers commented on issue #2919:
URL: https://github.com/apache/apisix/issues/2919#issuecomment-737784746
> 
> This is one of the watch request and response. Etcd is using Port 2389. I have no idea why there is a request timeout..
Firstly the gRPC gateway is actually listening on the client port and proxies to the same port with gRPC protocol.
The Request Time Out error is deducted with the Canceled code. See https://github.com/grpc-ecosystem/grpc-gateway/blob/26104fd424bf45f44d498149b071ef657d604f2b/runtime/errors.go#L29.
You may tweak the etcd log level and paste some logs here to troubleshoot this problem.
----------------------------------------------------------------
This is an automated message from the Apache Git Service.
To respond to the message, please log on to GitHub and use the
URL above to go to the specific comment.
For queries about this service, please contact Infrastructure at:
users@infra.apache.org
[GitHub] [apisix] Ben0625 commented on issue #2919: bug: failed to fetch data from etcd: failed to watch data, response code: 404
Posted by GitBox <gi...@apache.org>.
Ben0625 commented on issue #2919:
URL: https://github.com/apache/apisix/issues/2919#issuecomment-737111339


   If I use a single-node etcd, it works perfect. (Nothing shows in error.log and the functions of apisix still works fine)


----------------------------------------------------------------
This is an automated message from the Apache Git Service.
To respond to the message, please log on to GitHub and use the
URL above to go to the specific comment.

For queries about this service, please contact Infrastructure at:
users@infra.apache.org
[GitHub] [apisix] Yiyiyimu commented on issue #2919: bug: failed to fetch data from etcd: failed to watch data, response code: 404
Posted by GitBox <gi...@apache.org>.
Yiyiyimu commented on issue #2919:
URL: https://github.com/apache/apisix/issues/2919#issuecomment-737223607


   > If I use a single-node etcd (also 3.4.13 version) and reload apisix, it works as expected. (Nothing shows in error.log and the functions of apisix still works fine)

   The same error happens in #2695 and #2912, that cluster mode would have errors but not the single mode. But you've already set `enable-grpc-gateway: true`..


----------------------------------------------------------------
This is an automated message from the Apache Git Service.
To respond to the message, please log on to GitHub and use the
URL above to go to the specific comment.

For queries about this service, please contact Infrastructure at:
users@infra.apache.org
[GitHub] [apisix] Ben0625 edited a comment on issue #2919: bug: failed to fetch data from etcd: failed to watch data, response code: 404
Posted by GitBox <gi...@apache.org>.
Ben0625 edited a comment on issue #2919:
URL: https://github.com/apache/apisix/issues/2919#issuecomment-737111339


   If I use a single-node etcd (also 3.4.13 version), it works perfect. (Nothing shows in error.log and the functions of apisix still works fine)


----------------------------------------------------------------
This is an automated message from the Apache Git Service.
To respond to the message, please log on to GitHub and use the
URL above to go to the specific comment.

For queries about this service, please contact Infrastructure at:
users@infra.apache.org
[GitHub] [apisix] nic-chen commented on issue #2919: bug: failed to fetch data from etcd: failed to watch data, response code: 404
Posted by GitBox <gi...@apache.org>.
nic-chen commented on issue #2919:
URL: https://github.com/apache/apisix/issues/2919#issuecomment-737235340


   It’s a bit strange, you could make a tcpdump to see what happen.


----------------------------------------------------------------
This is an automated message from the Apache Git Service.
To respond to the message, please log on to GitHub and use the
URL above to go to the specific comment.

For queries about this service, please contact Infrastructure at:
users@infra.apache.org
[GitHub] [apisix] Ben0625 commented on issue #2919: bug: failed to fetch data from etcd: failed to watch data, response code: 404
Posted by GitBox <gi...@apache.org>.
Ben0625 commented on issue #2919:
URL: https://github.com/apache/apisix/issues/2919#issuecomment-738609841


   Finally I find out the reason: One of the member (10.193.161.156) of the etcd cluster didn't set enable-grpc-gateway to true... After restarting this member with the configuration added, nothing shows on error.log. Thanks for much help!


----------------------------------------------------------------
This is an automated message from the Apache Git Service.
To respond to the message, please log on to GitHub and use the
URL above to go to the specific comment.

For queries about this service, please contact Infrastructure at:
users@infra.apache.org
[GitHub] [apisix] Ben0625 edited a comment on issue #2919: bug: failed to fetch data from etcd: failed to watch data, response code: 404
Posted by GitBox <gi...@apache.org>.
Ben0625 edited a comment on issue #2919:
URL: https://github.com/apache/apisix/issues/2919#issuecomment-737111339


   If I use a single-node etcd (also 3.4.13 version) and reload apisix, it works as expected. (Nothing shows in error.log and the functions of apisix still works fine)


----------------------------------------------------------------
This is an automated message from the Apache Git Service.
To respond to the message, please log on to GitHub and use the
URL above to go to the specific comment.

For queries about this service, please contact Infrastructure at:
users@infra.apache.org
[GitHub] [apisix] Ben0625 closed issue #2919: bug: failed to fetch data from etcd: failed to watch data, response code: 404
Posted by GitBox <gi...@apache.org>.
Ben0625 closed issue #2919:
URL: https://github.com/apache/apisix/issues/2919


----------------------------------------------------------------
This is an automated message from the Apache Git Service.
To respond to the message, please log on to GitHub and use the
URL above to go to the specific comment.

For queries about this service, please contact Infrastructure at:
users@infra.apache.org
[GitHub] [apisix] Ben0625 commented on issue #2919: bug: failed to fetch data from etcd: failed to watch data, response code: 404
Posted by GitBox <gi...@apache.org>.
Ben0625 commented on issue #2919:
URL: https://github.com/apache/apisix/issues/2919#issuecomment-736958380


   It still happens even after running the command: apisix init_etcd true:
   curl http://10.193.161.151:2389/v3/kv/put -X POST -d '{"value":"aW5pdF9kaXI=", "key":"L2FwaXNpeC9yb3V0ZXMv"}' --connect-timeout 30 --max-time 60 --retry 1 2>&1
     % Total    % Received % Xferd  Average Speed   Time    Time     Time  Current
                                    Dload  Upload   Total   Spent    Left  Speed
   100   170  100   116  100    54  34866  16230 --:--:-- --:--:-- --:--:-- 38666
   {"header":{"cluster_id":"14378065948964416658","member_id":"5786953710659384407","revision":"310","raft_term":"25"}}
   curl http://10.193.161.151:2389/v3/kv/put -X POST -d '{"value":"aW5pdF9kaXI=", "key":"L2FwaXNpeC91cHN0cmVhbXMv"}' --connect-timeout 30 --max-time 60 --retry 1 2>&1
     % Total    % Received % Xferd  Average Speed   Time    Time     Time  Current
                                    Dload  Upload   Total   Spent    Left  Speed
   100   174  100   116  100    58  33323  16661 --:--:-- --:--:-- --:--:-- 38666
   {"header":{"cluster_id":"14378065948964416658","member_id":"5786953710659384407","revision":"311","raft_term":"25"}}
   curl http://10.193.161.151:2389/v3/kv/put -X POST -d '{"value":"aW5pdF9kaXI=", "key":"L2FwaXNpeC9zZXJ2aWNlcy8="}' --connect-timeout 30 --max-time 60 --retry 1 2>&1
     % Total    % Received % Xferd  Average Speed   Time    Time     Time  Current
                                    Dload  Upload   Total   Spent    Left  Speed
   100   174  100   116  100    58  32973  16486 --:--:-- --:--:-- --:--:-- 38666
   {"header":{"cluster_id":"14378065948964416658","member_id":"5786953710659384407","revision":"312","raft_term":"25"}}
   curl http://10.193.161.151:2389/v3/kv/put -X POST -d '{"value":"aW5pdF9kaXI=", "key":"L2FwaXNpeC9wbHVnaW5zLw=="}' --connect-timeout 30 --max-time 60 --retry 1 2>&1
     % Total    % Received % Xferd  Average Speed   Time    Time     Time  Current
                                    Dload  Upload   Total   Spent    Left  Speed
   100   174  100   116  100    58  33171  16585 --:--:-- --:--:-- --:--:-- 38666
   {"header":{"cluster_id":"14378065948964416658","member_id":"5786953710659384407","revision":"313","raft_term":"25"}}
   curl http://10.193.161.151:2389/v3/kv/put -X POST -d '{"value":"aW5pdF9kaXI=", "key":"L2FwaXNpeC9jb25zdW1lcnMv"}' --connect-timeout 30 --max-time 60 --retry 1 2>&1
     % Total    % Received % Xferd  Average Speed   Time    Time     Time  Current
                                    Dload  Upload   Total   Spent    Left  Speed
   100   174  100   116  100    58  30550  15275 --:--:-- --:--:-- --:--:-- 38666
   {"header":{"cluster_id":"14378065948964416658","member_id":"5786953710659384407","revision":"314","raft_term":"25"}}
   curl http://10.193.161.151:2389/v3/kv/put -X POST -d '{"value":"aW5pdF9kaXI=", "key":"L2FwaXNpeC9ub2RlX3N0YXR1cy8="}' --connect-timeout 30 --max-time 60 --retry 1 2>&1
     % Total    % Received % Xferd  Average Speed   Time    Time     Time  Current
                                    Dload  Upload   Total   Spent    Left  Speed
   100   178  100   116  100    62  30161  16120 --:--:-- --:--:-- --:--:-- 38666
   {"header":{"cluster_id":"14378065948964416658","member_id":"5786953710659384407","revision":"315","raft_term":"25"}}
   curl http://10.193.161.151:2389/v3/kv/put -X POST -d '{"value":"aW5pdF9kaXI=", "key":"L2FwaXNpeC9zc2wv"}' --connect-timeout 30 --max-time 60 --retry 1 2>&1
     % Total    % Received % Xferd  Average Speed   Time    Time     Time  Current
                                    Dload  Upload   Total   Spent    Left  Speed
   100   166  100   116  100    50  33362  14380 --:--:-- --:--:-- --:--:-- 38666
   {"header":{"cluster_id":"14378065948964416658","member_id":"5786953710659384407","revision":"316","raft_term":"25"}}
   curl http://10.193.161.151:2389/v3/kv/put -X POST -d '{"value":"aW5pdF9kaXI=", "key":"L2FwaXNpeC9nbG9iYWxfcnVsZXMv"}' --connect-timeout 30 --max-time 60 --retry 1 2>&1
     % Total    % Received % Xferd  Average Speed   Time    Time     Time  Current
                                    Dload  Upload   Total   Spent    Left  Speed
   100   178  100   116  100    62  32115  17165 --:--:-- --:--:-- --:--:-- 38666
   {"header":{"cluster_id":"14378065948964416658","member_id":"5786953710659384407","revision":"317","raft_term":"25"}}
   curl http://10.193.161.151:2389/v3/kv/put -X POST -d '{"value":"aW5pdF9kaXI=", "key":"L2FwaXNpeC9zdHJlYW1fcm91dGVzLw=="}' --connect-timeout 30 --max-time 60 --retry 1 2>&1
     % Total    % Received % Xferd  Average Speed   Time    Time     Time  Current
                                    Dload  Upload   Total   Spent    Left  Speed
   100   182  100   116  100    66  36261  20631 --:--:-- --:--:-- --:--:-- 38666
   {"header":{"cluster_id":"14378065948964416658","member_id":"5786953710659384407","revision":"318","raft_term":"25"}}
   curl http://10.193.161.151:2389/v3/kv/put -X POST -d '{"value":"aW5pdF9kaXI=", "key":"L2FwaXNpeC9wcm90by8="}' --connect-timeout 30 --max-time 60 --retry 1 2>&1
     % Total    % Received % Xferd  Average Speed   Time    Time     Time  Current
                                    Dload  Upload   Total   Spent    Left  Speed
   100   170  100   116  100    54  30374  14139 --:--:-- --:--:-- --:--:-- 38666
   {"header":{"cluster_id":"14378065948964416658","member_id":"5786953710659384407","revision":"319","raft_term":"25"}}
   curl http://10.193.161.151:2389/v3/kv/put -X POST -d '{"value":"aW5pdF9kaXI=", "key":"L2FwaXNpeC9wbHVnaW5fbWV0YWRhdGEv"}' --connect-timeout 30 --max-time 60 --retry 1 2>&1
     % Total    % Received % Xferd  Average Speed   Time    Time     Time  Current
                                    Dload  Upload   Total   Spent    Left  Speed
   100   182  100   116  100    66  33029  18792 --:--:-- --:--:-- --:--:-- 38666
   {"header":{"cluster_id":"14378065948964416658","member_id":"5786953710659384407","revision":"320","raft_term":"25"}}


----------------------------------------------------------------
This is an automated message from the Apache Git Service.
To respond to the message, please log on to GitHub and use the
URL above to go to the specific comment.

For queries about this service, please contact Infrastructure at:
users@infra.apache.org
[GitHub] [apisix] membphis commented on issue #2919: bug: failed to fetch data from etcd: failed to watch data, response code: 404
Posted by GitBox <gi...@apache.org>.
membphis commented on issue #2919:
URL: https://github.com/apache/apisix/issues/2919#issuecomment-737082236


   how do you install the apisix? by rpm, docker or source code?


----------------------------------------------------------------
This is an automated message from the Apache Git Service.
To respond to the message, please log on to GitHub and use the
URL above to go to the specific comment.

For queries about this service, please contact Infrastructure at:
users@infra.apache.org