You are viewing a plain text version of this content. The canonical link for it is here.
Posted to commits@pulsar.apache.org by GitBox <gi...@apache.org> on 2020/06/18 14:44:31 UTC
[GitHub] [pulsar] julio666 opened a new issue #7304: Memory leak on broker with streaming spark application
julio666 opened a new issue #7304:
URL: https://github.com/apache/pulsar/issues/7304
**The bug**
On Kubernetes, we run a streaming spark application which uses pulsar-spark connector. As the spark application runs, it does a ton of requests on `/admin/v2/persistent/public/default/TOPIC_NAME/lastMessageId` ending up to the broker managing the topic (topic not being filled by any source during that time):
```
[...]
14:20:02.563 [bookkeeper-ml-workers-OrderedExecutor-0-0] INFO org.eclipse.jetty.server.RequestLog - 10.42.7.18 - - [18/Jun/2020:14:20:02 +0000] "GET /admin/v2/persistent/public/default/TOPIC_NAME/lastMessageId HTTP/1.1" 200 186 "-" "Pulsar-Java-v2.4.2" 4
14:20:02.583 [pulsar-web-42-4] INFO org.eclipse.jetty.server.RequestLog - 10.42.7.18 - - [18/Jun/2020:14:20:02 +0000] "GET /admin/v2/persistent/public/default/TOPIC_NAME/partitions HTTP/1.1" 200 16 "-" "Pulsar-Java-v2.4.2" 3
14:20:02.591 [bookkeeper-ml-workers-OrderedExecutor-0-0] INFO org.eclipse.jetty.server.RequestLog - 10.42.7.18 - - [18/Jun/2020:14:20:02 +0000] "GET /admin/v2/persistent/public/default/TOPIC_NAME/lastMessageId HTTP/1.1" 200 186 "-" "Pulsar-Java-v2.4.2" 4
14:20:02.610 [pulsar-web-42-1] INFO org.eclipse.jetty.server.RequestLog - 10.42.7.18 - - [18/Jun/2020:14:20:02 +0000] "GET /admin/v2/persistent/public/default/TOPIC_NAME/partitions HTTP/1.1" 200 16 "-" "Pulsar-Java-v2.4.2" 3
14:20:02.618 [bookkeeper-ml-workers-OrderedExecutor-0-0] INFO org.eclipse.jetty.server.RequestLog - 10.42.7.18 - - [18/Jun/2020:14:20:02 +0000] "GET /admin/v2/persistent/public/default/TOPIC_NAME/lastMessageId HTTP/1.1" 200 186 "-" "Pulsar-Java-v2.4.2" 4
14:20:02.637 [pulsar-web-42-8] INFO org.eclipse.jetty.server.RequestLog - 10.42.7.18 - - [18/Jun/2020:14:20:02 +0000] "GET /admin/v2/persistent/public/default/TOPIC_NAME/partitions HTTP/1.1" 200 16 "-" "Pulsar-Java-v2.4.2" 3
14:20:02.645 [bookkeeper-ml-workers-OrderedExecutor-0-0] INFO org.eclipse.jetty.server.RequestLog - 10.42.7.18 - - [18/Jun/2020:14:20:02 +0000] "GET /admin/v2/persistent/public/default/TOPIC_NAME/lastMessageId HTTP/1.1" 200 186 "-" "Pulsar-Java-v2.4.2" 4
14:20:02.664 [pulsar-web-42-7] INFO org.eclipse.jetty.server.RequestLog - 10.42.7.18 - - [18/Jun/2020:14:20:02 +0000] "GET /admin/v2/persistent/public/default/KDECOLEAPP_ANONYMISE/partitions HTTP/1.1" 200 16 "-" "Pulsar-Java-v2.4.2" 3
14:20:02.672 [bookkeeper-ml-workers-OrderedExecutor-0-0] INFO org.eclipse.jetty.server.RequestLog - 10.42.7.18 - - [18/Jun/2020:14:20:02 +0000] "GET /admin/v2/persistent/public/default/TOPIC_NAME/lastMessageId HTTP/1.1" 200 186 "-" "Pulsar-Java-v2.4.2" 4
14:20:02.692 [pulsar-web-42-4] INFO org.eclipse.jetty.server.RequestLog - 10.42.7.18 - - [18/Jun/2020:14:20:02 +0000] "GET /admin/v2/persistent/public/default/TOPIC_NAME/partitions HTTP/1.1" 200 16 "-" "Pulsar-Java-v2.4.2" 3
14:20:02.700 [bookkeeper-ml-workers-OrderedExecutor-0-0] INFO org.eclipse.jetty.server.RequestLog - 10.42.7.18 - - [18/Jun/2020:14:20:02 +0000] "GET /admin/v2/persistent/public/default/TOPIC_NAME/lastMessageId HTTP/1.1" 200 186 "-" "Pulsar-Java-v2.4.2" 4
14:20:02.719 [pulsar-web-42-6] INFO org.eclipse.jetty.server.RequestLog - 10.42.7.18 - - [18/Jun/2020:14:20:02 +0000] "GET /admin/v2/persistent/public/default/TOPIC_NAME/partitions HTTP/1.1" 200 16 "-" "Pulsar-Java-v2.4.2" 3
[...]
```
And so on for a certain time. As the requests are going on, we can see a memory leak on grafana graph on the concerned broker (Direct Memory):
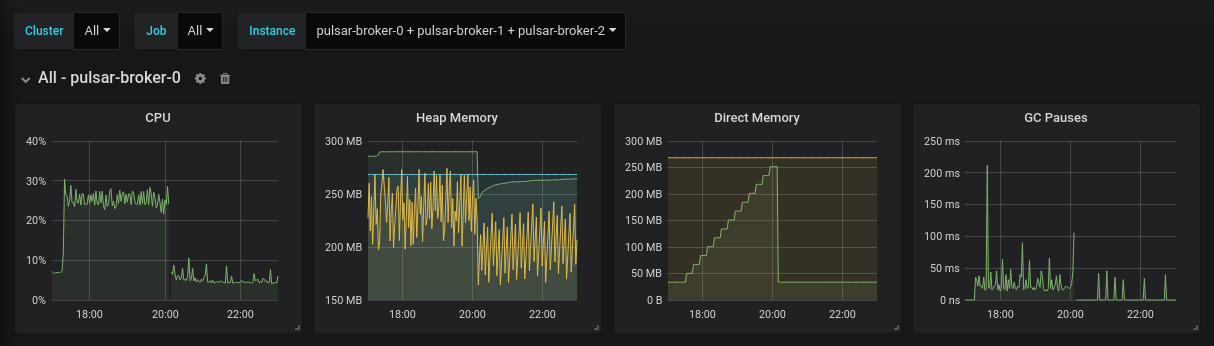
And when the limit is reached, the broker is killed by Kubernetes for an OOM.
**To Reproduce**
Steps to reproduce the behavior:
1. Deploy Pulsar with the helm chart with default values.yaml concerning `requests`
2. Run a streaming spark application feeding on a topic of Pulsar
3. Let it run
4. See error
**Expected behavior**
The broker should not go out of memory.
**Versions:**
- Pulsar 2.5.2
- Spark 2.4.5 in case you are familiar with Spark issues
----------------------------------------------------------------
This is an automated message from the Apache Git Service.
To respond to the message, please log on to GitHub and use the
URL above to go to the specific comment.
For queries about this service, please contact Infrastructure at:
users@infra.apache.org
[GitHub] [pulsar] lhotari commented on issue #7304: Memory leak on broker with streaming Spark application
Posted by GitBox <gi...@apache.org>.
lhotari commented on issue #7304:
URL: https://github.com/apache/pulsar/issues/7304#issuecomment-699128146


   #8138 might be related. Please check since it's also about lastmessageid requests.


----------------------------------------------------------------
This is an automated message from the Apache Git Service.
To respond to the message, please log on to GitHub and use the
URL above to go to the specific comment.

For queries about this service, please contact Infrastructure at:
users@infra.apache.org
[GitHub] [pulsar] lhotari commented on issue #7304: Memory leak on broker with streaming Spark application
Posted by GitBox <gi...@apache.org>.
lhotari commented on issue #7304:
URL: https://github.com/apache/pulsar/issues/7304#issuecomment-864194286


   > It's easy to reproduce, even with curl. e.g. `while true; do curl http://<admin IP:port>/admin/v2/persistent/public/default/some_topic/lastMessageId; done`

   Thank you @megfigura . This was very helpful. I have create a PR to fix the direct memory leak: #10977 . Would you be able to verify the fix in your environment? There are instructions in https://github.com/apache/pulsar#build-custom-docker-images for building custom docker images.


--
This is an automated message from the Apache Git Service.
To respond to the message, please log on to GitHub and use the
URL above to go to the specific comment.

For queries about this service, please contact Infrastructure at:
users@infra.apache.org
[GitHub] [pulsar] lhotari edited a comment on issue #7304: Memory leak on broker with streaming Spark application
Posted by GitBox <gi...@apache.org>.
lhotari edited a comment on issue #7304:
URL: https://github.com/apache/pulsar/issues/7304#issuecomment-864194286


   > It's easy to reproduce, even with curl. e.g. `while true; do curl http://<admin IP:port>/admin/v2/persistent/public/default/some_topic/lastMessageId; done`

   Thank you @megfigura . This was very helpful. I have created a PR to fix the direct memory leak: #10977 . Would you be able to verify the fix in your environment? There are instructions in https://github.com/apache/pulsar#build-custom-docker-images for building custom docker images.


--
This is an automated message from the Apache Git Service.
To respond to the message, please log on to GitHub and use the
URL above to go to the specific comment.

For queries about this service, please contact Infrastructure at:
users@infra.apache.org
[GitHub] [pulsar] merlimat closed issue #7304: Memory leak on broker with streaming Spark application
Posted by GitBox <gi...@apache.org>.
merlimat closed issue #7304:
URL: https://github.com/apache/pulsar/issues/7304


--
This is an automated message from the Apache Git Service.
To respond to the message, please log on to GitHub and use the
URL above to go to the specific comment.

For queries about this service, please contact Infrastructure at:
users@infra.apache.org
[GitHub] [pulsar] megfigura commented on issue #7304: Memory leak on broker with streaming Spark application
Posted by GitBox <gi...@apache.org>.
megfigura commented on issue #7304:
URL: https://github.com/apache/pulsar/issues/7304#issuecomment-854943245


   Also hit this issue with a similar use-case (creating batches for a Spark application). The issue is still present in the latest 2.7 branch as of commit 6bbb8d5c34d59a3a2cdd88e3e091de37b60d274a, though the leak I see is much slower than the one pictured in the screenshot above, so I wonder if the problem has been partially fixed since 2.5.2.

   It's easy to reproduce, even with curl. e.g. `while true; do curl http://<admin IP:port>/admin/v2/persistent/public/default/some_topic/lastMessageId; done`

   If you enable Netty leak detection (`-Dpulsar.allocator.leak_detection=Advanced -Dio.netty.leakDetectionLevel=advanced -Dio.netty.leakDetection.targetRecords=30`) LEAK messages start showing up almost immediately. After the first few messages, they seem to show up more consistently if data is being produced to the topic, though it will still happen regardless. Maybe producing data just causes GCs to happen more consistently so the Netty leak detection kicks in.


--
This is an automated message from the Apache Git Service.
To respond to the message, please log on to GitHub and use the
URL above to go to the specific comment.

For queries about this service, please contact Infrastructure at:
users@infra.apache.org