You are viewing a plain text version of this content. The canonical link for it is here.
Posted to notifications@apisix.apache.org by GitBox <gi...@apache.org> on 2022/05/01 13:53:26 UTC
[GitHub] [apisix] bisakhmondal commented on pull request #6616: docs: add datadog document(zh)
bisakhmondal commented on PR #6616:
URL: https://github.com/apache/apisix/pull/6616#issuecomment-1114244227
> Look like Kong also uses Timer: https://github.com/Kong/kong/blob/0973036503941c52c56f8a1be74b686a62a40cdd/kong/plugins/datadog/schema.lua#L44
>
> I would prefer to wait for @bisakhmondal to confirm it.
Hey guys, really sorry. I somehow missed the earlier notifications from the mention. Please don't mind.
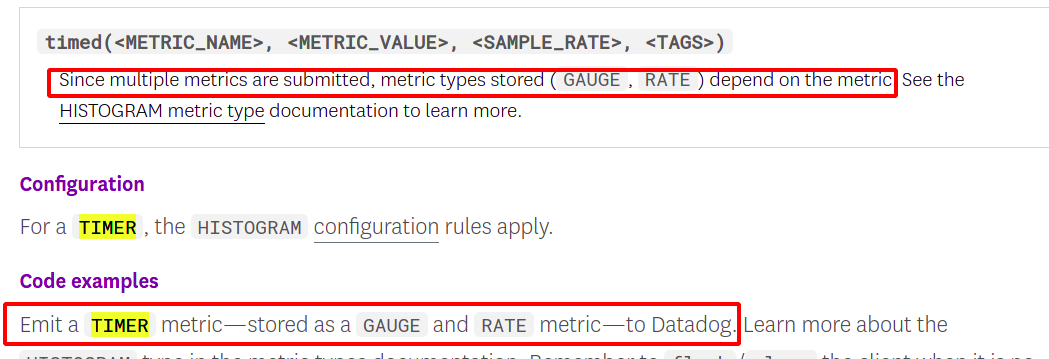
Now coming back to the actual issue, in practice a gauge data type should be more than sufficient for this case (as people mostly interested in the total bytes transferred (ingress or egress) in a particular time slice). Yes, as @spacewander pointed out, during the development of MVP, I choose the default type as Timer. This should be fine here as though there are many metric types supported through UDP calls to locally run datadog agent, whenever these metrics get exported to datadog web (the dashboard) these gets fanned out to generally 4 basic metric type and they are [ref](https://docs.datadoghq.com/metrics/types/?tab=count)
- COUNT
- RATE
- GAUGE
- DISTRIBUTION
and taken from the documentation
`Emit a TIMER metric—stored as a GAUGE and RATE metric—to Datadog`
**So I think, users should be fine here and we can eliminate the possibility of introducing a bug unintentionally during the development phase.**
Moreover, I and @spacewander wanted to develop a minimal PR for the MVP and later support the mapping of `<metric_name>:<metric_type>` in later revisions so that users can choose the metric type that they need for the exported metrics.
============================================================================================
Just a random thought and a proposal on this context, a monitoring system like Prometheus uses a pull-based approach for metrics exposition - which makes it not suitable for integration with faas services (though there is push gateway but it's not perfect). Also in a highly dynamic environment when systems (IPs for prom config) are spinning up and down uncontrollably though some external system, can we take down some of the burden of the users and help them export a subset of metrics from the data of response of the HTTP headers.
Users might be interested in fine grained details, for example how much time a particular db call take instead of the whole `upstream_latency` metric. They can share the information from the upstream response through like `POSTGRES_LATENCY: 166ms`, and we the APISIX system, on their behalf export the data to the monitoring service.
===========================================================================================
cc @moonming
--
This is an automated message from the Apache Git Service.
To respond to the message, please log on to GitHub and use the
URL above to go to the specific comment.
To unsubscribe, e-mail: notifications-unsubscribe@apisix.apache.org
For queries about this service, please contact Infrastructure at:
users@infra.apache.org