You are viewing a plain text version of this content. The canonical link for it is here.
Posted to commits@echarts.apache.org by GitBox <gi...@apache.org> on 2021/08/06 02:40:36 UTC
[GitHub] [echarts] RomanOlegovich opened a new issue #15488: Display the nearest data of different series in one tooltip.
RomanOlegovich opened a new issue #15488:
URL: https://github.com/apache/echarts/issues/15488


   ### What problem does this feature solve?
   Is there a way to show the nearest data of different series in one tooltip?

   Several series with a common x-axis are displayed on the chart.
   Although the time between values may differ, I would like to display a general hint if the time difference is no more than a few seconds.
   There can be about 8 series on the chart, a series of 30k - 100k points long, it is large dataset to dynamic search nearest data on tooltip formatter, also dynamic search is very slow. Store nearest data for each point is bad way also it's slow too.

   Chart options:
   The x-axis is time, the y-axis is value.

   the x-axis is time, the y-axis is the value.
   Example:
   ```
   Series 1: [{x: 1 ms}, {x: 3 ms}, {x: 5 ms}]
   Series 2: [{x: 0 ms}, {x: 2 ms}, {x: 6 ms}]
   ```

   ### What does the proposed API look like?
   May be

   ```
   tooltip: {
       nearest: true,
       formatter: (params: Object|Array, nearest: Object|Array) =>
   }
   ```

   <!-- This issue is generated by echarts-issue-helper. DO NOT REMOVE -->
   <!-- This issue is in English. DO NOT REMOVE -->


--
This is an automated message from the Apache Git Service.
To respond to the message, please log on to GitHub and use the
URL above to go to the specific comment.

To unsubscribe, e-mail: commits-unsubscribe@echarts.apache.org

For queries about this service, please contact Infrastructure at:
users@infra.apache.org


---------------------------------------------------------------------
To unsubscribe, e-mail: commits-unsubscribe@echarts.apache.org
For additional commands, e-mail: commits-help@echarts.apache.org
[GitHub] [echarts] RomanOlegovich commented on issue #15488: Display the nearest data of different series in one tooltip.
Posted by GitBox <gi...@apache.org>.
RomanOlegovich commented on issue #15488:
URL: https://github.com/apache/echarts/issues/15488#issuecomment-899211245
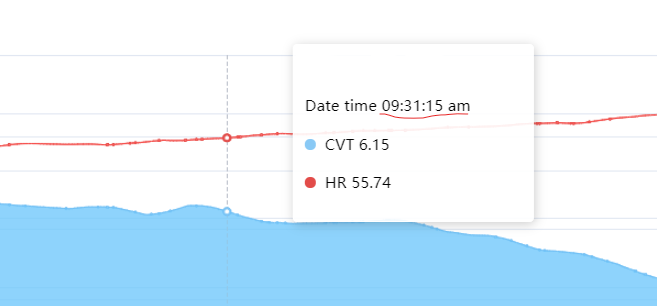
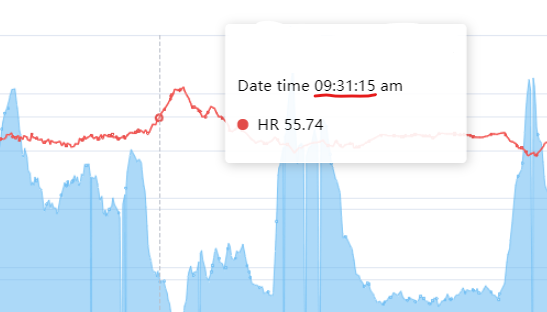
@Ovilia Also issue exists: after sampling not all series with same x-axis will display on single tooltip.
For this case configuration of snap threshold is required.
Should I open new issue or this is connected with current?
--
This is an automated message from the Apache Git Service.
To respond to the message, please log on to GitHub and use the
URL above to go to the specific comment.
To unsubscribe, e-mail: commits-unsubscribe@echarts.apache.org
For queries about this service, please contact Infrastructure at:
users@infra.apache.org
---------------------------------------------------------------------
To unsubscribe, e-mail: commits-unsubscribe@echarts.apache.org
For additional commands, e-mail: commits-help@echarts.apache.org
[GitHub] [echarts] RndRss commented on issue #15488: Display the nearest data of different series in one tooltip.
Posted by GitBox <gi...@apache.org>.
RndRss commented on issue #15488:
URL: https://github.com/apache/echarts/issues/15488#issuecomment-976539389


   +1 for this


--
This is an automated message from the Apache Git Service.
To respond to the message, please log on to GitHub and use the
URL above to go to the specific comment.

To unsubscribe, e-mail: commits-unsubscribe@echarts.apache.org

For queries about this service, please contact Infrastructure at:
users@infra.apache.org


---------------------------------------------------------------------
To unsubscribe, e-mail: commits-unsubscribe@echarts.apache.org
For additional commands, e-mail: commits-help@echarts.apache.org
[GitHub] [echarts] RomanOlegovich commented on issue #15488: Display the nearest data of different series in one tooltip.
Posted by GitBox <gi...@apache.org>.
RomanOlegovich commented on issue #15488:
URL: https://github.com/apache/echarts/issues/15488#issuecomment-899194416
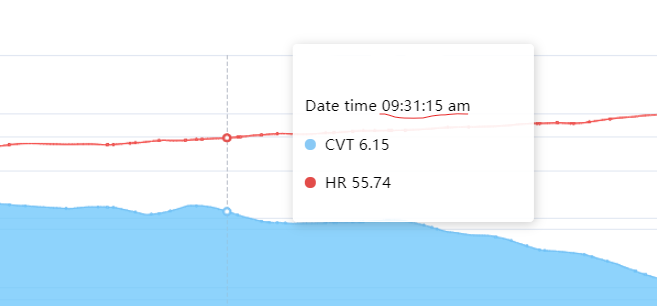
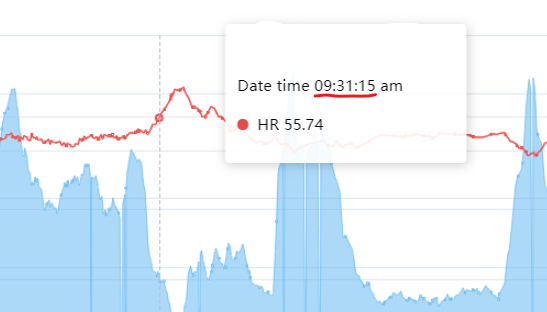
Also exist issue, after sampling (I use 'lttb', but for other this actual too) all series with same x-axis will not display on single tooltip.
Should I open new issue or this is connected with current?
--
This is an automated message from the Apache Git Service.
To respond to the message, please log on to GitHub and use the
URL above to go to the specific comment.
To unsubscribe, e-mail: commits-unsubscribe@echarts.apache.org
For queries about this service, please contact Infrastructure at:
users@infra.apache.org
---------------------------------------------------------------------
To unsubscribe, e-mail: commits-unsubscribe@echarts.apache.org
For additional commands, e-mail: commits-help@echarts.apache.org
[GitHub] [echarts] RomanOlegovich edited a comment on issue #15488: Display the nearest data of different series in one tooltip.
Posted by GitBox <gi...@apache.org>.
RomanOlegovich edited a comment on issue #15488:
URL: https://github.com/apache/echarts/issues/15488#issuecomment-896436019
Hi @Ovilia .
Yes I use 'axis' trigger.
I'm not sure what do "snap", but it doesn't work for me. Can snap threshold be configured to show nearby data of all series?
Here example of series, which should be in one tooltip.

--
This is an automated message from the Apache Git Service.
To respond to the message, please log on to GitHub and use the
URL above to go to the specific comment.
To unsubscribe, e-mail: commits-unsubscribe@echarts.apache.org
For queries about this service, please contact Infrastructure at:
users@infra.apache.org
---------------------------------------------------------------------
To unsubscribe, e-mail: commits-unsubscribe@echarts.apache.org
For additional commands, e-mail: commits-help@echarts.apache.org
[GitHub] [echarts] l1b3r edited a comment on issue #15488: Display the nearest data of different series in one tooltip.
Posted by GitBox <gi...@apache.org>.
l1b3r edited a comment on issue #15488:
URL: https://github.com/apache/echarts/issues/15488#issuecomment-1044209422
The workaround from @Methodician might be viable in cases when you know the sampling frequency beforehand. However, in more general cases when your data is of various sampling rate it unfortunately does not work. Some datasets don't have a data point that would round to a specific point on the `x` axis while other datasets can round down to the same `x` multiple times.
See the screenshot for an example of such scenario.

So, +1 from me for being able to snap the tooltip to the nearest point within a given margin of error.
P.S. Kudos to echarts for gracefully handling this weird yet peculiar edge case :)
--
This is an automated message from the Apache Git Service.
To respond to the message, please log on to GitHub and use the
URL above to go to the specific comment.
To unsubscribe, e-mail: commits-unsubscribe@echarts.apache.org
For queries about this service, please contact Infrastructure at:
users@infra.apache.org
---------------------------------------------------------------------
To unsubscribe, e-mail: commits-unsubscribe@echarts.apache.org
For additional commands, e-mail: commits-help@echarts.apache.org
[GitHub] [echarts] RomanOlegovich removed a comment on issue #15488: Display the nearest data of different series in one tooltip.
Posted by GitBox <gi...@apache.org>.
RomanOlegovich removed a comment on issue #15488:
URL: https://github.com/apache/echarts/issues/15488#issuecomment-899194416
Also exist issue, after sampling (I use 'lttb', but for other this actual too) all series with same x-axis will not display on single tooltip.
Should I open new issue or this is connected with current?


--
This is an automated message from the Apache Git Service.
To respond to the message, please log on to GitHub and use the
URL above to go to the specific comment.
To unsubscribe, e-mail: commits-unsubscribe@echarts.apache.org
For queries about this service, please contact Infrastructure at:
users@infra.apache.org
---------------------------------------------------------------------
To unsubscribe, e-mail: commits-unsubscribe@echarts.apache.org
For additional commands, e-mail: commits-help@echarts.apache.org
[GitHub] [echarts] Methodician edited a comment on issue #15488: Display the nearest data of different series in one tooltip.
Posted by GitBox <gi...@apache.org>.
Methodician edited a comment on issue #15488:
URL: https://github.com/apache/echarts/issues/15488#issuecomment-1036308337


   Found a workable work-around for folks in a similar situation to me...

   My sensors emit data every 5 minutes, so I'm rounding the time to the nearest 5 minutes and it works like a charm.
   I map through the readouts for each sensor to create my series. Here is some example code to get you started:

   `
    modulesWithReadouts.map(({ name, readouts }) => {
           const series: SeriesOption = {
             name,
             type: 'line',
             data: readouts.map((readout: any) => {
               const coeff = 1000 * 60 * 5; // 5 minutes
               return [
                 new Date(Math.round(readout.timestamp / coeff) * coeff),
                 readout.temperature,
               ];
             }),
           };
           return series;
         });
   `


--
This is an automated message from the Apache Git Service.
To respond to the message, please log on to GitHub and use the
URL above to go to the specific comment.

To unsubscribe, e-mail: commits-unsubscribe@echarts.apache.org

For queries about this service, please contact Infrastructure at:
users@infra.apache.org


---------------------------------------------------------------------
To unsubscribe, e-mail: commits-unsubscribe@echarts.apache.org
For additional commands, e-mail: commits-help@echarts.apache.org
[GitHub] [echarts] Raphyyy commented on issue #15488: Display the nearest data of different series in one tooltip.
Posted by GitBox <gi...@apache.org>.
Raphyyy commented on issue #15488:
URL: https://github.com/apache/echarts/issues/15488#issuecomment-966421387


   Hello I am giving a +1 on this.
   Typically I use Echarts to display time series from sensors and they don't emit values at the same time.
   The tooltip is quite useless and get flicky if time difference are not the same between data series :
   https://jsfiddle.net/x035faqe/2/
   `axisPointer.snap: true` do not seems to change something.
   I think it could be nice to have an option to get a tooltip that is constantly showing all series in it with the nearest value. Maybe an option to seek series' nearest point with a limit of `n` seconds to not display value `n` seconds far from each others in the same tooltip.


--
This is an automated message from the Apache Git Service.
To respond to the message, please log on to GitHub and use the
URL above to go to the specific comment.

To unsubscribe, e-mail: commits-unsubscribe@echarts.apache.org

For queries about this service, please contact Infrastructure at:
users@infra.apache.org


---------------------------------------------------------------------
To unsubscribe, e-mail: commits-unsubscribe@echarts.apache.org
For additional commands, e-mail: commits-help@echarts.apache.org
[GitHub] [echarts] Raphyyy commented on issue #15488: Display the nearest data of different series in one tooltip.
Posted by GitBox <gi...@apache.org>.
Raphyyy commented on issue #15488:
URL: https://github.com/apache/echarts/issues/15488#issuecomment-967030566


   Nice thanks!
   I think the actual implementation of `axisPointer.snap` if `true` is to magnet the axisPointer to the nearest point, no matter the series.
   The approach here is a bit different. The purpose is not to magnet axisPointer to the nearest point, it's to read all series' nearest point to get them in the tooltip, so I don't know if it is related to `axisPointer.snap` at the end.


--
This is an automated message from the Apache Git Service.
To respond to the message, please log on to GitHub and use the
URL above to go to the specific comment.

To unsubscribe, e-mail: commits-unsubscribe@echarts.apache.org

For queries about this service, please contact Infrastructure at:
users@infra.apache.org


---------------------------------------------------------------------
To unsubscribe, e-mail: commits-unsubscribe@echarts.apache.org
For additional commands, e-mail: commits-help@echarts.apache.org
[GitHub] [echarts] RomanOlegovich edited a comment on issue #15488: Display the nearest data of different series in one tooltip.
Posted by GitBox <gi...@apache.org>.
RomanOlegovich edited a comment on issue #15488:
URL: https://github.com/apache/echarts/issues/15488#issuecomment-896436019
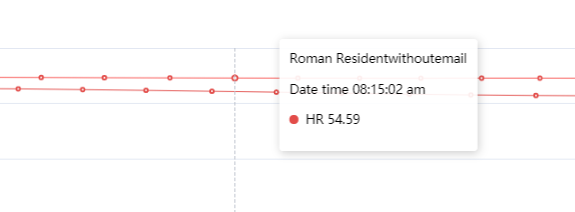
Hi @Ovilia .
Yes I use 'axis' trigger.
Snap doesn't work for me. Can snap threshold be configured to show nearby data of all series?
Here example of series, which should be in one tooltip.
--
This is an automated message from the Apache Git Service.
To respond to the message, please log on to GitHub and use the
URL above to go to the specific comment.
To unsubscribe, e-mail: commits-unsubscribe@echarts.apache.org
For queries about this service, please contact Infrastructure at:
users@infra.apache.org
---------------------------------------------------------------------
To unsubscribe, e-mail: commits-unsubscribe@echarts.apache.org
For additional commands, e-mail: commits-help@echarts.apache.org
[GitHub] [echarts] Methodician commented on issue #15488: Display the nearest data of different series in one tooltip.
Posted by GitBox <gi...@apache.org>.
Methodician commented on issue #15488:
URL: https://github.com/apache/echarts/issues/15488#issuecomment-1036295620


   +1 to this too! I just wrestled with this issue for days-worth of "spare time" until I finally generated some test data to realize what was causing my tooltip to not display as intended. I'm also using echarts to show time series from sensors, which never emit data at the exact same time.

   I would like this feature very much (forcing tooltip to display all series to the nearest timeslot on hover).

   If library managers are so concerned with misleading the viewer, one possibility would be to also display the timestamp for each series on the tooltip, instead of just the one. However, I would be happy if the tooltip just displayed the time where it was triggered, or the time of the first series it reads, or just about anyting.


--
This is an automated message from the Apache Git Service.
To respond to the message, please log on to GitHub and use the
URL above to go to the specific comment.

To unsubscribe, e-mail: commits-unsubscribe@echarts.apache.org

For queries about this service, please contact Infrastructure at:
users@infra.apache.org


---------------------------------------------------------------------
To unsubscribe, e-mail: commits-unsubscribe@echarts.apache.org
For additional commands, e-mail: commits-help@echarts.apache.org
[GitHub] [echarts] l1b3r edited a comment on issue #15488: Display the nearest data of different series in one tooltip.
Posted by GitBox <gi...@apache.org>.
l1b3r edited a comment on issue #15488:
URL: https://github.com/apache/echarts/issues/15488#issuecomment-1044209422
The workaround from @Methodician might be viable in cases when you know the sampling frequency beforehand. However, in more general cases when your data is of various sampling rate it unfortunately does not work. Some datasets don't have a data point that would round to a specific point on the `x` axis while other datasets can round down to the same `x` multiple times.
See the screenshot for an example of such scenario.

So, +1 from me for being able to snap the tooltip to the nearest point within a given margin of error.
P.S. Kudos to echarts for gracefully handling this weird yet peculiar edge case :)
P.S. 2: Turns out I already filed a feature request for the exact same thing more than a year ago :) https://github.com/apache/echarts/issues/13389
--
This is an automated message from the Apache Git Service.
To respond to the message, please log on to GitHub and use the
URL above to go to the specific comment.
To unsubscribe, e-mail: commits-unsubscribe@echarts.apache.org
For queries about this service, please contact Infrastructure at:
users@infra.apache.org
---------------------------------------------------------------------
To unsubscribe, e-mail: commits-unsubscribe@echarts.apache.org
For additional commands, e-mail: commits-help@echarts.apache.org
[GitHub] [echarts] RomanOlegovich edited a comment on issue #15488: Display the nearest data of different series in one tooltip.
Posted by GitBox <gi...@apache.org>.
RomanOlegovich edited a comment on issue #15488:
URL: https://github.com/apache/echarts/issues/15488#issuecomment-899211245


   @Ovilia Also issue exists: [after sampling not all series with same x-axis will display on single tooltip](https://github.com/apache/echarts/issues/15538).
   May be current issue is connected.


--
This is an automated message from the Apache Git Service.
To respond to the message, please log on to GitHub and use the
URL above to go to the specific comment.

To unsubscribe, e-mail: commits-unsubscribe@echarts.apache.org

For queries about this service, please contact Infrastructure at:
users@infra.apache.org


---------------------------------------------------------------------
To unsubscribe, e-mail: commits-unsubscribe@echarts.apache.org
For additional commands, e-mail: commits-help@echarts.apache.org
[GitHub] [echarts] RomanOlegovich edited a comment on issue #15488: Display the nearest data of different series in one tooltip.
Posted by GitBox <gi...@apache.org>.
RomanOlegovich edited a comment on issue #15488:
URL: https://github.com/apache/echarts/issues/15488#issuecomment-899211245
@Ovilia Also issue exists: after sampling not all series with same x-axis will display on single tooltip.
For this case configuration of snap threshold is required.
Should I open new issue or this is connected with current?
Reproduce:
```
myChart.setOption({
series:[
{
sampling: 'lttb',
type: 'line',
data: Array.from(new Array(2000)).map((x, i) => [new Date(i * 100000), Math.floor(Math.random() * (5 - 1 + 1)) + 1]),
},
{
sampling: 'lttb',
type: 'line',
data: Array.from(new Array(2000)).map((x, i) => [new Date(i * 100000), Math.floor(Math.random() * (10 - 1 + 1)) + 1]),
}
],
xAxis:[{type:'time'}],
yAxis:[{type:'value', max: 15, min: 0}],
tooltip: {
trigger: 'axis',
},
dataZoom: [
{
xAxisIndex: [0, 1],
type: 'inside',
filterMode: 'filter'
}
]
})
```


--
This is an automated message from the Apache Git Service.
To respond to the message, please log on to GitHub and use the
URL above to go to the specific comment.
To unsubscribe, e-mail: commits-unsubscribe@echarts.apache.org
For queries about this service, please contact Infrastructure at:
users@infra.apache.org
---------------------------------------------------------------------
To unsubscribe, e-mail: commits-unsubscribe@echarts.apache.org
For additional commands, e-mail: commits-help@echarts.apache.org
[GitHub] [echarts] RomanOlegovich commented on issue #15488: Display the nearest data of different series in one tooltip.
Posted by GitBox <gi...@apache.org>.
RomanOlegovich commented on issue #15488:
URL: https://github.com/apache/echarts/issues/15488#issuecomment-898098103


   Is it possible with current library implementation?


--
This is an automated message from the Apache Git Service.
To respond to the message, please log on to GitHub and use the
URL above to go to the specific comment.

To unsubscribe, e-mail: commits-unsubscribe@echarts.apache.org

For queries about this service, please contact Infrastructure at:
users@infra.apache.org


---------------------------------------------------------------------
To unsubscribe, e-mail: commits-unsubscribe@echarts.apache.org
For additional commands, e-mail: commits-help@echarts.apache.org
[GitHub] [echarts] Methodician commented on issue #15488: Display the nearest data of different series in one tooltip.
Posted by GitBox <gi...@apache.org>.
Methodician commented on issue #15488:
URL: https://github.com/apache/echarts/issues/15488#issuecomment-1036308337


   Found a workable work-around for folks in a similar situation to me...

   My sensors emit data every 5 minutes, so I'm rounding the time to the nearest 5 minutes and it works like a charm.
   I map through the readouts for each sensor to create my series. Here is some example code to get you started:

   `
    const moduleSeries = modulesWithReadouts.map(({ name, readouts }) => {
           const series: SeriesOption = {
             name,
             type: 'line',
             data: readouts.map((readout: any) => {
               const coeff = 1000 * 60 * 5; // 5 minutes
               return [
                 new Date(Math.round(readout.timestamp / coeff) * coeff),
                 readout.temperature,
               ];
             }),
           };
           return series;
         });
   `


--
This is an automated message from the Apache Git Service.
To respond to the message, please log on to GitHub and use the
URL above to go to the specific comment.

To unsubscribe, e-mail: commits-unsubscribe@echarts.apache.org

For queries about this service, please contact Infrastructure at:
users@infra.apache.org


---------------------------------------------------------------------
To unsubscribe, e-mail: commits-unsubscribe@echarts.apache.org
For additional commands, e-mail: commits-help@echarts.apache.org
[GitHub] [echarts] Ovilia commented on issue #15488: Display the nearest data of different series in one tooltip.
Posted by GitBox <gi...@apache.org>.
Ovilia commented on issue #15488:
URL: https://github.com/apache/echarts/issues/15488#issuecomment-898147361


   No, it is not supported yet. Because we believe this will mislead the user to believe the second series also share the x value of the tooltip position.
   If you need to implement this, you can get the x value with event and use a for loop to calculate the nearest value in each series and set to the tooltip formatter.


--
This is an automated message from the Apache Git Service.
To respond to the message, please log on to GitHub and use the
URL above to go to the specific comment.

To unsubscribe, e-mail: commits-unsubscribe@echarts.apache.org

For queries about this service, please contact Infrastructure at:
users@infra.apache.org


---------------------------------------------------------------------
To unsubscribe, e-mail: commits-unsubscribe@echarts.apache.org
For additional commands, e-mail: commits-help@echarts.apache.org
[GitHub] [echarts] RomanOlegovich edited a comment on issue #15488: Display the nearest data of different series in one tooltip.
Posted by GitBox <gi...@apache.org>.
RomanOlegovich edited a comment on issue #15488:
URL: https://github.com/apache/echarts/issues/15488#issuecomment-899211245


   @Ovilia Also issue exists: [after sampling not all series with same x-axis will display on single tooltip](https://github.com/apache/echarts/issues/15538).
   May current issue is connected


--
This is an automated message from the Apache Git Service.
To respond to the message, please log on to GitHub and use the
URL above to go to the specific comment.

To unsubscribe, e-mail: commits-unsubscribe@echarts.apache.org

For queries about this service, please contact Infrastructure at:
users@infra.apache.org


---------------------------------------------------------------------
To unsubscribe, e-mail: commits-unsubscribe@echarts.apache.org
For additional commands, e-mail: commits-help@echarts.apache.org
[GitHub] [echarts] RomanOlegovich edited a comment on issue #15488: Display the nearest data of different series in one tooltip.
Posted by GitBox <gi...@apache.org>.
RomanOlegovich edited a comment on issue #15488:
URL: https://github.com/apache/echarts/issues/15488#issuecomment-899211245
@Ovilia Also issue exists: after sampling not all series with same x-axis will display on single tooltip.
Should I open new issue or this is connected with current?
Reproduce:
```
myChart.setOption({
series:[
{
sampling: 'lttb',
type: 'line',
data: Array.from(new Array(2000)).map((x, i) => [i, Math.floor(Math.random() * (5 - 1 + 1)) + 1]),
},
{
sampling: 'lttb',
type: 'line',
data: Array.from(new Array(2000)).map((x, i) => [i, Math.floor(Math.random() * (10 - 1 + 1)) + 1]),
}
],
xAxis:[{type:'value'}],
yAxis:[{type:'value', max: 15, min: 0}],
tooltip: {
trigger: 'axis',
},
dataZoom: [
{
xAxisIndex: [0, 1],
type: 'inside',
filterMode: 'filter'
}
]
})
```


--
This is an automated message from the Apache Git Service.
To respond to the message, please log on to GitHub and use the
URL above to go to the specific comment.
To unsubscribe, e-mail: commits-unsubscribe@echarts.apache.org
For queries about this service, please contact Infrastructure at:
users@infra.apache.org
---------------------------------------------------------------------
To unsubscribe, e-mail: commits-unsubscribe@echarts.apache.org
For additional commands, e-mail: commits-help@echarts.apache.org
[GitHub] [echarts] Wintermute79 commented on issue #15488: Display the nearest data of different series in one tooltip.
Posted by GitBox <gi...@apache.org>.
Wintermute79 commented on issue #15488:
URL: https://github.com/apache/echarts/issues/15488#issuecomment-1024496908


   +1 continuous reading of all series values at any x point would be nice - even if it's interpolated when there is no real value for a series at this x.


--
This is an automated message from the Apache Git Service.
To respond to the message, please log on to GitHub and use the
URL above to go to the specific comment.

To unsubscribe, e-mail: commits-unsubscribe@echarts.apache.org

For queries about this service, please contact Infrastructure at:
users@infra.apache.org


---------------------------------------------------------------------
To unsubscribe, e-mail: commits-unsubscribe@echarts.apache.org
For additional commands, e-mail: commits-help@echarts.apache.org
[GitHub] [echarts] RomanOlegovich edited a comment on issue #15488: Display the nearest data of different series in one tooltip.
Posted by GitBox <gi...@apache.org>.
RomanOlegovich edited a comment on issue #15488:
URL: https://github.com/apache/echarts/issues/15488#issuecomment-896436019
Hi @Ovilia .
Yes I use 'axis' trigger.
I'm not sure what do "snap", but it doesn't work for me. Can snap threshold be configured to show nearby data of all series?
Here example of series, which should be in one tooltip.

--
This is an automated message from the Apache Git Service.
To respond to the message, please log on to GitHub and use the
URL above to go to the specific comment.
To unsubscribe, e-mail: commits-unsubscribe@echarts.apache.org
For queries about this service, please contact Infrastructure at:
users@infra.apache.org
---------------------------------------------------------------------
To unsubscribe, e-mail: commits-unsubscribe@echarts.apache.org
For additional commands, e-mail: commits-help@echarts.apache.org
[GitHub] [echarts] Ovilia commented on issue #15488: Display the nearest data of different series in one tooltip.
Posted by GitBox <gi...@apache.org>.
Ovilia commented on issue #15488:
URL: https://github.com/apache/echarts/issues/15488#issuecomment-895004202


   Are you using `'axis'` for [trigger](https://echarts.apache.org/en/option.html#tooltip.trigger)? Does [snap](https://echarts.apache.org/en/option.html#tooltip.axisPointer.snap) work for you? It may probably show series with the exact x value rather than nearby data of all series as you expected. I'm not sure if this will confuse the user to think that all series have the exact x value but in fact not?


--
This is an automated message from the Apache Git Service.
To respond to the message, please log on to GitHub and use the
URL above to go to the specific comment.

To unsubscribe, e-mail: commits-unsubscribe@echarts.apache.org

For queries about this service, please contact Infrastructure at:
users@infra.apache.org


---------------------------------------------------------------------
To unsubscribe, e-mail: commits-unsubscribe@echarts.apache.org
For additional commands, e-mail: commits-help@echarts.apache.org
[GitHub] [echarts] RomanOlegovich commented on issue #15488: Display the nearest data of different series in one tooltip.
Posted by GitBox <gi...@apache.org>.
RomanOlegovich commented on issue #15488:
URL: https://github.com/apache/echarts/issues/15488#issuecomment-896436019


   Hi @Ovilia .
   Yes I use 'axis' trigger.
   Default value of snap is true, then I use snap. But it doesn't work for me. Can snap threshold be configured to show nearby data of all series?


--
This is an automated message from the Apache Git Service.
To respond to the message, please log on to GitHub and use the
URL above to go to the specific comment.

To unsubscribe, e-mail: commits-unsubscribe@echarts.apache.org

For queries about this service, please contact Infrastructure at:
users@infra.apache.org


---------------------------------------------------------------------
To unsubscribe, e-mail: commits-unsubscribe@echarts.apache.org
For additional commands, e-mail: commits-help@echarts.apache.org
[GitHub] [echarts] RomanOlegovich edited a comment on issue #15488: Display the nearest data of different series in one tooltip.
Posted by GitBox <gi...@apache.org>.
RomanOlegovich edited a comment on issue #15488:
URL: https://github.com/apache/echarts/issues/15488#issuecomment-899211245
@Ovilia Also issue exists: after sampling not all series with same x-axis will display on single tooltip.
Should I open new issue or this is connected with current?
Reproduce:
```
myChart.setOption({
series:[
{
sampling: 'lttb',
type: 'line',
data: Array.from(new Array(2000)).map((x, i) => [new Date(i * 100000), Math.floor(Math.random() * (5 - 1 + 1)) + 1]),
},
{
sampling: 'lttb',
type: 'line',
data: Array.from(new Array(2000)).map((x, i) => [new Date(i * 100000), Math.floor(Math.random() * (10 - 1 + 1)) + 1]),
}
],
xAxis:[{type:'time'}],
yAxis:[{type:'value', max: 15, min: 0}],
tooltip: {
trigger: 'axis',
},
dataZoom: [
{
xAxisIndex: [0, 1],
type: 'inside',
filterMode: 'filter'
}
]
})
```


--
This is an automated message from the Apache Git Service.
To respond to the message, please log on to GitHub and use the
URL above to go to the specific comment.
To unsubscribe, e-mail: commits-unsubscribe@echarts.apache.org
For queries about this service, please contact Infrastructure at:
users@infra.apache.org
---------------------------------------------------------------------
To unsubscribe, e-mail: commits-unsubscribe@echarts.apache.org
For additional commands, e-mail: commits-help@echarts.apache.org
[GitHub] [echarts] Ovilia commented on issue #15488: Display the nearest data of different series in one tooltip.
Posted by GitBox <gi...@apache.org>.
Ovilia commented on issue #15488:
URL: https://github.com/apache/echarts/issues/15488#issuecomment-898147832


   We could consider providing an extra option to enabled this new feature. To be discussed later.


--
This is an automated message from the Apache Git Service.
To respond to the message, please log on to GitHub and use the
URL above to go to the specific comment.

To unsubscribe, e-mail: commits-unsubscribe@echarts.apache.org

For queries about this service, please contact Infrastructure at:
users@infra.apache.org


---------------------------------------------------------------------
To unsubscribe, e-mail: commits-unsubscribe@echarts.apache.org
For additional commands, e-mail: commits-help@echarts.apache.org
[GitHub] [echarts] echarts-bot[bot] commented on issue #15488: Display the nearest data of different series in one tooltip.
Posted by GitBox <gi...@apache.org>.
echarts-bot[bot] commented on issue #15488:
URL: https://github.com/apache/echarts/issues/15488#issuecomment-893959816


   Hi! We've received your issue and please be patient to get responded. 🎉
   The average response time is expected to be within one day for weekdays.

   In the meanwhile, please make sure that it contains **a minimum reproducible demo** and necessary **images** to illustrate. Otherwise, our committers will ask you to do so.

   *A minimum reproducible demo* should contain as little data and components as possible but can still illustrate your problem. This is the best way for us to reproduce it and solve the problem faster.

   You may also check out the [API](http://echarts.apache.org/api.html) and [chart option](http://echarts.apache.org/option.html) to get the answer.

   If you don't get helped for a long time (over a week) or have an urgent question to ask, you may also send an email to dev@echarts.apache.org. Please attach the issue link if it's a technical question.

   If you are interested in the project, you may also subscribe our [mailing list](https://echarts.apache.org/en/maillist.html).

   Have a nice day! 🍵


--
This is an automated message from the Apache Git Service.
To respond to the message, please log on to GitHub and use the
URL above to go to the specific comment.

To unsubscribe, e-mail: commits-unsubscribe@echarts.apache.org

For queries about this service, please contact Infrastructure at:
users@infra.apache.org


---------------------------------------------------------------------
To unsubscribe, e-mail: commits-unsubscribe@echarts.apache.org
For additional commands, e-mail: commits-help@echarts.apache.org
[GitHub] [echarts] petrjahoda commented on issue #15488: Display the nearest data of different series in one tooltip.
Posted by GitBox <gi...@apache.org>.
petrjahoda commented on issue #15488:
URL: https://github.com/apache/echarts/issues/15488#issuecomment-979334353


   +1 for this too


--
This is an automated message from the Apache Git Service.
To respond to the message, please log on to GitHub and use the
URL above to go to the specific comment.

To unsubscribe, e-mail: commits-unsubscribe@echarts.apache.org

For queries about this service, please contact Infrastructure at:
users@infra.apache.org


---------------------------------------------------------------------
To unsubscribe, e-mail: commits-unsubscribe@echarts.apache.org
For additional commands, e-mail: commits-help@echarts.apache.org
[GitHub] [echarts] l1b3r commented on issue #15488: Display the nearest data of different series in one tooltip.
Posted by GitBox <gi...@apache.org>.
l1b3r commented on issue #15488:
URL: https://github.com/apache/echarts/issues/15488#issuecomment-1044209422
The workaround from @Methodician might be viable in cases when you know the sampling frequency beforehand. However, in more general cases when your data is of various sampling rate it unfortunately does not work. Some datasets don't have a data point that would round to a specific point on the `x` axis while other datasets can round down to the same `x` multiple times.
See the screenshot for an example of such scenario.

So, +1 from me for being able to snap to the nearest point within a given margin of error.
--
This is an automated message from the Apache Git Service.
To respond to the message, please log on to GitHub and use the
URL above to go to the specific comment.
To unsubscribe, e-mail: commits-unsubscribe@echarts.apache.org
For queries about this service, please contact Infrastructure at:
users@infra.apache.org
---------------------------------------------------------------------
To unsubscribe, e-mail: commits-unsubscribe@echarts.apache.org
For additional commands, e-mail: commits-help@echarts.apache.org
[GitHub] [echarts] Ovilia commented on issue #15488: Display the nearest data of different series in one tooltip.
Posted by GitBox <gi...@apache.org>.
Ovilia commented on issue #15488:
URL: https://github.com/apache/echarts/issues/15488#issuecomment-966724482


   @Raphyyy Thanks for reporting. We are going to work on `axisPointer.snap` in the near future.


--
This is an automated message from the Apache Git Service.
To respond to the message, please log on to GitHub and use the
URL above to go to the specific comment.

To unsubscribe, e-mail: commits-unsubscribe@echarts.apache.org

For queries about this service, please contact Infrastructure at:
users@infra.apache.org


---------------------------------------------------------------------
To unsubscribe, e-mail: commits-unsubscribe@echarts.apache.org
For additional commands, e-mail: commits-help@echarts.apache.org