You are viewing a plain text version of this content. The canonical link for it is here.
Posted to notifications@apisix.apache.org by sy...@apache.org on 2022/09/19 08:37:46 UTC
[apisix-website] branch master updated: docs: add APISIX integrate Elasticsearch plugin blog (#1319)
This is an automated email from the ASF dual-hosted git repository.
sylviasu pushed a commit to branch master
in repository https://gitbox.apache.org/repos/asf/apisix-website.git
The following commit(s) were added to refs/heads/master by this push:
new bc09c12b457 docs: add APISIX integrate Elasticsearch plugin blog (#1319)
bc09c12b457 is described below
commit bc09c12b45781f8e75404831c1ec7fbcf328dc4c
Author: Sylvia <39...@users.noreply.github.com>
AuthorDate: Mon Sep 19 16:37:40 2022 +0800
docs: add APISIX integrate Elasticsearch plugin blog (#1319)
---
...pisix-integrat-with-elasticsearch-for-logger.md | 188 +++++++++++++++++++++
1 file changed, 188 insertions(+)
diff --git a/blog/zh/blog/2022/09/15/apache-apisix-integrat-with-elasticsearch-for-logger.md b/blog/zh/blog/2022/09/15/apache-apisix-integrat-with-elasticsearch-for-logger.md
new file mode 100644
index 00000000000..7d8053313be
--- /dev/null
+++ b/blog/zh/blog/2022/09/15/apache-apisix-integrat-with-elasticsearch-for-logger.md
@@ -0,0 +1,188 @@
+---
+title: "API 网关 Apache APISIX 集成 Elasticsearch 实现实时日志监控"
+authors:
+ - name: 王程程
+ title: Author
+ url: https://github.com/ccxhwmy
+ image_url: https://github.com/ccxhwmy.png
+keywords:
+- API 网关
+- Apache APISIX
+- Elasticsearch
+- 日志
+- 数据管理
+description: 本文将为你介绍 Apache APISIX 的 elasticsearch-logger 插件的相关信息,以及如何通过此插件获取 APISIX 的实时日志。
+tags: [Plugins,Ecosystem]
+images: https://static.apiseven.com/2022/09/15/6322cf190ef2d.png
+---
+
+> 本文将为你介绍 Apache APISIX 的 elasticsearch-logger 插件的相关信息,以及如何通过此插件获取 APISIX 的实时日志。
+
+<!--truncate-->
+
+## 背景信息
+
+**Apache APISIX** 是一个动态、实时、高性能的 **API** 网关,提供了负载均衡、动态上游、灰度发布、服务熔断、身份认证、可观测性等丰富的流量管理功能。作为 **API** 网关,**Apache APISIX** 不仅拥有丰富的插件,而且支持插件的热加载。
+
+**Elasticsearch** 是一个基于 [Lucene](https://zh.m.wikipedia.org/zh-hans/Lucene) 库的搜索引擎。它提供了分布式、RESTful 风格的搜索和数据分析引擎,具有可扩展性、可分布式部署和可进行相关度搜索等特点,能够解决不断涌现出的各种用例。同时还可以集中存储用户数据,帮助用户发现意料之中以及意料之外的情况。
+
+## 插件介绍
+
+APISIX 以 **HTTP** 请求的方式向 **Elasticsearch** 发送 APISIX 的 **Runtime** 日志。插件 `elasticsearch-logger` 采用 [bulk](https://www.elastic.co/guide/en/elasticsearch/reference/current/docs-bulk.html#docs-bulk) 的格式进行日志上报,这允许 APISIX 可以将多条日志合并后再进行上报,这使得 APISIX 在对 **Elasticsearch** 进行日志上报方面更加灵活并且具有较好的性能。你可以参考文档 [APISIX 批处理器](https://apisix.apache.org/zh/docs/apisix/batch-processor/) 对日志合进行更加细致的配置。
+
+## 配置步骤
+
+首先,你需要安装完成 APISIX,本文所有步骤基于 **Centos 7.5** 系统进行。详细的安装步骤参考 [APISIX 安装指南](https://apisix.apache.org/zh/docs/apisix/installation-guide/)。
+
+### 步骤1:启动 Elasticsearch
+
+本示例只演示了通过 `docker-compose` 启动 **Elasticsearch** 单节点的方式,其它启动方式可参考 [Elasticsearch 官方文档](https://www.elastic.co/cn/downloads/elasticsearch)。
+
+```dockerfile
+# 使用 docker-compose 启动 1 个 Elasticsearch 节点, 1 个 kibana
+version: '3.8'
+services:
+ elasticsearch:
+ image: docker.elastic.co/elasticsearch/elasticsearch:7.17.1
+ container_name: elasticsearch
+ environment:
+ ES_JAVA_OPTS: -Xms512m -Xmx512m
+ discovery.type: single-node
+ xpack.security.enabled: 'false'
+ networks:
+ - es-net
+ ports:
+ - "9200:9200"
+ - "9300:9300"
+
+ kibana:
+ image: docker.elastic.co/kibana/kibana:7.17.1
+ container_name: kibana
+ environment:
+ ELASTICSEARCH_HOSTS: http://elasticsearch:9200
+ I18N_LOCALE: zh-CN
+ networks:
+ - es-net
+ depends_on:
+ - elasticsearch
+ ports:
+ - "5601:5601"
+
+networks:
+ es-net:
+ driver: bridge
+```
+
+### 步骤2:创建路由并配置插件
+
+APISIX 默认配置文件中已启用 `elasticsearch-logger` 插件,所以你只需要通过下方命令创建路由并配置 `elasticsearch-logger` 插件就可以在 APISIX 中正常使用了。
+
+```shell
+curl http://127.0.0.1:9180/apisix/admin/routes/1 \
+-H 'X-API-KEY: edd1c9f034335f136f87ad84b625c8f1' -X PUT -d '
+{
+ "plugins":{
+ "elasticsearch-logger":{
+ "endpoint_addr":"http://127.0.0.1:9200",
+ "field":{
+ "index":"services",
+ "type":"collector"
+ },
+ "ssl_verify":false,
+ "retry_delay":1,
+ "buffer_duration":60,
+ "max_retry_count":0,
+ "batch_max_size":1000,
+ "inactive_timeout":5,
+ "name":"elasticsearch-logger"
+ }
+ },
+ "upstream":{
+ "type":"roundrobin",
+ "nodes":{
+ "127.0.0.1:1980":1
+ }
+ },
+ "uri":"/elasticsearch.do"
+}'
+```
+
+上述代码中配置了 **Elasticsearch** 地址、目标 `field`,用户名与密码。
+
+通过上述设置,就可以实现将 `/elasticsearch.do` 路径的 **API** 请求日志发送至 **Elasticsearch** 的功能。
+
+### 步骤3:发送请求
+
+接下来我们通过 **API** 发送一些请求。
+
+```shell
+curl -i http://127.0.0.1:9080/elasticsearch.do\?q\=hello
+HTTP/1.1 200 OK
+```
+
+```shell {title="output"}
+hello, world
+```
+
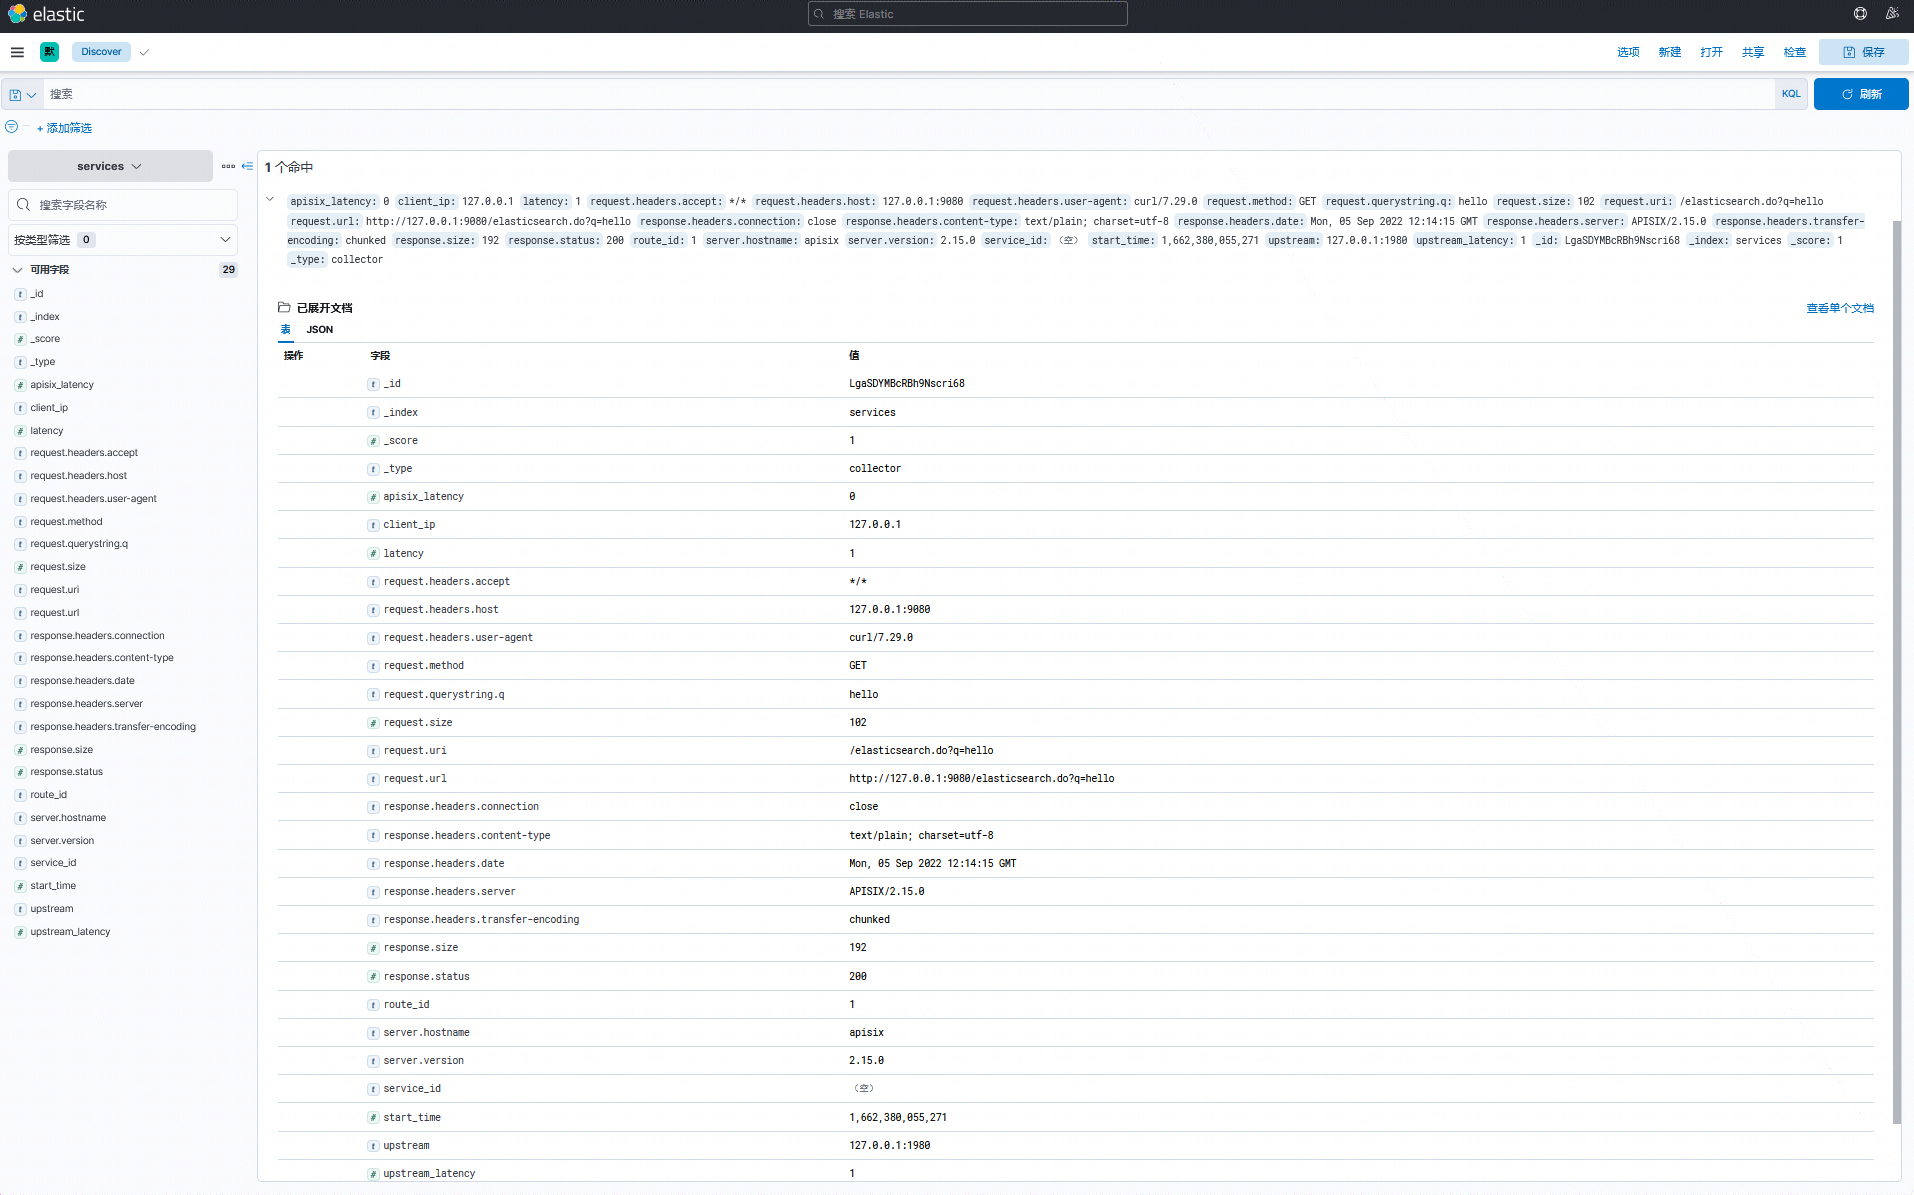
+此时你可以登录 **Kibana** 控制台检索查看相关日志:
+
+
+
+## 自定义日志结构
+
+当然,在使用过程中我们也可以通过 `elasticsearch-logger` 插件提供的元数据配置,来设置发送至 **Elasticsearch** 的日志数据结构。通过设置 `log_format` 数据,可以控制发送的数据类型。
+
+比如以下数据中的 `$host`、`$time_iso8601` 等,都是来自于 **NGINX** 提供的内置变量;也支持如 `$route_id` 和 `$service_id` 等 **Apache APISIX** 提供的变量配置。
+
+```shell
+curl http://127.0.0.1:9180/apisix/admin/plugin_metadata/elasticsearch-logger \
+-H 'X-API-KEY: edd1c9f034335f136f87ad84b625c8f1' -X PUT -d '
+{
+ "log_format": {
+ "host": "$host",
+ "@timestamp": "$time_iso8601",
+ "client_ip": "$remote_addr"
+ }
+}'
+```
+
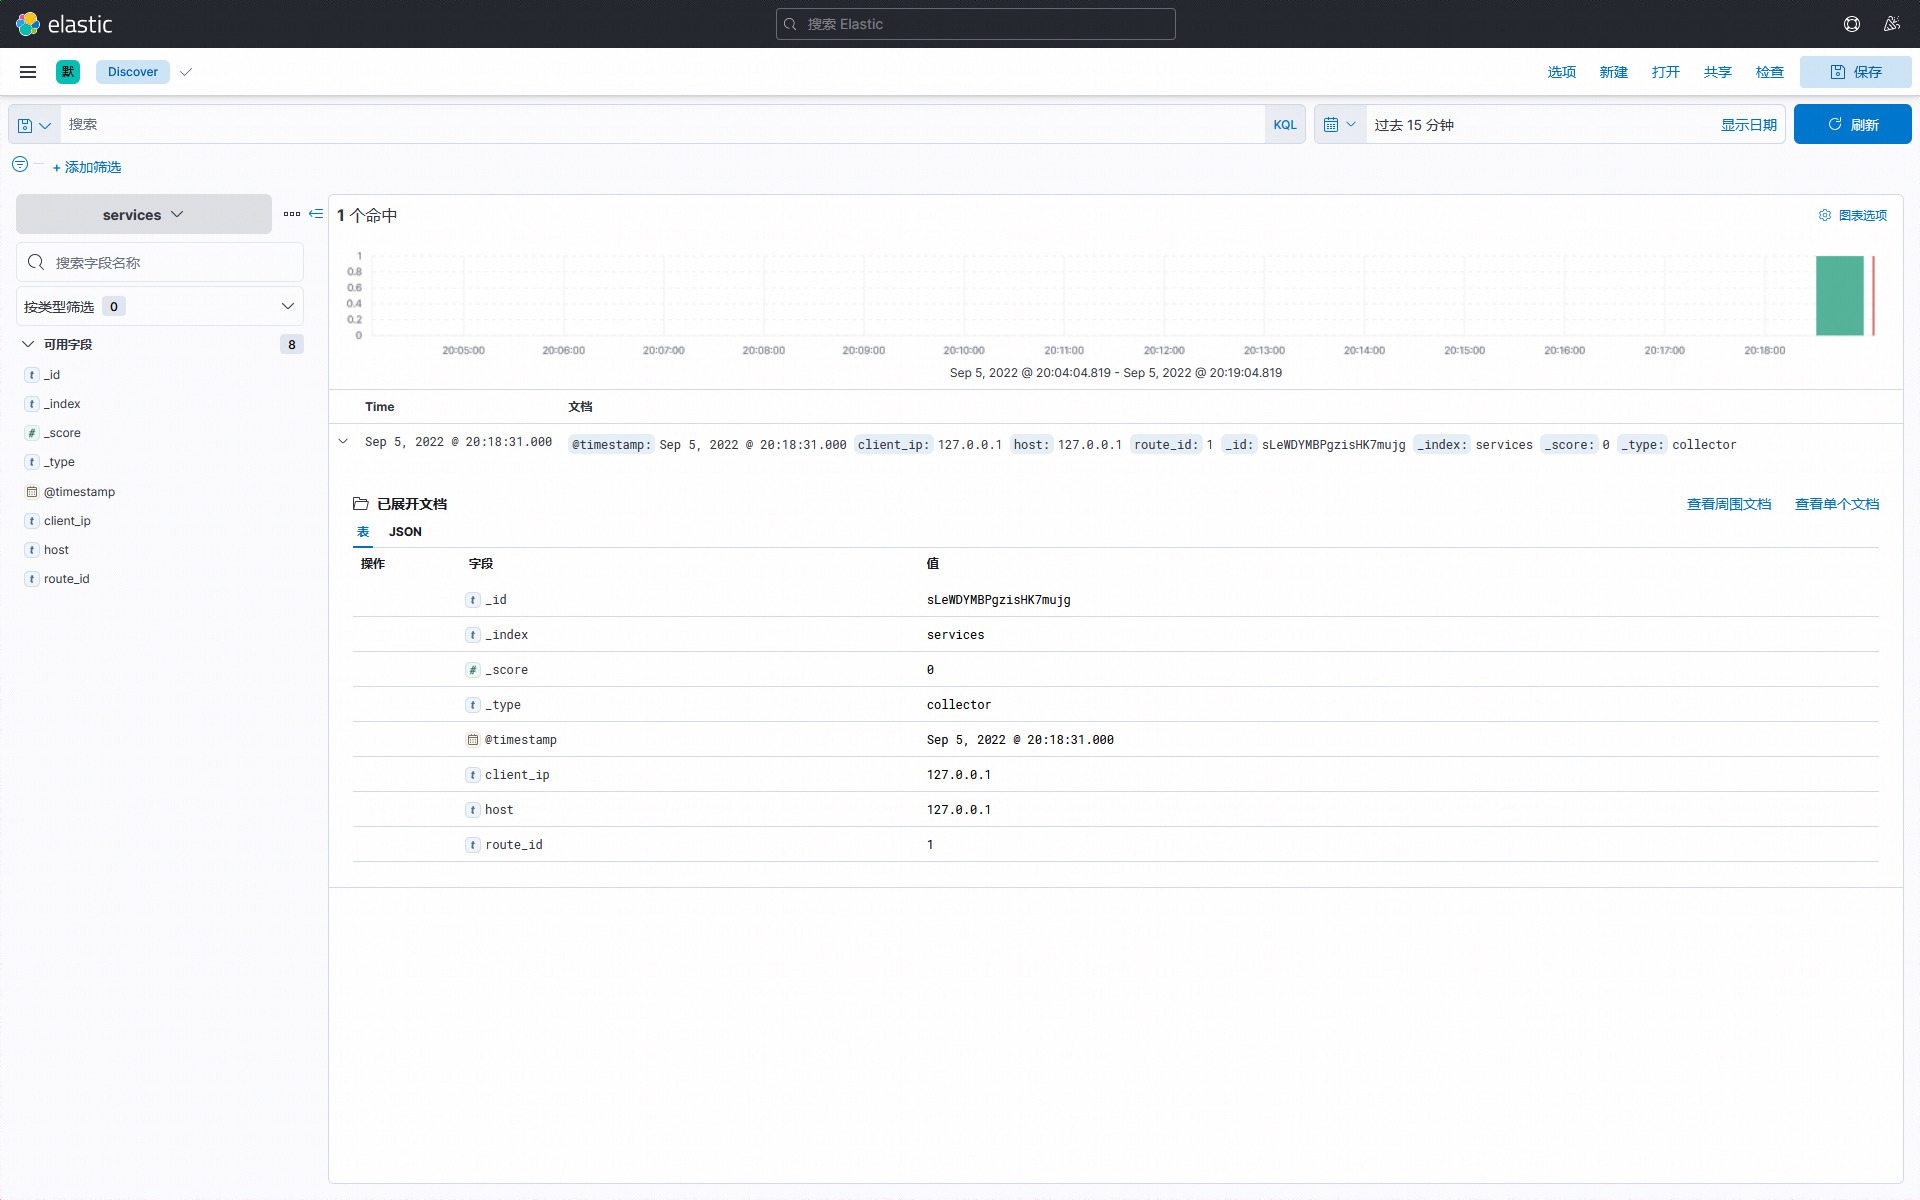
+通过发送请求进行简单测试,可以看到上述日志结构设置已生效。目前 **Apache APISIX** 提供多种日志格式模板,在配置上具有极大的灵活性,更多日志格式细节可参考 [Apache APISIX 官方文档](https://apisix.apache.org/docs/apisix/plugins/kafka-logger#metadata)。
+
+此时你可以登录 **Kibana** 控制台检索查看相关自定义日志:
+
+
+
+如需关闭自定义日志结构,可参考下方操作。
+
+```shell
+curl http://127.0.0.1:9180/apisix/admin/plugin_metadata/elasticsearch-logger \
+-H 'X-API-KEY: edd1c9f034335f136f87ad84b625c8f1' -X DELETE
+```
+
+此时,插件 `elasticsearch-logger` 将使用默认格式上报日志。
+
+## 关闭插件
+
+如使用完毕,只需移除路由配置中 `elasticsearch-logger` 插件相关的配置并保存,即可关闭路由上的插件。得益于 Apache APISIX 的动态化优势,开启和关闭插件的过程都不需要重启 Apache APISIX。
+
+```shell
+curl http://127.0.0.1:9080/apisix/admin/routes/1 \
+-H 'X-API-KEY: edd1c9f034335f136f87ad84b625c8f1' -X PUT -d '
+{
+ "methods": ["GET"],
+ "uri": "/hello",
+ "plugins": {},
+ "upstream": {
+ "type": "roundrobin",
+ "nodes": {
+ "127.0.0.1:1980": 1
+ }
+ }
+}'
+```
+
+## 总结
+
+本文为大家介绍了关于 **elasticsearch-logger** 插件的功能与使用步骤,更多关于 **elasticsearch-logger** 插件说明和完整配置列表,可以参考官方文档。
+
+也欢迎随时在 [GitHub Discussions](https://github.com/apache/apisix/discussions) 中发起讨论,或通过[邮件列表](https://apisix.apache.org/zh/docs/general/join)进行交流。