You are viewing a plain text version of this content. The canonical link for it is here.
Posted to commits@echarts.apache.org by GitBox <gi...@apache.org> on 2022/06/07 07:05:22 UTC
[GitHub] [echarts] NeeruAR opened a new issue, #17170: [Bug]
NeeruAR opened a new issue, #17170:
URL: https://github.com/apache/echarts/issues/17170
### Version
5.3.2
### Link to Minimal Reproduction
_No response_
### Steps to Reproduce
I am trying to use the aggregate sum method in echart but it is not giving proper result.
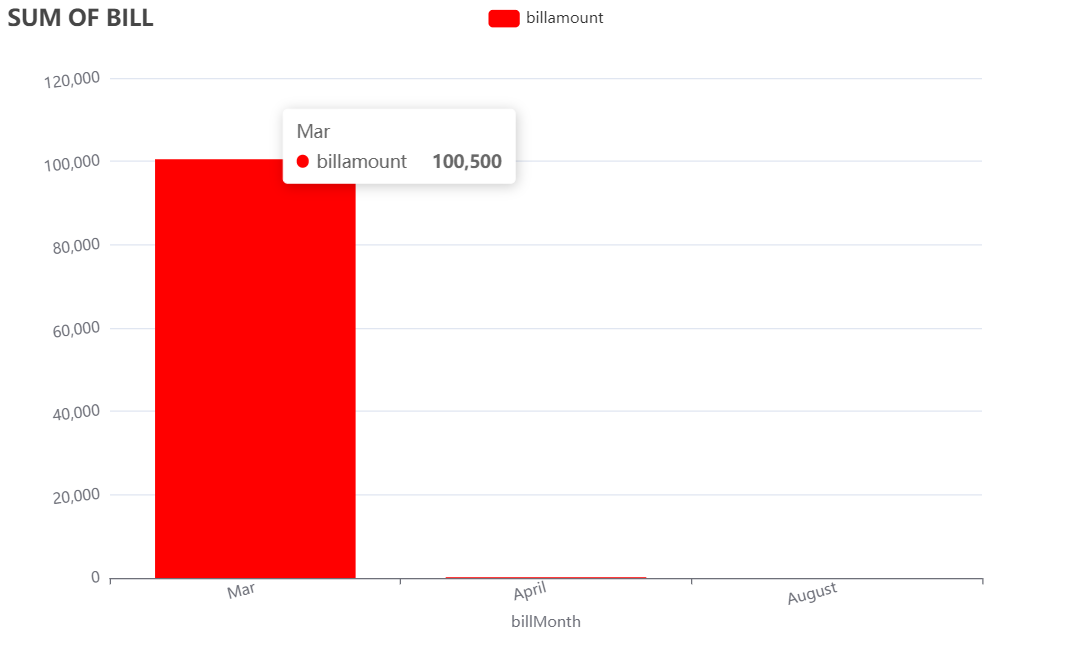
For the month of Mar output should be 1000, for April 210 and for August 148.
Go to link https://echarts.apache.org/examples/en/editor.html?c=data-transform-aggregate&edit=1&reset=1&version=5.3.2
and paste below code
$.when(
$.getScript(
'https://fastly.jsdelivr.net/npm/echarts-simple-transform/dist/ecSimpleTransform.min.js' )
).done(function (res) {
run(res);
});
function run() {
echarts.registerTransform(ecSimpleTransform.aggregate);
option = {
dataset: [
{
id: 'raw',
dimensions: ['billAmount', 'billMonth'],
source: [
{
billMonth: 'Mar',
billAmount: '400'
},
{
billMonth: 'Mar',
billAmount: '100'
},
{
billMonth: 'Mar',
billAmount: '500'
},
{
billMonth: 'April',
billAmount: '10'
},
{
billMonth: 'April',
billAmount: '200'
},
{
billMonth: 'August',
billAmount: '148'
}
]
},
{
id: 'month',
fromDatasetId: 'raw',
transform: [
{
type: 'filter',
config: {
dimension: 'billMonth',
eq: 'Mar'
}
}
]
},
{
id: 'bill_sum',
fromDatasetId: 'raw',
transform: [
{
type: 'ecSimpleTransform:aggregate',
config: {
resultDimensions: [
{ from: 'billAmount', method: 'sum' },
{ from: 'billMonth' }
],
groupBy: 'billMonth'
}
}
]
},
],
title: {
text: 'SUM OF BILL'
},
tooltip: {
trigger: 'axis',
confine: true
},
xAxis: {
name: 'billMonth',
nameLocation: 'middle',
nameGap: 30,
scale: true,
type: 'category',
boundaryGap: true,
axisLabel: {
interval: 0,
fontSize: 12,
rotate: 15
}
},
yAxis: {
type: 'value',
axisLabel: {
interval: 0,
fontSize: 12,
rotate: 7
}
},
grid: {
bottom: 100
},
legend: {
width: 330,
type: 'scroll'
},
series: [
{
type: 'bar',
datasetId: 'bill_sum',
name: 'billamount',
encode: {
x: 'billMonth',
y: 'billAmount'
},
color: 'red'
}
]
};
myChart.setOption(option);
}
### Current Behavior
Currently for version 5.3.2 It is not showing the correct sum amount.
Below image is for version 5.3.2
### Expected Behavior
It should show the correct sum for each month
For the month of Mar output should be 1000, for April 210 and for August 148.
### Environment
```markdown
- OS: Windows
- Browser: Google Chrome
- Framework:
```
### Any additional comments?
I am trying to develop configurable UI where on selection of certain options chart can be rendered on UI.
--
This is an automated message from the Apache Git Service.
To respond to the message, please log on to GitHub and use the
URL above to go to the specific comment.
To unsubscribe, e-mail: commits-unsubscribe@echarts.apache.org.apache.org
For queries about this service, please contact Infrastructure at:
users@infra.apache.org
---------------------------------------------------------------------
To unsubscribe, e-mail: commits-unsubscribe@echarts.apache.org
For additional commands, e-mail: commits-help@echarts.apache.org
[GitHub] [echarts] echarts-bot[bot] closed issue #17170: [Bug]
Posted by GitBox <gi...@apache.org>.
echarts-bot[bot] closed issue #17170: [Bug]
URL: https://github.com/apache/echarts/issues/17170


--
This is an automated message from the Apache Git Service.
To respond to the message, please log on to GitHub and use the
URL above to go to the specific comment.

To unsubscribe, e-mail: commits-unsubscribe@echarts.apache.org

For queries about this service, please contact Infrastructure at:
users@infra.apache.org


---------------------------------------------------------------------
To unsubscribe, e-mail: commits-unsubscribe@echarts.apache.org
For additional commands, e-mail: commits-help@echarts.apache.org
[GitHub] [echarts] echarts-bot[bot] commented on issue #17170: [Bug]
Posted by GitBox <gi...@apache.org>.
echarts-bot[bot] commented on issue #17170:
URL: https://github.com/apache/echarts/issues/17170#issuecomment-1148276702

   I'm sorry to close this issue for it lacks the necessary title. Please provide **a _descriptive_ and as _concise_ as possible title to describe your problems or requests** and then the maintainers or I will reopen this issue.

   Every good bug report or feature request starts with a title. Your issue title is a critical element as it's the first thing maintainers see.

   A good issue title makes it easier for maintainers to understand what the issue is, easily locate it, and know what steps they'll need to take to fix it.

   Moreover, it's better to include keywords, as this makes it easier to find the issue self and similar issues in searches.


--
This is an automated message from the Apache Git Service.
To respond to the message, please log on to GitHub and use the
URL above to go to the specific comment.

To unsubscribe, e-mail: commits-unsubscribe@echarts.apache.org

For queries about this service, please contact Infrastructure at:
users@infra.apache.org


---------------------------------------------------------------------
To unsubscribe, e-mail: commits-unsubscribe@echarts.apache.org
For additional commands, e-mail: commits-help@echarts.apache.org