You are viewing a plain text version of this content. The canonical link for it is here.
Posted to notifications@superset.apache.org by GitBox <gi...@apache.org> on 2021/01/08 18:30:33 UTC
[GitHub] [superset] junlincc commented on issue #12355: [line chart] new Line chart does not have x-axis control
junlincc commented on issue #12355:
URL: https://github.com/apache/superset/issues/12355#issuecomment-756924636
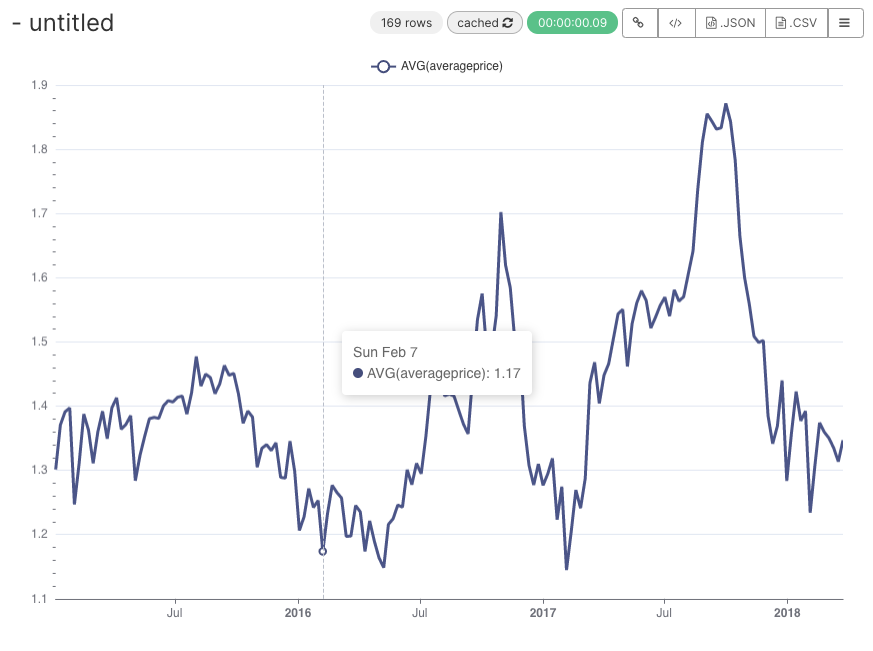
Echarts 5.0 automatically cut the ticks optimally based on the data time range and time grain setting, that's why we are seeing "inconsistent" format on the x-axis.


We can certainly add a formatter in the Echarts, but the question is, do we want them to work exactly as nvd3 charts?
Can we schedule a session with your users to understand the request better before diving in any implementation. @graceguo-supercat @zuzana-vej
----------------------------------------------------------------
This is an automated message from the Apache Git Service.
To respond to the message, please log on to GitHub and use the
URL above to go to the specific comment.
For queries about this service, please contact Infrastructure at:
users@infra.apache.org
---------------------------------------------------------------------
To unsubscribe, e-mail: notifications-unsubscribe@superset.apache.org
For additional commands, e-mail: notifications-help@superset.apache.org