You are viewing a plain text version of this content. The canonical link for it is here.
Posted to notifications@dubbo.apache.org by "TwiliMango (GitHub)" <gi...@apache.org> on 2018/11/12 08:27:46 UTC
[GitHub] [incubator-dubbo] TwiliMango commented on issue #2771: Dubbo
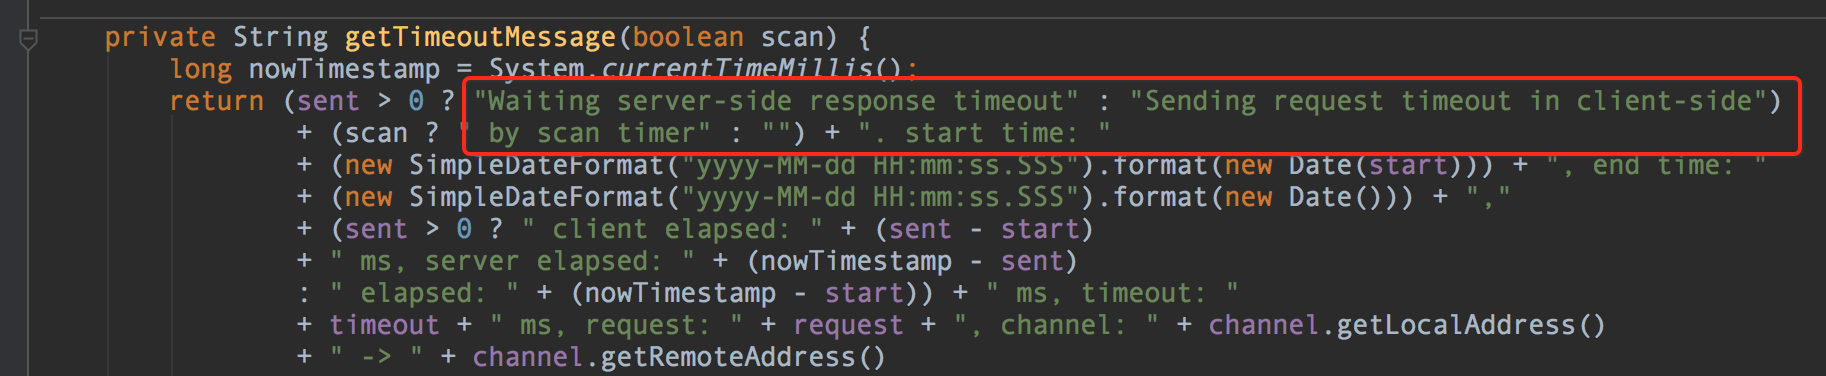
invoke timeout, Waiting server-side response timeout by scan timer
> 1、建议贴出完整的异常堆栈跟踪信息,便于我们更准确地判断问题。从`Waiting server-side response timeout`异常信息,再结合源代码来看,肯定是服务端处理请求慢了,慢的原因要看服务端的日志。
> 
> 2、建议你们升级`dubbo`版本
> 3、这个问题是微服务依赖网络的复杂性引起问题排查困难,需要借助**分布式链路跟踪系统**协助快速判断问题所在。见集成ZipKin示例 [dubbo-samples-zipkin](https://github.com/dubbo/dubbo-samples/tree/master/dubbo-samples-zipkin)
>
> 希望对你有用😁
您好,首先,感谢提供分析思路。
今天重新看了下,确实属于provider端超时(因个人原因,未check清楚,抱歉啦)。
在分析了超时方法后,逻辑只涉及一个SQL,然后查看druid monitor发现该sql最慢执行时间为18ms,执行时间分布基本在0-1ms。遂开始怀疑是获取连接慢问题,查看获取连接时最多等待多长时间为345。(check了GC日志,该时间段确实正常,哈哈。)
还有一点,这种超时情况属于偶发现象,基本一天一个或者几天才出现一次。
最后,继续请问下,这种情况该如何继续分析及避免呢,真心感谢。
[ Full content available at: https://github.com/apache/incubator-dubbo/issues/2771 ]
This message was relayed via gitbox.apache.org for notifications@dubbo.apache.org