You are viewing a plain text version of this content. The canonical link for it is here.
Posted to issues@flink.apache.org by GitBox <gi...@apache.org> on 2019/12/11 11:07:16 UTC
[GitHub] [flink] shuttie opened a new pull request #10529: [FLINK-15171]
[serialization] fix performance regression caused by too many buffer
allocations on string serialization
shuttie opened a new pull request #10529: [FLINK-15171] [serialization] fix performance regression caused by too many buffer allocations on string serialization
URL: https://github.com/apache/flink/pull/10529
## What is the purpose of the change
[FLINK-14346](https://issues.apache.org/jira/browse/FLINK-14346) Introduced a faster implementation for string [de]serialization. But while running the flink-benchmarks suite, there was a [performance regression found](https://issues.apache.org/jira/browse/FLINK-15171) for almost all serialization tests: a significant 10% drop-down for the total job throughput.
Flame graph before the FLINK-14346 was applied:
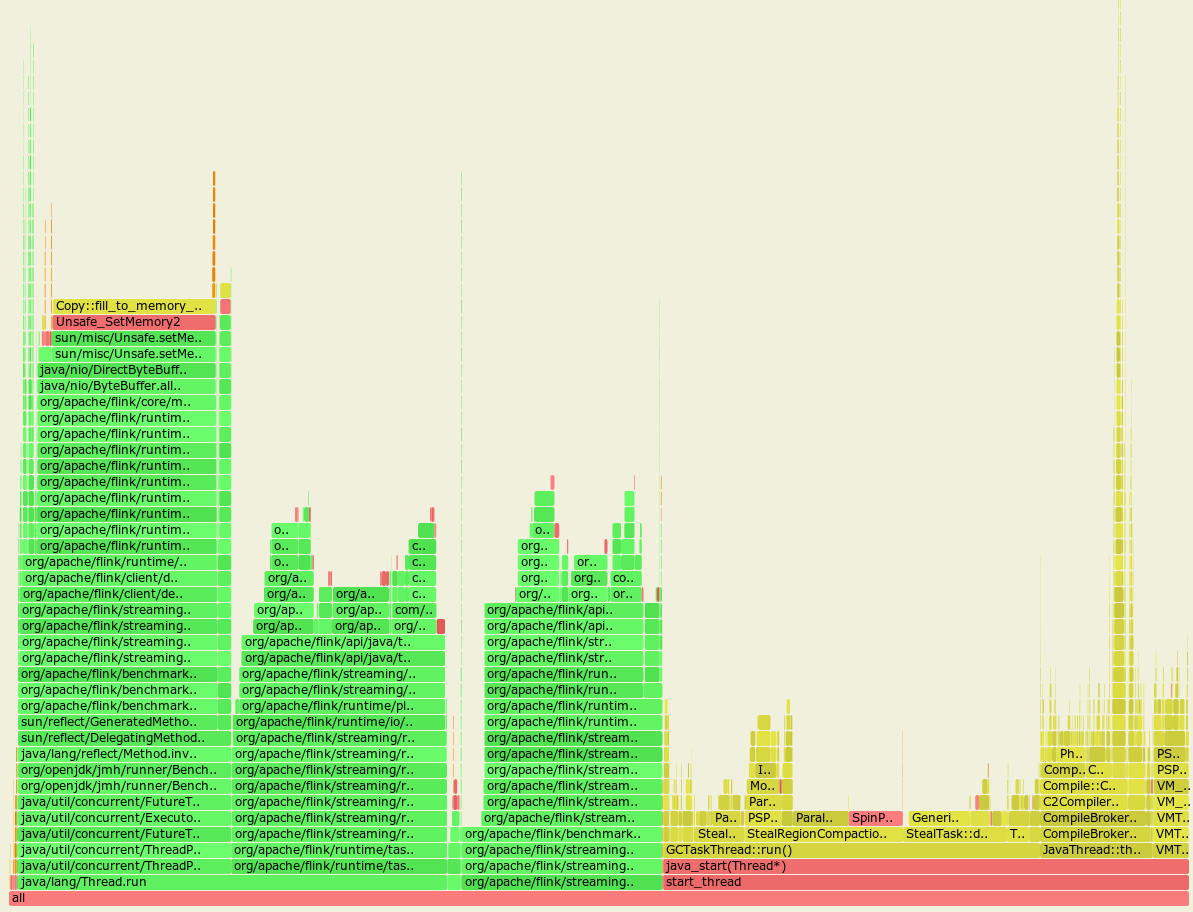
Flame graph after the FLINK-14346 was applied:
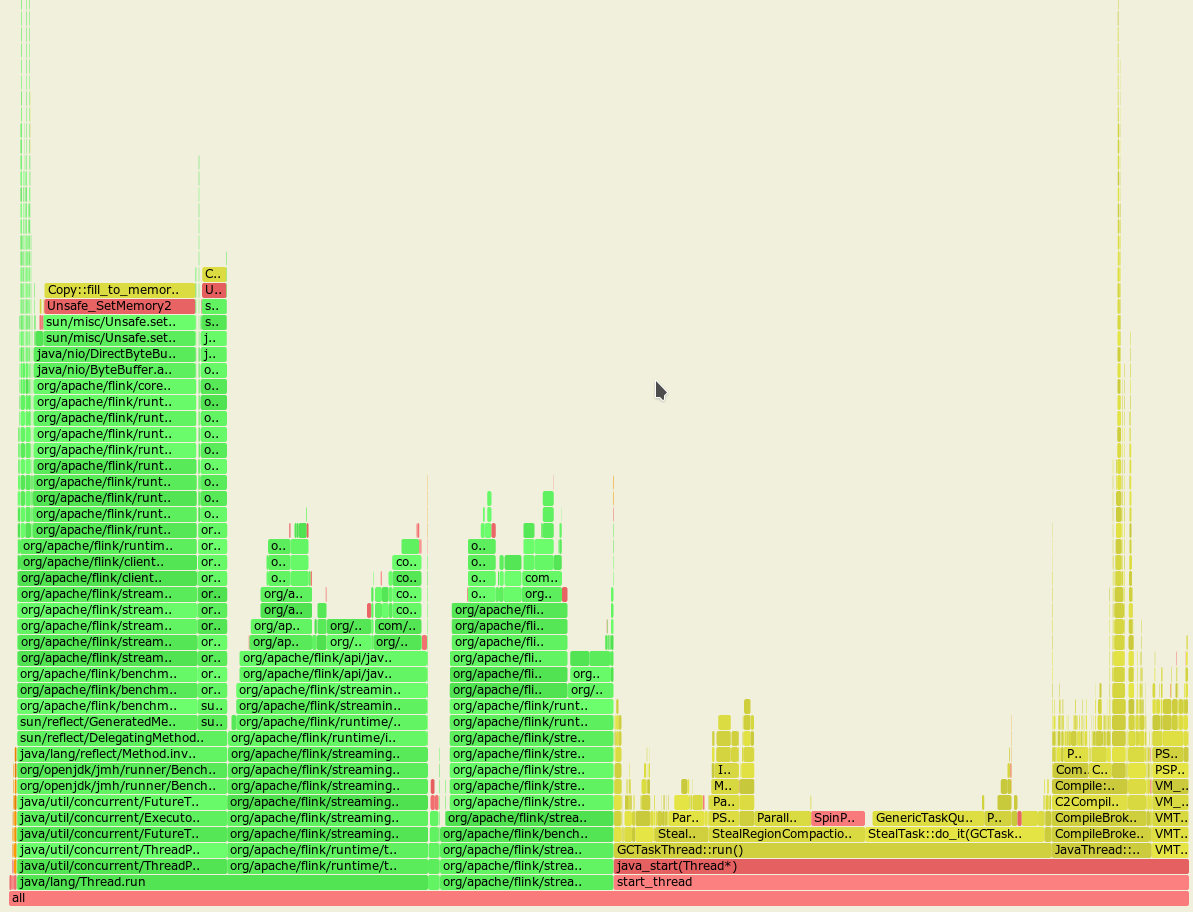
From these almost identical graphs we may notice that the GC spends much more time cleaning up the heap with the FLINK-14346 applied.
Running the new and old code with the allocation profiling proved the theory with higher allocation rate:
Top allocations, with FLINK-14346:
```
bytes percent samples top
---------- ------- ------- ---
8222540128 32.45% 40779 byte[]
7509810768 29.64% 37258 char[]
4320201040 17.05% 21491 java.lang.String
1667513984 6.58% 8247 org.apache.flink.api.java.tuple.Tuple2
749432744 2.96% 3711 org.apache.flink.api.java.tuple.Tuple8
589192264 2.33% 2897 java.lang.String[]
497193120 1.96% 2458 org.apache.flink.streaming.runtime.streamrecord.StreamRecord
478790376 1.89% 2372 org.apache.flink.api.java.tuple.Tuple2[]
404943784 1.60% 2007 java.lang.ThreadLocal$ThreadLocalMap
156780240 0.62% 564 java.nio.DirectByteBuffer
```
Top allocations, no FLINK-14346:
```
bytes percent samples top
---------- ------- ------- ---
7591122240 29.43% 3271 char[]
5360582240 20.78% 2243 java.lang.ThreadLocal$ThreadLocalMap
5147640184 19.96% 2231 java.lang.String
1758207472 6.82% 765 org.apache.flink.api.java.tuple.Tuple2
1717572128 6.66% 758 java.util.concurrent.locks.AbstractQueuedSynchronizer$Node
891013696 3.45% 380 org.apache.flink.api.java.tuple.Tuple8
598698832 2.32% 266 java.lang.String[]
440182240 1.71% 202 org.apache.flink.streaming.runtime.streamrecord.StreamRecord
364959680 1.41% 141 org.apache.flink.api.java.tuple.Tuple2[]
```
So almost third of all the allocations made were done for these intermediate array buffers.
All the benchmarks posted in the [original PR](https://github.com/apache/flink/pull/10358) were done on Ryzen 7 2700 (8 physical cores), and the CPU used for the `flink-benchmarks` is i7 7700 (4 physical cores). Also note that almost all the flink-benchmarks use parallelism=4, so:
* new code generated +30% more garbage.
* as originally performance was measured on a 8 core CPU with only 4 threads, GC threads were scheduled on the idle cores and didn't interfere with the benchmark.
* on the i7 7700 flink-benchmarks used 4 threads on 4 core CPU with additional active GC threads, heavily interfering with the main benchmark.
* this is the reason why lowering the parallelism for [the stringHeavyBenchmark](src/main/java/org/apache/flink/benchmark/SerializationFrameworkMiniBenchmarks.java) improved the throughput: it added more space for the GC threads to run.
With this PR we did the following:
* added a static `ThreadLocal<byte[]>` buffer for short strings smaller than 1024 characters
* when the string is short enough, we do not allocate the buffer, but reuse the static one, eliminating the allocation completely.
* for this case we need to always preallocate a small buffer for each worker thread, even if there is almost no string serialization at all.
* for long strings we do a regular allocation as before.
## Brief change log
- Add ThreadLocal byte buffer for write and read path for short strings instead of allocating it on each invocation.
## Verifying this change
This change is already covered by existing tests, such as StringSerializationTest.
## Does this pull request potentially affect one of the following parts:
- Dependencies (does it add or upgrade a dependency): (yes / **no**)
- The public API, i.e., is any changed class annotated with `@Public(Evolving)`: (yes / **no**)
- The serializers: ( **yes** / no / don't know)
- The runtime per-record code paths (performance sensitive): (**yes** / no / don't know)
- Anything that affects deployment or recovery: JobManager (and its components), Checkpointing, Yarn/Mesos, ZooKeeper: (yes / **no** / don't know)
- The S3 file system connector: (yes / **no** / don't know)
## Documentation
- Does this pull request introduce a new feature? (yes / **no**)
- If yes, how is the feature documented? (**not applicable** / docs / JavaDocs / not documented)
----------------------------------------------------------------
This is an automated message from the Apache Git Service.
To respond to the message, please log on to GitHub and use the
URL above to go to the specific comment.
For queries about this service, please contact Infrastructure at:
users@infra.apache.org
With regards,
Apache Git Services