You are viewing a plain text version of this content. The canonical link for it is here.
Posted to commits@echarts.apache.org by GitBox <gi...@apache.org> on 2019/11/06 10:53:24 UTC
[GitHub] [incubator-echarts] sijan93 opened a new issue #11570: Display
tooltip on chart legend (Echarts)
sijan93 opened a new issue #11570: Display tooltip on chart legend (Echarts)
URL: https://github.com/apache/incubator-echarts/issues/11570
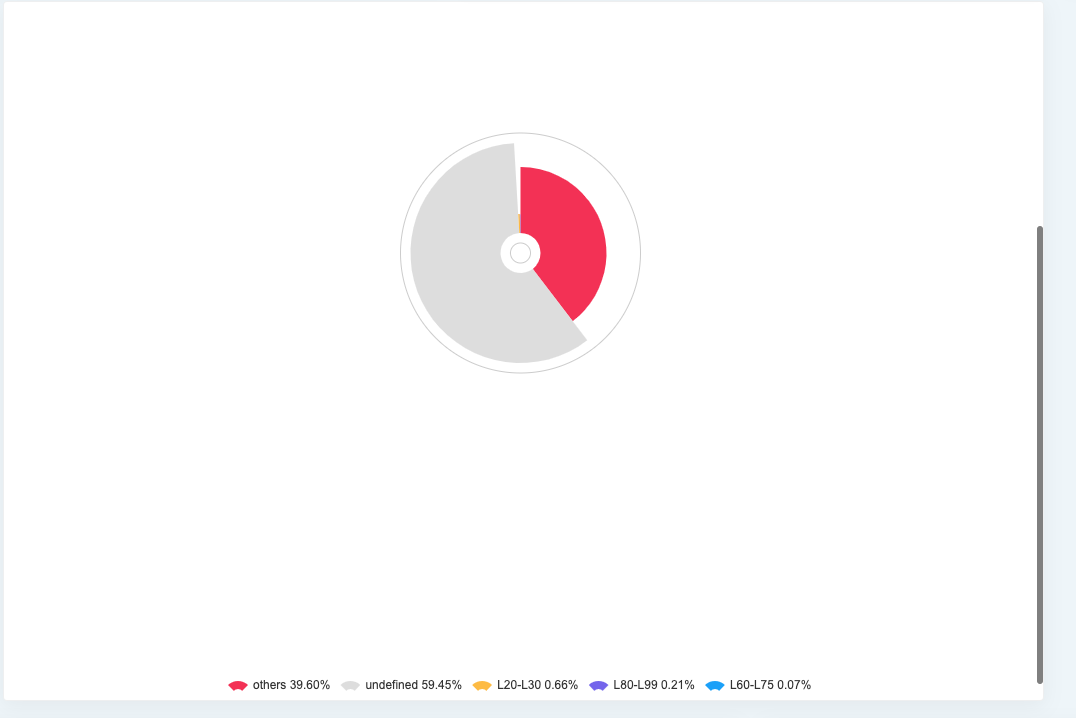
I implemented a chart with legend based on Echarts libary. What i want to develop now is tooltip for each data on chart legend. Data are prepared as array of object and each name have corresponding description which i want to show on tooltip. In other word, i want tooltip from picture below to be shown after mouse hover on legend names.
<div class="card grid-stack-item-content cd-example" id="dashboard-header">
<div class="card-header container-fluid">
<div class="row dashboard-row">
<div class="col-3 dashboard-icon-div text-center">
<h1 class="dashboard-h1"><i class="fa fa-tags dashboard-logo"></i></h1>
</div>
<div class="col-5">
<h4 class="card-title dashboard-card-title">{{trans('app.icd10_codes')}}</h4>
<h6 class="card-subtitle text-muted">
@if (count($binnedIcds['targetIcds']['codes']) > 0)
<span class="info-box-number">
{{count($binnedIcds['targetIcds']['codes'])}}
{{trans('app.skin_disease_groups')}}
</span>
@endif
</h6>
</div>
</div>
</div>
<div class="card-body">
<div class="row">
<div class="col-lg-12 col-md-12 col-sm-12">
<div id="pie-chart" style="width:100%; min-height: 480px;"></div>
</div>
</div>
</div>
</div>
```
```
class NewIcdChart
{
constructor(ctx, targetsLabels, othersLabel, undefLabel, targetsTooltips, othersTooltip,
undefTooltip, nTargets, nOthers, nTotal)
{
this.othersColor = '#888888';
this.undefColor = '#cccccc';
var labels = {
targetsLabels,
othersLabel,
undefLabel
};
var tooltips = {
targetsTooltips,
othersTooltip,
undefTooltip,
};
var nTargetImages = nTargets.reduce((a,b) => a + b, 0);
var nUndef = nTotal - nTargetImages - nOthers;
var counts = {
nTargets,
nOthers,
nTotal,
nUndef,
};
this.chart;
this.hasOthers = false;
this.hasUndef = false;
this.drawChart(ctx, labels, tooltips, counts);
}
drawChart(ctx, labels, tooltips, counts){
var otherValue=counts.nOthers;
var otherLabel=labels.othersLabel;
var otherTooltip=tooltips.othersTooltip;
var undefinedValue=counts.nUndef;
var undefinedLabel=labels.undefLabel;
var undefinedTooltip=tooltips.undefTooltip;
var targetValues=counts.nTargets;
var targetLabels=labels.targetsLabels;
var targetTooltip=tooltips.targetsTooltips;
var finalChartValue=[];
for(var i=0; i<targetValues.length; i++){
for(var i=0; i<targetLabels.length; i++){
for(var i=0; i<targetTooltip.length; i++){
var obj = {"value": targetValues[i], "name": targetLabels[i], "tooltip": targetTooltip[i]};
finalChartValue.push(obj);
}
}
}
var otherObject={
value: otherValue,
name : otherLabel,
tooltip : otherTooltip
};
var undefinedObject={
value: undefinedValue,
name : undefinedLabel,
tooltip : undefinedTooltip
};
finalChartValue.unshift(otherObject, undefinedObject);
console.log("finalChartValue", finalChartValue);
var finalChartLables=[];
finalChartValue.forEach(function(res) {
finalChartLables.push(res.name);
});
// specify chart configuration item and data
var option = {
legend: {
x : 'center',
y : 'bottom',
padding: 1,
formatter: function (name) {
var data = this.getSeries()[0].data;
var totalValue = data.reduce((acc, item) => {
acc += item.value;
return acc;
}, 0)
var targetValue;
var targetTooltip;
data.map(item => {
if (item.name == name) {
targetValue = item.value;
targetTooltip= item.tooltip;
}
})
var p = (targetValue / totalValue * 100).toFixed(2);
console.log("name", name);
return name + ' ' + p + '%';
},
data:finalChartLables,
tooltip: {
trigger: 'item',
formatter: "{a} <br/>{b} : {c}",
}
},
toolbox: {
show: true,
feature: {
dataView: { show: true, readOnly: false },
magicType: {
show: true,
type: ['pie']
},
restore: { show: true },
saveAsImage: { show: true }
}
},
color: ["#f62d51", "#dddddd", "#ffbc34", "#7460ee", "#009efb", "#2f3d4a", "#90a4ae", "#55ce63"],
calculable: true,
series: [{
name: 'ICD',
type: 'pie',
radius: [20, 180],
center : ['50%', '50%'],
roseType: 'radius',
itemStyle: {
normal: {
label: {
show: false,
formatter: "{b} : \n ({c})",
fontWeight: 100
},
labelLine: {
show: false,
formatter: "{b} : \n ({c})",
fontWeight: 100
}
},
emphasis: {
label: {
show: true,
formatter: "{b} : \n ({c})",
fontWeight: 100
},
labelLine: {
show: true,
formatter: "{b} : \n ({c})",
fontWeight: 100
}
}
},
data: finalChartValue
},
]
};
// use configuration item and data specified to show chart
ctx.setOption(option, true), $(function() {
function resize() {
setTimeout(function() {
ctx.resize()
}, 100)
}
$(window).on("resize", resize), $(".sidebartoggler").on("click", resize)
});
console.log("ctx", ctx);
}
}
```
----------------------------------------------------------------
This is an automated message from the Apache Git Service.
To respond to the message, please log on to GitHub and use the
URL above to go to the specific comment.
For queries about this service, please contact Infrastructure at:
users@infra.apache.org
With regards,
Apache Git Services
---------------------------------------------------------------------
To unsubscribe, e-mail: commits-unsubscribe@echarts.apache.org
For additional commands, e-mail: commits-help@echarts.apache.org