You are viewing a plain text version of this content. The canonical link for it is here.
Posted to dev@echarts.apache.org by GitBox <gi...@apache.org> on 2018/11/09 03:23:25 UTC
[GitHub] dlutls edited a comment on issue #9368: echarts未来是否有计划遵循可视化语法
dlutls edited a comment on issue #9368: echarts未来是否有计划遵循可视化语法
URL: https://github.com/apache/incubator-echarts/issues/9368#issuecomment-437237344
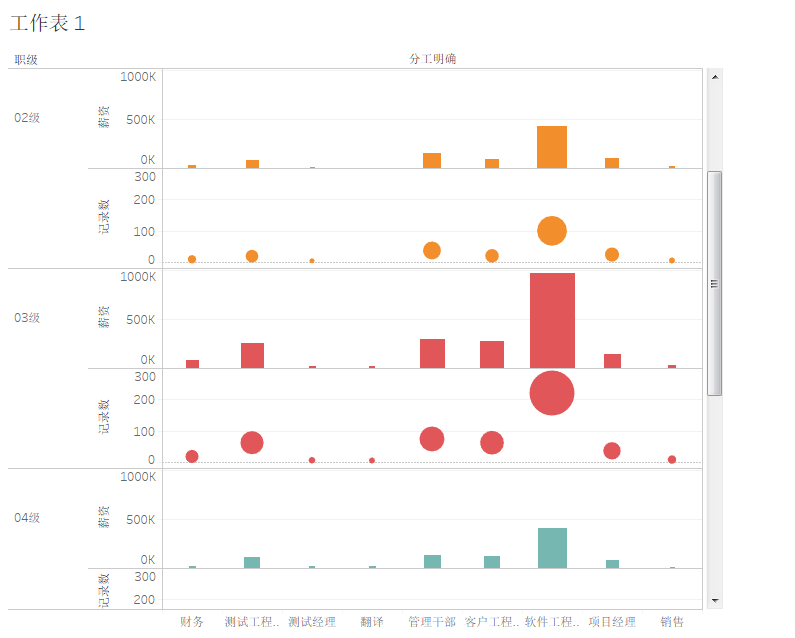
在截图图表中表现出两个能力:1.髙维矩阵。突破原有单图表固有数据结构的束缚,可以更大程度的释放人作为可视化主体的能动性和灵活性;2.对于矩阵块中的“标记”,是一种相对图表来说更细粒度的拆解,可以有更多的视觉表达,比如大小、颜色等,可以更进一步的辅助人进行探索分析。
我觉得,可视化就是应该往更有助于人理解和分析的方向发展和演变。也一直看好echarts,希望能够echarts在可视化表达上进行突破,同时带动可视化相关产业同步升级。
附一张Tableau图表分析:
----------------------------------------------------------------
This is an automated message from the Apache Git Service.
To respond to the message, please log on GitHub and use the
URL above to go to the specific comment.
For queries about this service, please contact Infrastructure at:
users@infra.apache.org
With regards,
Apache Git Services
---------------------------------------------------------------------
To unsubscribe, e-mail: dev-unsubscribe@echarts.apache.org
For additional commands, e-mail: dev-help@echarts.apache.org