You are viewing a plain text version of this content. The canonical link for it is here.
Posted to commits@echarts.apache.org by GitBox <gi...@apache.org> on 2019/11/08 06:09:11 UTC
[GitHub] [incubator-echarts] dagundejuzi opened a new issue #11595: 图表区域不能单独滚动。
dagundejuzi opened a new issue #11595: 图表区域不能单独滚动。
URL: https://github.com/apache/incubator-echarts/issues/11595
### Version
4.3.0
### Steps to reproduce
当数据比较多的时候,图表原来的宽度不够展示所有数据,需要滚动图表。但是图表并不会扩大范围从而可滚动,只会在一屏之下更密集的排布。
### What is expected?
希望数据比较多时,图表可以滚动,可以让每个数据有间距的展示。
### What is actually happening?
数据只在原来的面积内,更密集的排布。
---
如下图,我只是在官方基本折线示例图上加了些数据。
https://www.echartsjs.com/examples/zh/editor.html?c=line-simple

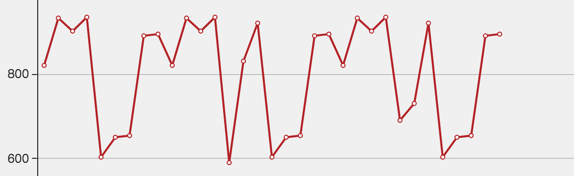
在datazoom的实例中看到图表可以滚动,但是需求不用缩放,数据平铺展示的,只要能滑动就行。
var dom = myChart.getDom();
dom.style.width='1000px';
myChart.resize({silent:true});
这样写在手机上是可以滚动了,但是连带Y轴也滚走了,这样是滚动了图表的外层容器,用户体验也不好。
所以请问有什么方法可以让图表内容滚动而Y轴固定?
<!-- This issue is generated by echarts-issue-helper. DO NOT REMOVE -->
----------------------------------------------------------------
This is an automated message from the Apache Git Service.
To respond to the message, please log on to GitHub and use the
URL above to go to the specific comment.
For queries about this service, please contact Infrastructure at:
users@infra.apache.org
With regards,
Apache Git Services
---------------------------------------------------------------------
To unsubscribe, e-mail: commits-unsubscribe@echarts.apache.org
For additional commands, e-mail: commits-help@echarts.apache.org