You are viewing a plain text version of this content. The canonical link for it is here.
Posted to dev@echarts.apache.org by GitBox <gi...@apache.org> on 2018/09/21 06:09:32 UTC
[GitHub] cyzeng-Luca opened a new issue #9111: 如何在一个图表中同时使用type: 'scatter'与type: 'map',
cyzeng-Luca opened a new issue #9111: 如何在一个图表中同时使用type: 'scatter'与type: 'map',
URL: https://github.com/apache/incubator-echarts/issues/9111
<!--
为了方便我们能够复现和修复 bug,请遵从下面的规范描述您的问题。
-->
### One-line summary [问题简述]
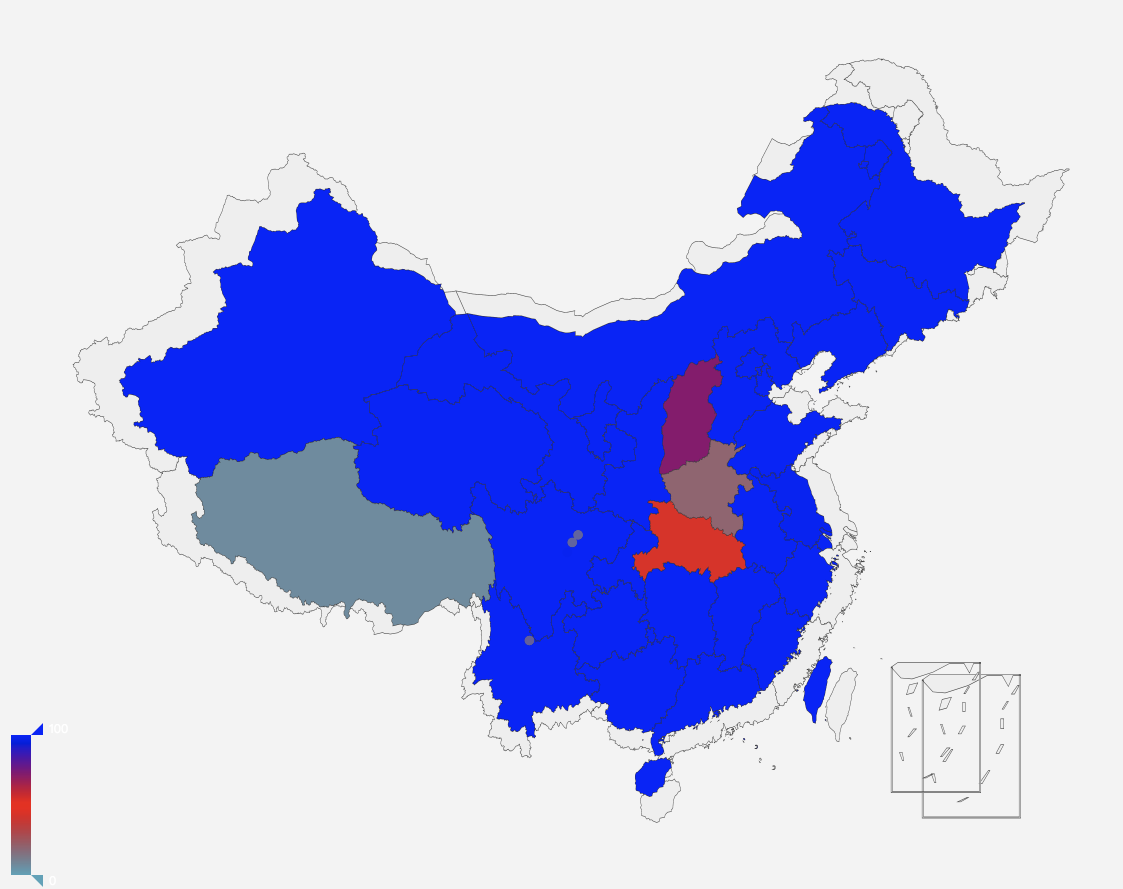
我想在一个图表中,同时使用type: 'scatter(气泡图)',与type: `'map'(区域图),来展示数据,代码如下:```
option = {
// 我想使用两个visualMap分别控制气泡图和区域图,但是这样无法实现(如何制定不同类型的数据?)
visualMap:[
{
show: true,
min: 0,
max: 100,
calculable: true,
inRange: {
color: ['#50a3ba', 'red', 'blue']
},
textStyle: {
color: '#fff'
},
},
{
show: true,
min: 0,
max: 100,
calculable: true,
inRange: {
color: ['#50a3ba', 'red', 'blue']
},
textStyle: {
color: '#fff'
},
}
],
geo: {
roam: true,
map: 'china',
label: {},
itemStyle: {},
},
series: [
// 这是第一种类型(气泡图)
{
type: 'scatter',
coordinateSystem: 'geo',
data: convertData([
{name: "成都", value: 99},
{name: "德阳", value: 12},
{name: "绵阳", value: 12},
{name: "攀枝花", value: 14},
{name: "雅安", value: 15},
{name: "巴中", value: 16},
{name: "乐山市", value: 10},
]),
symbolSize: 10,
itemStyle: {
emphasis: {
borderColor: '#fff',
borderWidth: 1
}
}
},
// 这是第一种类型(区域图)
{
name: 'iphone3',
type: 'map',
mapType: 'china',
roam: false,
label: {
normal: {
show: false
},
emphasis: {
show: true
}
},
data:[
{name: '北京',value: Math.round(Math.random()*1000)},
{name: '天津',value: Math.round(Math.random()*1000)},
{name: '上海',value: Math.round(Math.random()*1000)},
{name: '重庆',value: Math.round(Math.random()*1000)},
{name: '河北',value: Math.round(Math.random()*1000)},
{name: '河南',value: Math.round(Math.random()*1000)},
{name: '云南',value: Math.round(Math.random()*1000)},
{name: '辽宁',value: Math.round(Math.random()*1000)},
{name: '黑龙江',value: Math.round(Math.random()*1000)},
{name: '湖南',value: Math.round(Math.random()*1000)},
]
},
]
}
```
这是效果展示
### Version & Environment [版本及环境]
+ ECharts version [ECharts 版本]:
+ Browser version [浏览器类型和版本]:
+ OS Version [操作系统类型和版本]:
### Expected behaviour [期望结果]
我发现出现了两个图例,我想两种维度的数据展示在同一张图中且如何使用visualMap来制定只用不同的数据(比如我想使用visualMap,分别控制气泡图数据和区域图数据)
### ECharts option [ECharts配置项]
<!-- Copy and paste your 'echarts option' here. -->
<!-- [下方贴你的option,注意不要删掉下方 ```javascript 和 尾部的 ``` 字样。最好是我们能够直接运行的 option。如何得到能运行的 option 参见上方的 guidelines for contributing] -->
```javascript
option = {
}
```
### Other comments [其他信息]
<!-- For example: Screenshot or Online demo -->
<!-- [例如,截图或线上实例 (JSFiddle/JSBin/Codepen)] -->
----------------------------------------------------------------
This is an automated message from the Apache Git Service.
To respond to the message, please log on GitHub and use the
URL above to go to the specific comment.
For queries about this service, please contact Infrastructure at:
users@infra.apache.org
With regards,
Apache Git Services
---------------------------------------------------------------------
To unsubscribe, e-mail: dev-unsubscribe@echarts.apache.org
For additional commands, e-mail: dev-help@echarts.apache.org