You are viewing a plain text version of this content. The canonical link for it is here.
Posted to commits@echarts.apache.org by GitBox <gi...@apache.org> on 2022/12/23 12:40:39 UTC
[GitHub] [echarts] andrius-kurtinaitis opened a new issue, #18099: markArea xAxis does not zoom for category axis and bar series
andrius-kurtinaitis opened a new issue, #18099:
URL: https://github.com/apache/echarts/issues/18099
### Version
5.4.1
### Link to Minimal Reproduction
https://jsfiddle.net/chLj6ver/
### Steps to Reproduce
Create a chart with a category axis and line and bar series.
Set markArea to [30, 40].
Add dataZoom option:
```
const seriesName = 'A Series name';
option = {
tooltip: {
show: true,
trigger: 'axis'
},
xAxis: {
type: 'category',
data: ['10', '20', '30', '40', '50', '60', '70', '80', '90', '100', '110', '120', '130', '140', '150', '160', '170', '180', '190', '200'],
splitArea: {
show: true
}
},
yAxis: {
type: 'value'
},
series: [{
name: seriesName,
data: [820, 932, 901, 934, 1290, 1330, 1320, 820, 932, 901, 934, 1290, 1330, 1320, 820, 932, 901, 934, 1290, 1330],
type: 'line',
markArea: {
data: [
[{
xAxis: '30'
}, {
xAxis: '40'
}],
]
}
}],
dataZoom: [{
type: 'inside',
xAxisIndex: 0,
start: 10,
end: 35,
},
{
type: 'slider',
show: true,
xAxisIndex: 0,
start: 10,
end: 35,
},
],
};
const chart1 = echarts.init(document.getElementById('themeChart1'))
chart1.setOption(option)
option.series[0].type = 'bar';
const chart2 = echarts.init(document.getElementById('themeChart2'))
chart2.setOption(option)
```
Try and zoom somewhere.
Line series shows markArea at correct place between 30 and 40.
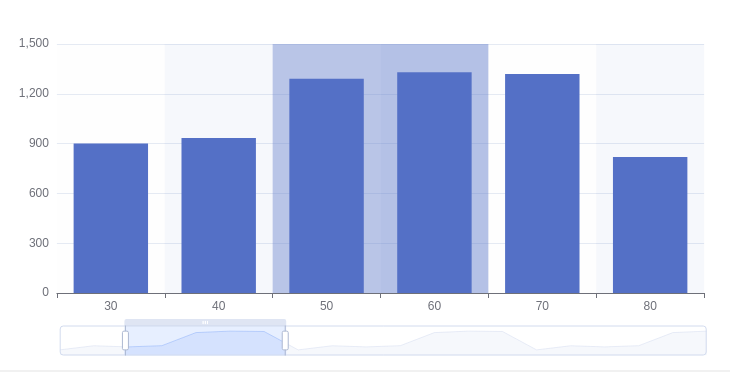
When you zoom in bar series, the mark area jumps around to unexpected locations or disappears entirely.
### Current Behavior
When you set zoom to [10, 35], the mark area marks [50, 60]:
### Expected Behavior
The mark area should stay at [30, 40].
### Environment
```markdown
- OS: LinuxMint
- Browser: Chrome
```
### Any additional comments?
_No response_
--
This is an automated message from the Apache Git Service.
To respond to the message, please log on to GitHub and use the
URL above to go to the specific comment.
To unsubscribe, e-mail: commits-unsubscribe@echarts.apache.org.apache.org
For queries about this service, please contact Infrastructure at:
users@infra.apache.org
---------------------------------------------------------------------
To unsubscribe, e-mail: commits-unsubscribe@echarts.apache.org
For additional commands, e-mail: commits-help@echarts.apache.org
[GitHub] [echarts] Ovilia closed issue #18099: markArea xAxis does not zoom for category axis and bar series
Posted by "Ovilia (via GitHub)" <gi...@apache.org>.
Ovilia closed issue #18099: markArea xAxis does not zoom for category axis and bar series
URL: https://github.com/apache/echarts/issues/18099


--
This is an automated message from the Apache Git Service.
To respond to the message, please log on to GitHub and use the
URL above to go to the specific comment.

To unsubscribe, e-mail: commits-unsubscribe@echarts.apache.org

For queries about this service, please contact Infrastructure at:
users@infra.apache.org


---------------------------------------------------------------------
To unsubscribe, e-mail: commits-unsubscribe@echarts.apache.org
For additional commands, e-mail: commits-help@echarts.apache.org
[GitHub] [echarts] andrius-kurtinaitis commented on issue #18099: markArea xAxis does not zoom for category axis and bar series
Posted by GitBox <gi...@apache.org>.
andrius-kurtinaitis commented on issue #18099:
URL: https://github.com/apache/echarts/issues/18099#issuecomment-1366459653

   I tried version 5.4.0 and it seems zoom functionality worked correctly: https://jsfiddle.net/x4f3cuo1/1/
   I suspect this PR did break zoom: https://github.com/apache/echarts/pull/17098/files


--
This is an automated message from the Apache Git Service.
To respond to the message, please log on to GitHub and use the
URL above to go to the specific comment.

To unsubscribe, e-mail: commits-unsubscribe@echarts.apache.org

For queries about this service, please contact Infrastructure at:
users@infra.apache.org


---------------------------------------------------------------------
To unsubscribe, e-mail: commits-unsubscribe@echarts.apache.org
For additional commands, e-mail: commits-help@echarts.apache.org
[GitHub] [echarts] echarts-bot[bot] commented on issue #18099: markArea xAxis does not zoom for category axis and bar series
Posted by GitBox <gi...@apache.org>.
echarts-bot[bot] commented on issue #18099:
URL: https://github.com/apache/echarts/issues/18099#issuecomment-1368808024

   This issue is labeled with `priority: high`, which means it's a frequently asked problem and we will fix it ASAP.


--
This is an automated message from the Apache Git Service.
To respond to the message, please log on to GitHub and use the
URL above to go to the specific comment.

To unsubscribe, e-mail: commits-unsubscribe@echarts.apache.org

For queries about this service, please contact Infrastructure at:
users@infra.apache.org


---------------------------------------------------------------------
To unsubscribe, e-mail: commits-unsubscribe@echarts.apache.org
For additional commands, e-mail: commits-help@echarts.apache.org