You are viewing a plain text version of this content. The canonical link for it is here.
Posted to commits@echarts.apache.org by GitBox <gi...@apache.org> on 2019/11/18 09:27:57 UTC
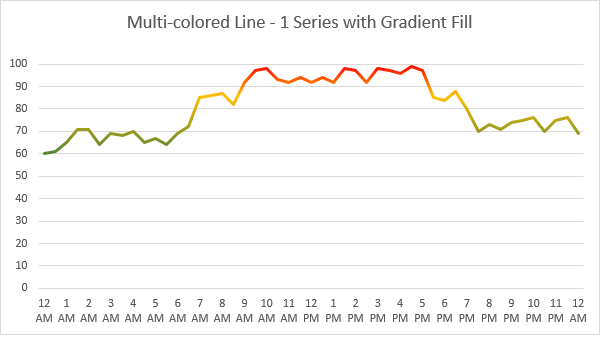
[GitHub] [incubator-echarts] chaitanyaVadlamudi opened a new issue #11666:
Need example to color the line conditionally between data points. i.e.,
multi color line chart
chaitanyaVadlamudi opened a new issue #11666: Need example to color the line conditionally between data points. i.e., multi color line chart
URL: https://github.com/apache/incubator-echarts/issues/11666
I struck in plotting the multi color line chart based on some condition. The color between two data points in a line chart depends on the values of the other parameter.
I can use visual map, but it's based on the ranges and coloring the line dividing it into pieces, which doesnot solve my requirement.
Please provide an example to achieve this. Please comment if you need any clarification.
----------------------------------------------------------------
This is an automated message from the Apache Git Service.
To respond to the message, please log on to GitHub and use the
URL above to go to the specific comment.
For queries about this service, please contact Infrastructure at:
users@infra.apache.org
With regards,
Apache Git Services
---------------------------------------------------------------------
To unsubscribe, e-mail: commits-unsubscribe@echarts.apache.org
For additional commands, e-mail: commits-help@echarts.apache.org