You are viewing a plain text version of this content. The canonical link for it is here.
Posted to commits@echarts.apache.org by GitBox <gi...@apache.org> on 2021/04/13 02:34:40 UTC
[GitHub] [echarts] han54369 opened a new issue #14653: Time line chart stack issue
han54369 opened a new issue #14653:
URL: https://github.com/apache/echarts/issues/14653


   ### Version
   5.0.2

   ### Steps to reproduce
   option = {
       tooltip: {
           trigger: 'axis'
       },
   	legend: {top:30},
       xAxis: {
           type: 'time'
       },
       yAxis: {
           type: 'value'
       },
       stack:true,
       series: [
           {
               name: 'Remaining',
               data: [
                   ["2021-03-01 00:00:00",100],
                   ["2021-03-02 00:00:00",90],
                   ["2021-03-10 00:00:00",70],
                   ["2021-03-11 00:00:00",60]
               ],
               type: 'line',
               step: 'end',
               //stack: 'IN'
           },
           {
               name: 'Deposited',
               data: [
                   ["2021-03-03 00:00:00",20],
                   ["2021-03-07 00:00:00",50],
                   ["2021-03-08 00:00:00",65],
                   ["2021-03-12 00:00:00",70]
               ],
               type: 'line',
               step: 'end',
               //stack: 'IN'
           }
       ]
   };

   ### What is expected?
   The first 'Deposited' value is not 110.

   ### What is actually happening?
   Stack over time

   <!-- This issue is generated by echarts-issue-helper. DO NOT REMOVE -->
   <!-- This issue is in English. DO NOT REMOVE -->


--
This is an automated message from the Apache Git Service.
To respond to the message, please log on to GitHub and use the
URL above to go to the specific comment.

For queries about this service, please contact Infrastructure at:
users@infra.apache.org


---------------------------------------------------------------------
To unsubscribe, e-mail: commits-unsubscribe@echarts.apache.org
For additional commands, e-mail: commits-help@echarts.apache.org
[GitHub] [echarts] geekboy0801 edited a comment on issue #14653: Time line chart stack issue
Posted by GitBox <gi...@apache.org>.
geekboy0801 edited a comment on issue #14653:
URL: https://github.com/apache/echarts/issues/14653#issuecomment-992033440
@pissang @Ovilia
If I flip x, y axis, it seems to be working.
Link: https://echarts.apache.org/examples/en/editor.html?c=line-stack
Go to the above link, and put the following code.
```
const data = [[0, 120], [1, 132], [2, 101], [3, 134], [4, 90], [5, 230], [6, 210]];
const newData = data.map(item => [item[1], item[0]]);
option = {
title: {
text: 'Stacked Line'
},
grid: {
left: '3%',
right: '4%',
bottom: '3%',
containLabel: true
},
yAxis: {
inverse: true,
type: 'value',
data: [0, 1, 2, 3, 4, 5, 6, 7, 8]
},
xAxis: {
type: 'value',
},
series: [
{
name: 'Email',
type: 'line',
stack: 'Total',
data: newData,
},
{
name: 'Union Ads',
type: 'line',
stack: 'Total',
data: newData,
},
]
};
```

--
This is an automated message from the Apache Git Service.
To respond to the message, please log on to GitHub and use the
URL above to go to the specific comment.
To unsubscribe, e-mail: commits-unsubscribe@echarts.apache.org
For queries about this service, please contact Infrastructure at:
users@infra.apache.org
---------------------------------------------------------------------
To unsubscribe, e-mail: commits-unsubscribe@echarts.apache.org
For additional commands, e-mail: commits-help@echarts.apache.org
[GitHub] [echarts] pissang commented on issue #14653: Time line chart stack issue
Posted by GitBox <gi...@apache.org>.
pissang commented on issue #14653:
URL: https://github.com/apache/echarts/issues/14653#issuecomment-820874929


   Time axis doesn't support stack yet.


--
This is an automated message from the Apache Git Service.
To respond to the message, please log on to GitHub and use the
URL above to go to the specific comment.

For queries about this service, please contact Infrastructure at:
users@infra.apache.org


---------------------------------------------------------------------
To unsubscribe, e-mail: commits-unsubscribe@echarts.apache.org
For additional commands, e-mail: commits-help@echarts.apache.org
[GitHub] [echarts] pissang edited a comment on issue #14653: Time line chart stack issue
Posted by GitBox <gi...@apache.org>.
pissang edited a comment on issue #14653:
URL: https://github.com/apache/echarts/issues/14653#issuecomment-820874929


   Time axis doesn't support stacking yet.


--
This is an automated message from the Apache Git Service.
To respond to the message, please log on to GitHub and use the
URL above to go to the specific comment.

For queries about this service, please contact Infrastructure at:
users@infra.apache.org


---------------------------------------------------------------------
To unsubscribe, e-mail: commits-unsubscribe@echarts.apache.org
For additional commands, e-mail: commits-help@echarts.apache.org
[GitHub] [echarts] geekboy0801 commented on issue #14653: Time line chart stack issue
Posted by GitBox <gi...@apache.org>.
geekboy0801 commented on issue #14653:
URL: https://github.com/apache/echarts/issues/14653#issuecomment-992026788
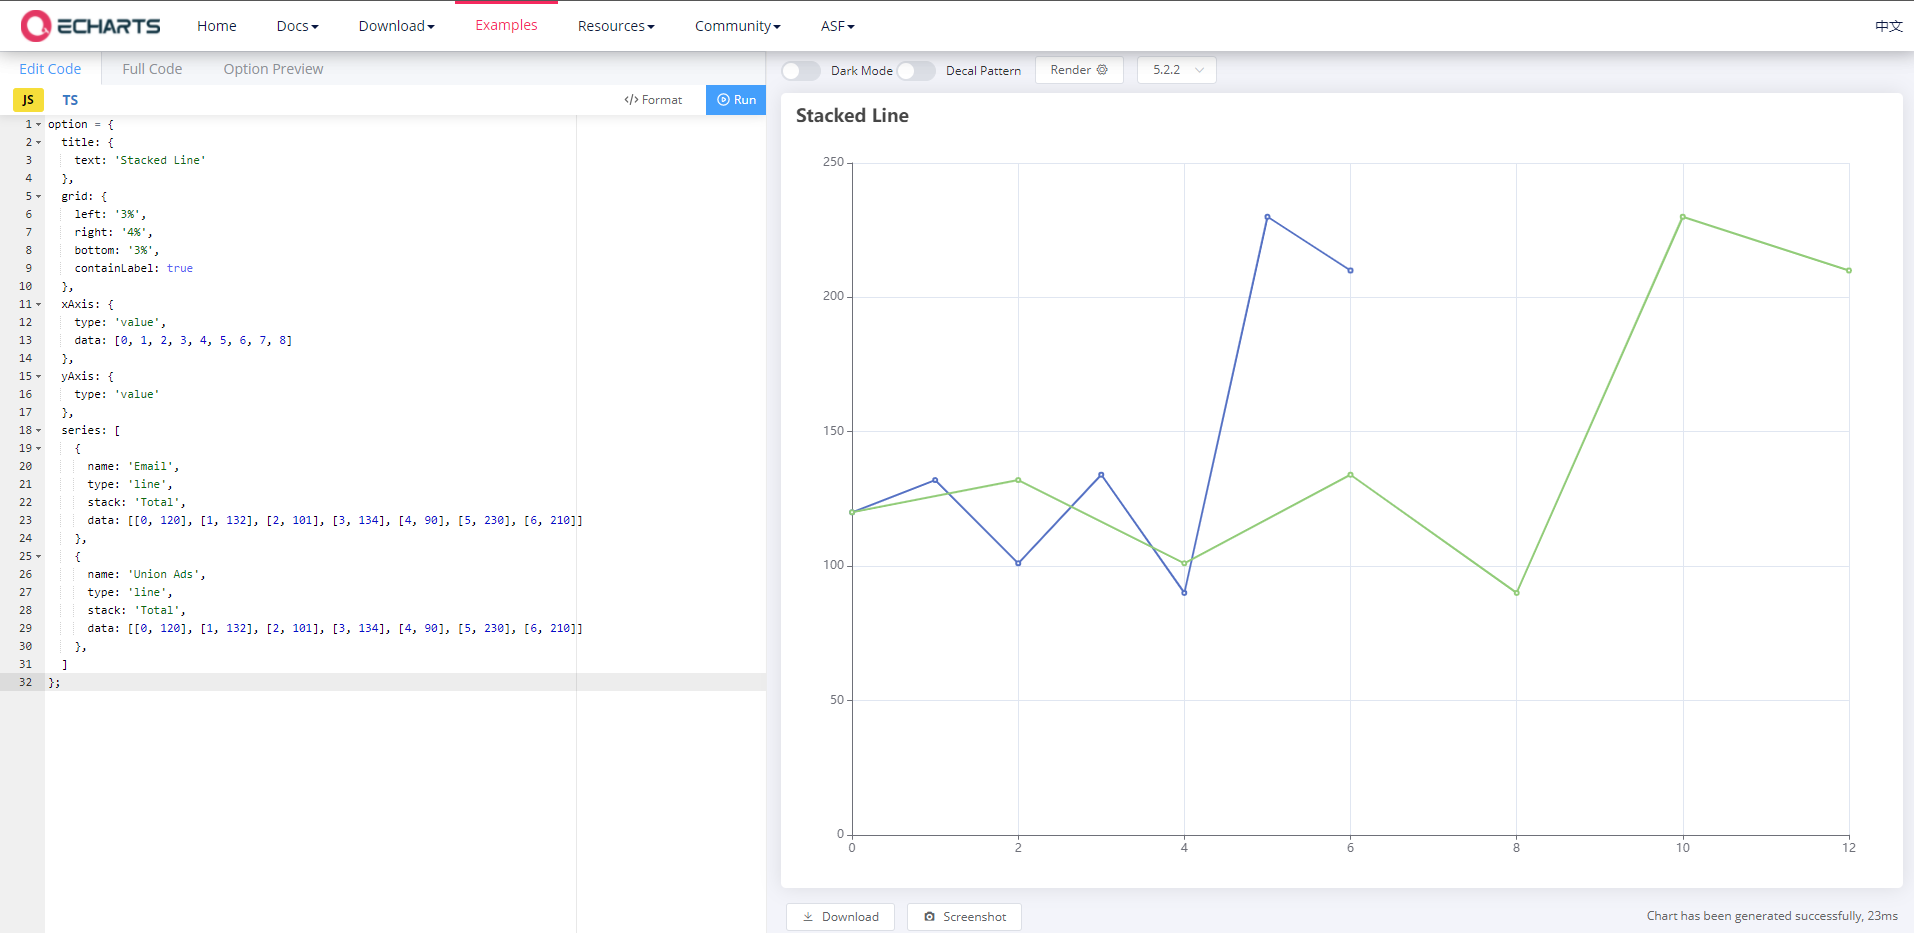
Link: https://echarts.apache.org/examples/en/editor.html?c=line-stack
Go to the above link, and put the following code. You'll see the weird result.
```
option = {
title: {
text: 'Stacked Line'
},
grid: {
left: '3%',
right: '4%',
bottom: '3%',
containLabel: true
},
xAxis: {
type: 'value',
data: [0, 1, 2, 3, 4, 5, 6, 7, 8]
},
yAxis: {
type: 'value'
},
series: [
{
name: 'Email',
type: 'line',
stack: 'Total',
data: [[0, 120], [1, 132], [2, 101], [3, 134], [4, 90], [5, 230], [6, 210]]
},
{
name: 'Union Ads',
type: 'line',
stack: 'Total',
data: [[0, 120], [1, 132], [2, 101], [3, 134], [4, 90], [5, 230], [6, 210]]
},
]
};
```
--
This is an automated message from the Apache Git Service.
To respond to the message, please log on to GitHub and use the
URL above to go to the specific comment.
To unsubscribe, e-mail: commits-unsubscribe@echarts.apache.org
For queries about this service, please contact Infrastructure at:
users@infra.apache.org
---------------------------------------------------------------------
To unsubscribe, e-mail: commits-unsubscribe@echarts.apache.org
For additional commands, e-mail: commits-help@echarts.apache.org
[GitHub] [echarts] geekboy0801 commented on issue #14653: Time line chart stack issue
Posted by GitBox <gi...@apache.org>.
geekboy0801 commented on issue #14653:
URL: https://github.com/apache/echarts/issues/14653#issuecomment-992025923


   @pissang Looks like stacking is only supported for `category` type axes. Is there a simple workaround to make it possible for `value` type axes?


--
This is an automated message from the Apache Git Service.
To respond to the message, please log on to GitHub and use the
URL above to go to the specific comment.

To unsubscribe, e-mail: commits-unsubscribe@echarts.apache.org

For queries about this service, please contact Infrastructure at:
users@infra.apache.org


---------------------------------------------------------------------
To unsubscribe, e-mail: commits-unsubscribe@echarts.apache.org
For additional commands, e-mail: commits-help@echarts.apache.org
[GitHub] [echarts] echarts-bot[bot] commented on issue #14653: Time line chart stack issue
Posted by GitBox <gi...@apache.org>.
echarts-bot[bot] commented on issue #14653:
URL: https://github.com/apache/echarts/issues/14653#issuecomment-818386899


   Hi! We've received your issue and please be patient to get responded. 🎉
   The average response time is expected to be within one day for weekdays.

   In the meanwhile, please make sure that **you have posted enough image to demo your request**. You may also check out the [API](http://echarts.apache.org/api.html) and [chart option](http://echarts.apache.org/option.html) to get the answer.

   If you don't get helped for a long time (over a week) or have an urgent question to ask, you may also send an email to dev@echarts.apache.org. Please attach the issue link if it's a technical question.

   If you are interested in the project, you may also subscribe our [mailing list](https://echarts.apache.org/en/maillist.html).

   Have a nice day! 🍵


--
This is an automated message from the Apache Git Service.
To respond to the message, please log on to GitHub and use the
URL above to go to the specific comment.

For queries about this service, please contact Infrastructure at:
users@infra.apache.org


---------------------------------------------------------------------
To unsubscribe, e-mail: commits-unsubscribe@echarts.apache.org
For additional commands, e-mail: commits-help@echarts.apache.org
[GitHub] [echarts] geekboy0801 commented on issue #14653: Time line chart stack issue
Posted by GitBox <gi...@apache.org>.
geekboy0801 commented on issue #14653:
URL: https://github.com/apache/echarts/issues/14653#issuecomment-992033440
@pissang @Ovilia
If I flip x, y axis, it seems to be working.
Link: https://echarts.apache.org/examples/en/editor.html?c=line-stack
Go to the above link, and put the following code. You'll see the weird result.
```
const data = [[0, 120], [1, 132], [2, 101], [3, 134], [4, 90], [5, 230], [6, 210]];
const newData = data.map(item => [item[1], item[0]]);
option = {
title: {
text: 'Stacked Line'
},
grid: {
left: '3%',
right: '4%',
bottom: '3%',
containLabel: true
},
yAxis: {
inverse: true,
type: 'value',
data: [0, 1, 2, 3, 4, 5, 6, 7, 8]
},
xAxis: {
type: 'value',
},
series: [
{
name: 'Email',
type: 'line',
stack: 'Total',
data: newData,
},
{
name: 'Union Ads',
type: 'line',
stack: 'Total',
data: newData,
},
]
};
```

--
This is an automated message from the Apache Git Service.
To respond to the message, please log on to GitHub and use the
URL above to go to the specific comment.
To unsubscribe, e-mail: commits-unsubscribe@echarts.apache.org
For queries about this service, please contact Infrastructure at:
users@infra.apache.org
---------------------------------------------------------------------
To unsubscribe, e-mail: commits-unsubscribe@echarts.apache.org
For additional commands, e-mail: commits-help@echarts.apache.org