You are viewing a plain text version of this content. The canonical link for it is here.
Posted to reviews@iotdb.apache.org by GitBox <gi...@apache.org> on 2022/07/29 04:17:11 UTC
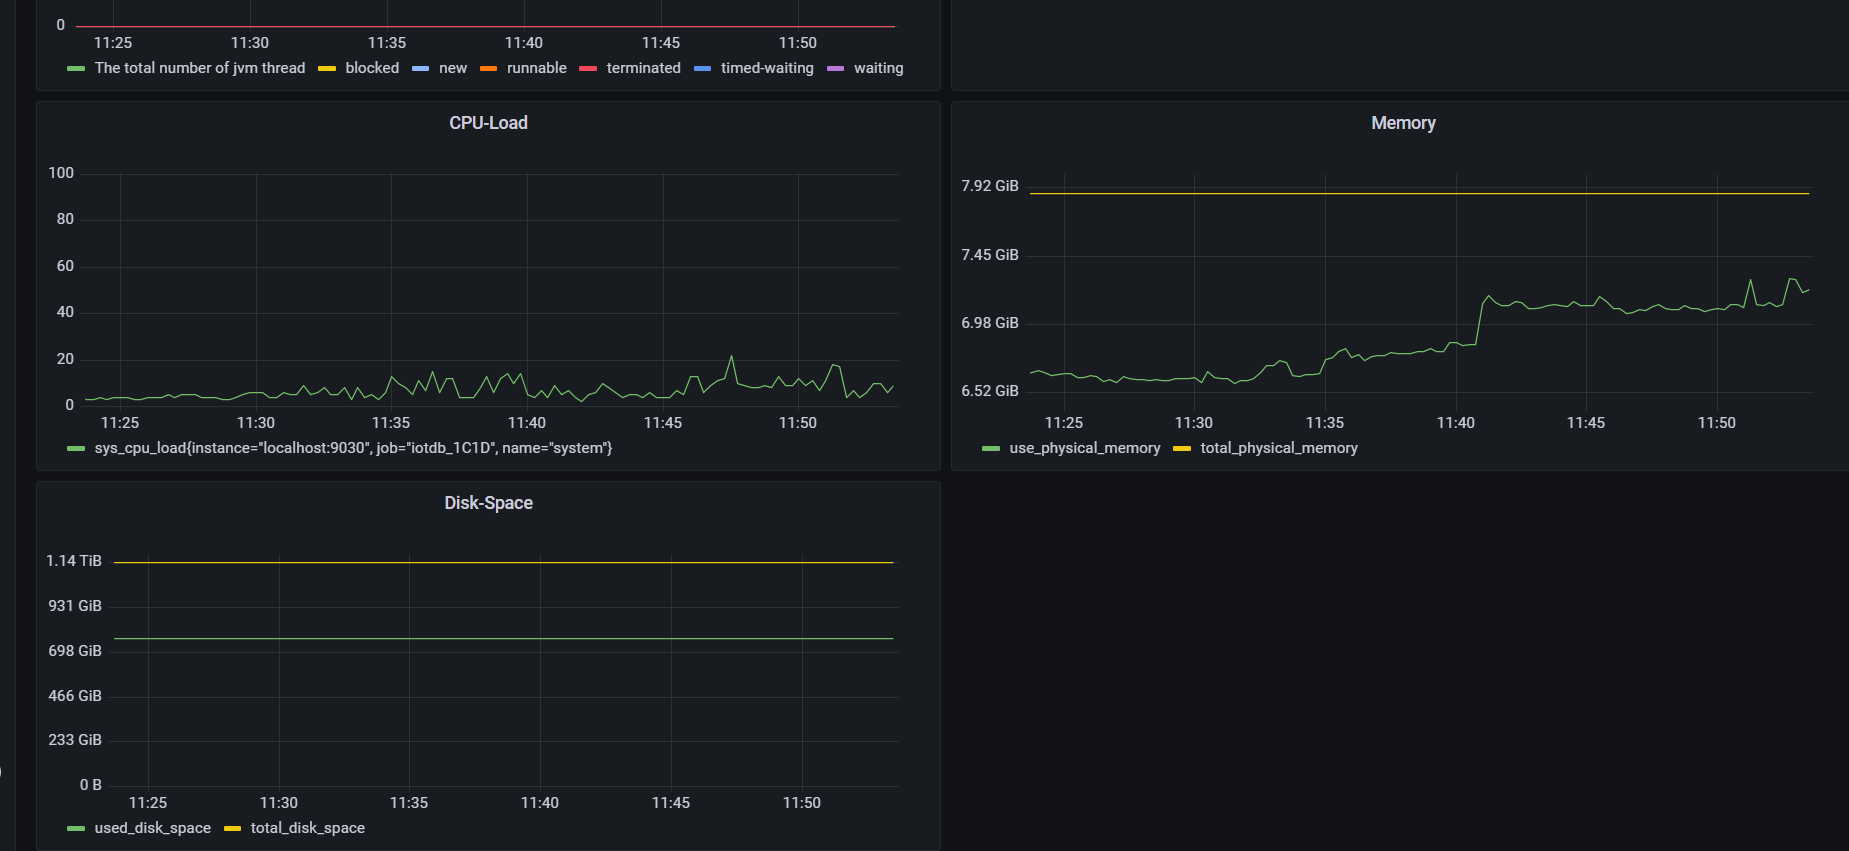
[GitHub] [iotdb] 23931017wu opened a new pull request, #6834: Add the CPU load status, memory status, disk status in DashBoard
23931017wu opened a new pull request, #6834:
URL: https://github.com/apache/iotdb/pull/6834
## Add the CPU load status, memory status, disk status in DashBoard
### Test
--
This is an automated message from the Apache Git Service.
To respond to the message, please log on to GitHub and use the
URL above to go to the specific comment.
To unsubscribe, e-mail: reviews-unsubscribe@iotdb.apache.org
For queries about this service, please contact Infrastructure at:
users@infra.apache.org
[GitHub] [iotdb] 23931017wu commented on a diff in pull request #6834: Add the CPU load status, memory status, disk status in DashBoard
Posted by GitBox <gi...@apache.org>.
23931017wu commented on code in PR #6834:
URL: https://github.com/apache/iotdb/pull/6834#discussion_r932875621


##########
grafana-metrics-example/cluster/Apache IoTDB ConfigNode Dashboard v0.14.0.json:
##########
@@ -1092,6 +1092,282 @@
       ],
       "title": "The time consumed of interface",
       "type": "timeseries"
+    },
+	{
+      "fieldConfig": {
+        "defaults": {
+          "color": {
+            "mode": "palette-classic"
+          },
+          "custom": {
+            "axisLabel": "",
+            "axisPlacement": "auto",
+            "axisSoftMax": 100,
+            "axisSoftMin": 0,
+            "barAlignment": 0,
+            "drawStyle": "line",
+            "fillOpacity": 0,
+            "gradientMode": "none",
+            "hideFrom": {
+              "legend": false,
+              "tooltip": false,
+              "viz": false
+            },
+            "lineInterpolation": "linear",
+            "lineWidth": 1,
+            "pointSize": 5,
+            "scaleDistribution": {
+              "type": "linear"
+            },
+            "showPoints": "auto",
+            "spanNulls": false,
+            "stacking": {
+              "group": "A",
+              "mode": "none"
+            },
+            "thresholdsStyle": {
+              "mode": "off"
+            }
+          },
+          "mappings": [],
+          "thresholds": {
+            "mode": "percentage",
+            "steps": [
+              {
+                "color": "green",
+                "value": null
+              }
+            ]
+          }
+        },
+        "overrides": []
+      },
+      "gridPos": {
+        "h": 8,
+        "w": 12,
+        "x": 0,
+        "y": 50
+      },
+      "id": 42,
+      "options": {
+        "legend": {
+          "calcs": [],
+          "displayMode": "list",
+          "placement": "bottom"
+        },
+        "tooltip": {
+          "mode": "single",
+          "sort": "none"
+        }
+      },
+      "targets": [
+        {
+          "datasource": {
+            "type": "prometheus",
+            "uid": "${DS_PROMETHEUS}"
+          },
+          "exemplar": true,
+          "expr": "sys_cpu_load{instance=\"$instance\",name=\"system\"}",
+          "interval": "",
+          "legendFormat": "",
+          "refId": "A"
+        }
+      ],
+      "title": "CPU-Load",
+      "type": "timeseries"
+    },
+    {
+      "fieldConfig": {
+        "defaults": {
+          "color": {
+            "mode": "palette-classic"
+          },
+          "custom": {
+            "axisLabel": "",
+            "axisPlacement": "auto",
+            "barAlignment": 0,
+            "drawStyle": "line",
+            "fillOpacity": 0,
+            "gradientMode": "none",
+            "hideFrom": {
+              "legend": false,
+              "tooltip": false,
+              "viz": false
+            },
+            "lineInterpolation": "linear",
+            "lineWidth": 1,
+            "pointSize": 5,
+            "scaleDistribution": {
+              "type": "linear"
+            },
+            "showPoints": "auto",
+            "spanNulls": false,
+            "stacking": {
+              "group": "A",
+              "mode": "none"
+            },
+            "thresholdsStyle": {
+              "mode": "off"
+            }
+          },
+          "mappings": [],
+          "thresholds": {
+            "mode": "absolute",
+            "steps": [
+              {
+                "color": "green",
+                "value": null
+              },
+              {
+                "color": "red",
+                "value": 80
+              }
+            ]
+          },

Review Comment:
   OK


--
This is an automated message from the Apache Git Service.
To respond to the message, please log on to GitHub and use the
URL above to go to the specific comment.

To unsubscribe, e-mail: reviews-unsubscribe@iotdb.apache.org

For queries about this service, please contact Infrastructure at:
users@infra.apache.org
[GitHub] [iotdb] neuyilan merged pull request #6834: Add the CPU load status, memory status, disk status in DashBoard
Posted by GitBox <gi...@apache.org>.
neuyilan merged PR #6834:
URL: https://github.com/apache/iotdb/pull/6834


--
This is an automated message from the Apache Git Service.
To respond to the message, please log on to GitHub and use the
URL above to go to the specific comment.

To unsubscribe, e-mail: reviews-unsubscribe@iotdb.apache.org

For queries about this service, please contact Infrastructure at:
users@infra.apache.org
[GitHub] [iotdb] SpriCoder commented on a diff in pull request #6834: Add the CPU load status, memory status, disk status in DashBoard
Posted by GitBox <gi...@apache.org>.
SpriCoder commented on code in PR #6834:
URL: https://github.com/apache/iotdb/pull/6834#discussion_r932869412


##########
grafana-metrics-example/cluster/Apache IoTDB ConfigNode Dashboard v0.14.0.json:
##########
@@ -1092,6 +1092,282 @@
       ],
       "title": "The time consumed of interface",
       "type": "timeseries"
+    },
+	{
+      "fieldConfig": {
+        "defaults": {
+          "color": {
+            "mode": "palette-classic"
+          },
+          "custom": {
+            "axisLabel": "",
+            "axisPlacement": "auto",
+            "axisSoftMax": 100,
+            "axisSoftMin": 0,
+            "barAlignment": 0,
+            "drawStyle": "line",
+            "fillOpacity": 0,
+            "gradientMode": "none",
+            "hideFrom": {
+              "legend": false,
+              "tooltip": false,
+              "viz": false
+            },
+            "lineInterpolation": "linear",
+            "lineWidth": 1,
+            "pointSize": 5,
+            "scaleDistribution": {
+              "type": "linear"
+            },
+            "showPoints": "auto",
+            "spanNulls": false,
+            "stacking": {
+              "group": "A",
+              "mode": "none"
+            },
+            "thresholdsStyle": {
+              "mode": "off"
+            }
+          },
+          "mappings": [],
+          "thresholds": {
+            "mode": "percentage",
+            "steps": [
+              {
+                "color": "green",
+                "value": null
+              }
+            ]
+          }
+        },
+        "overrides": []
+      },
+      "gridPos": {
+        "h": 8,
+        "w": 12,
+        "x": 0,
+        "y": 50
+      },
+      "id": 42,
+      "options": {
+        "legend": {
+          "calcs": [],
+          "displayMode": "list",
+          "placement": "bottom"
+        },
+        "tooltip": {
+          "mode": "single",
+          "sort": "none"
+        }
+      },
+      "targets": [
+        {
+          "datasource": {
+            "type": "prometheus",
+            "uid": "${DS_PROMETHEUS}"
+          },
+          "exemplar": true,
+          "expr": "sys_cpu_load{instance=\"$instance\",name=\"system\"}",
+          "interval": "",
+          "legendFormat": "",
+          "refId": "A"
+        }
+      ],
+      "title": "CPU-Load",
+      "type": "timeseries"
+    },
+    {
+      "fieldConfig": {
+        "defaults": {
+          "color": {
+            "mode": "palette-classic"
+          },
+          "custom": {
+            "axisLabel": "",
+            "axisPlacement": "auto",
+            "barAlignment": 0,
+            "drawStyle": "line",
+            "fillOpacity": 0,
+            "gradientMode": "none",
+            "hideFrom": {
+              "legend": false,
+              "tooltip": false,
+              "viz": false
+            },
+            "lineInterpolation": "linear",
+            "lineWidth": 1,
+            "pointSize": 5,
+            "scaleDistribution": {
+              "type": "linear"
+            },
+            "showPoints": "auto",
+            "spanNulls": false,
+            "stacking": {
+              "group": "A",
+              "mode": "none"
+            },
+            "thresholdsStyle": {
+              "mode": "off"
+            }
+          },
+          "mappings": [],
+          "thresholds": {
+            "mode": "absolute",
+            "steps": [
+              {
+                "color": "green",
+                "value": null
+              },
+              {
+                "color": "red",
+                "value": 80
+              }
+            ]
+          },

Review Comment:
   There are no need to set thresholds in Basic Dashboard.


--
This is an automated message from the Apache Git Service.
To respond to the message, please log on to GitHub and use the
URL above to go to the specific comment.

To unsubscribe, e-mail: reviews-unsubscribe@iotdb.apache.org

For queries about this service, please contact Infrastructure at:
users@infra.apache.org