You are viewing a plain text version of this content. The canonical link for it is here.
Posted to dev@echarts.apache.org by GitBox <gi...@apache.org> on 2018/09/16 08:02:06 UTC
[GitHub] mya12321 commented on issue #9084: Chart collapsed when set height
of chart around 120px.
mya12321 commented on issue #9084: Chart collapsed when set height of chart around 120px.
URL: https://github.com/apache/incubator-echarts/issues/9084#issuecomment-421719954
> You can use `top`/`right`/`bottom`/`left` properties to layout each componet. But I don't suggest you displaying so many components in such a small area.
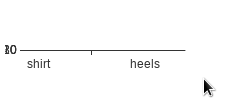
I can remove other components, only remain chart content, but it's the same issue:
```javascript
option = {
xAxis: {
data: ["shirt","cardign","chiffon shirt","pants","heels","socks"]
},
yAxis: {},
series: [{
name: 'Sales',
type: 'bar',
data: [5, 20, 36, 10, 10, 20]
}]
}
```
The result like below:
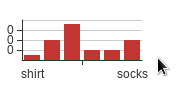
Once you change the height smaller, it should be much better:
`<div id="chart" style="width: 150px;height: 80px;">`
----------------------------------------------------------------
This is an automated message from the Apache Git Service.
To respond to the message, please log on GitHub and use the
URL above to go to the specific comment.
For queries about this service, please contact Infrastructure at:
users@infra.apache.org
With regards,
Apache Git Services
---------------------------------------------------------------------
To unsubscribe, e-mail: dev-unsubscribe@echarts.apache.org
For additional commands, e-mail: dev-help@echarts.apache.org