You are viewing a plain text version of this content. The canonical link for it is here.
Posted to dev@echarts.apache.org by GitBox <gi...@apache.org> on 2018/09/14 05:05:34 UTC
[GitHub] Yi-Frank opened a new issue #9070: 关于dataZoom存在时, 拖动时点绘制偏移的问题
Yi-Frank opened a new issue #9070: 关于dataZoom存在时, 拖动时点绘制偏移的问题
URL: https://github.com/apache/incubator-echarts/issues/9070
### One-line summary [问题简述]
其实也不算bug...算是优化建议吧...关于dataZoom存在时, 拖动时点绘制偏移的问题...
### Version & Environment [版本及环境]
+ ECharts version [ECharts 版本]: 4.1.0
+ Browser version [浏览器类型和版本]: Mozilla/5.0 (Windows NT 10.0; WOW64) AppleWebKit/537.36 (KHTML, like Gecko) Chrome/68.0.3440.106 Safari/537.36
+ OS Version [操作系统类型和版本]:Windows NT 10.0; WOW64
### Expected behaviour [期望结果]
当dataZoom存在时, 重新绘制不产生偏移
### ECharts option [ECharts配置项]
<!-- Copy and paste your 'echarts option' here. -->
<!-- [下方贴你的option,注意不要删掉下方 ```javascript 和 尾部的 ``` 字样。最好是我们能够直接运行的 option。如何得到能运行的 option 参见上方的 guidelines for contributing] -->
```javascript
option = {
{
backgroundColor: '#fff',
axisPointer: {
link: {
xAxisIndex: 'all',
},
label: {
backgroundColor: '#777'
}
},
tooltip: {
trigger: 'axis',
position: function (pos, params, el, elRect, size) {
var obj = {top: 10};
obj[['left', 'right'][+(pos[0] < size.viewSize[0] / 2)]] = 30;
return obj;
},
formatter: function (params) {
var re;
// console.log(params);
if(params.length == 4){
re = params[0].marker+(params[0].axisValue >= 60 ? parseInt(params[0].axisValue/60)+' 分 ': '') + (params[0].axisValue % 60 )+' 秒';
for(let item of params){
re += '<br>'+ item.seriesName + ': ' + item.data.toFixed(2) ;
}
}else if(params.length == 8){
re = (params[0].axisValue >= 60 ? parseInt(params[0].axisValue/60)+' 分 ': '') + (params[0].axisValue % 60 )+' 秒';
var this_time = '<br>'+params[0].marker+'当前:';
var last_time = '<br>'+params[1].marker+'上次:';
for(let item of params){
if(item.seriesIndex < 4){
this_time += '<br>'+ item.seriesName + ': ' + item.data.toFixed(2);
}else{
last_time += '<br>'+ item.seriesName + ': ' + item.data.toFixed(2);
}
}
re += this_time + last_time;
}else{
var point;
var has_val = '';
for(let item of params){
if(!isNaN(item.data)){
point = item.marker;
has_val += '<br>'+ item.seriesName + ': ' + item.data.toFixed(2);
}
}
re = point + (params[0].axisValue >= 60 ? parseInt(params[0].axisValue/60)+' 分 ': '') + (params[0].axisValue % 60).toFixed(1)+' 秒' + has_val;
}
return re;
}
},
grid: [
{
left: '40',
right: '40',
top: '5%',
height: '45%'
},
{
left: '40',
right: '40',
top: '50%',
height: '5%'
},
{
left: '40',
right: '40',
top: '55%',
height: '5%'
},
{
left: '40',
right: '40',
top: '60%',
height: '5%'
}
],
xAxis:[
{
type: 'category',
data: xTime,
boundaryGap: false,
gridIndex: 0,
axisLabel: {show: false},
axisTick: {show: false},
},
{
type: 'category',
data: xTime,
boundaryGap: false,
gridIndex: 1,
axisLabel: {show: false},
axisTick: {show: false},
},
{
type: 'category',
data: xTime,
boundaryGap: false,
gridIndex: 2,
axisLabel: {show: false},
axisTick: {show: false},
},
{
type: 'category',
name: '时间(s)',
data: xTime,
boundaryGap: false,
gridIndex: 3,
nameGap: 3,
nameLocation: 'end',
nameTextStyle:{
fontSize: 10
}
}
],
yAxis:[
{
type: 'value',
gridIndex: 0,
name: '速度(km/h)',
nameGap: 10,
nameTextStyle:{
fontSize: 10
}
},
{
type: 'category',
data: ['离合'],
gridIndex: 1,
},
{
type: 'category',
data: ['刹车'],
gridIndex: 2,
},
{
type: 'category',
data: ['油门'],
gridIndex: 3,
}
],
dataZoom:[
{
type: 'inside',
xAxisIndex: [0, 1, 2, 3],
start: 0,
end: 50,
filterMode: 'empty'
},
{
show: true,
xAxisIndex: [0, 1, 2, 3],
type: 'slider',
top: '70%',
start: 0,
end: 50,
filterMode: 'empty'
}
],
series: [
{
name:'速度(km/h)',
type: 'line',
smooth: false,
data: p_data[0].analysis.speed_curves.S_Points,
xAxisIndex: 0,
yAxisIndex: 0,
lineStyle:{
color: 'rgb(26, 173, 25)',
width: 3,
},
itemStyle:{
color: 'rgb(26, 173, 25)',
},
zlevel: 1,
},
{
name:'离合力度',
type: 'scatter',
symbol:'roundRect',
symbolSize: function (val) {
return val*scatter_x;
},
data: p_data[0].analysis.clutch_curves.S_Points,
xAxisIndex: 1,
yAxisIndex: 1,
itemStyle:{
color: 'rgb(26, 173, 25)',
},
large: true,
zlevel: 1,
},
{
name:'刹车力度',
type: 'scatter',
symbol:'roundRect',
symbolSize: function (val) {
return val*scatter_x;
},
data: p_data[0].analysis.brake_curves.S_Points,
xAxisIndex: 2,
yAxisIndex: 2,
itemStyle:{
color: 'rgb(26, 173, 25)',
},
large: true,
zlevel: 1,
},
{
name:'油门力度',
type: 'scatter',
symbol:'roundRect',
symbolSize: function (val) {
return val*scatter_x;
},
data: p_data[0].analysis.accelerator_curves.S_Points,
xAxisIndex: 3,
yAxisIndex: 3,
itemStyle:{
color: 'rgb(26, 173, 25)',
},
large: true,
zlevel: 1,
},
]
}
}
```
### Other comments [其他信息]
<!-- For example: Screenshot or Online demo -->
<!-- [例如,截图或线上实例 (JSFiddle/JSBin/Codepen)] -->
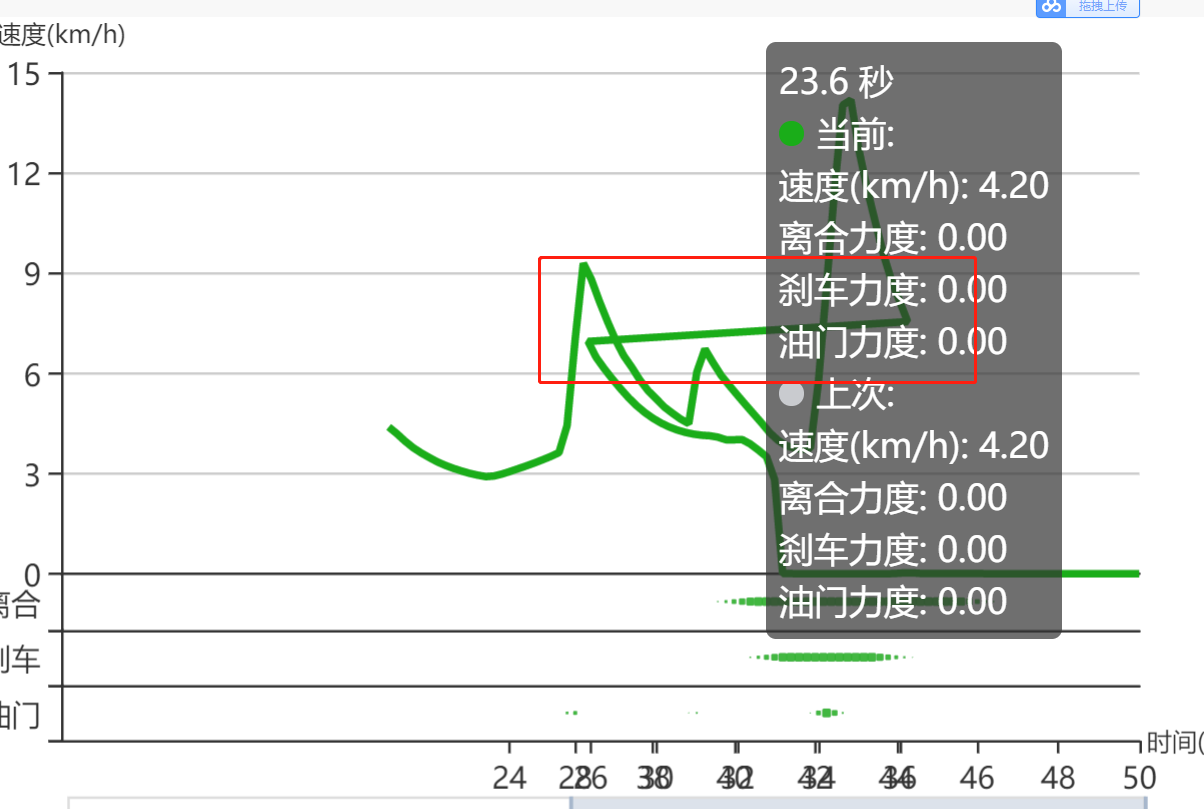
线上实例, 主要使用与移动端(PC端也可以访问), 但由于移动端性能原因, 重新绘制偏移的问题会更严重: https://cgs.cpvrt.com/test_yb
----------------------------------------------------------------
This is an automated message from the Apache Git Service.
To respond to the message, please log on GitHub and use the
URL above to go to the specific comment.
For queries about this service, please contact Infrastructure at:
users@infra.apache.org
With regards,
Apache Git Services
---------------------------------------------------------------------
To unsubscribe, e-mail: dev-unsubscribe@echarts.apache.org
For additional commands, e-mail: dev-help@echarts.apache.org