You are viewing a plain text version of this content. The canonical link for it is here.
Posted to notifications@apisix.apache.org by GitBox <gi...@apache.org> on 2022/01/06 03:15:33 UTC
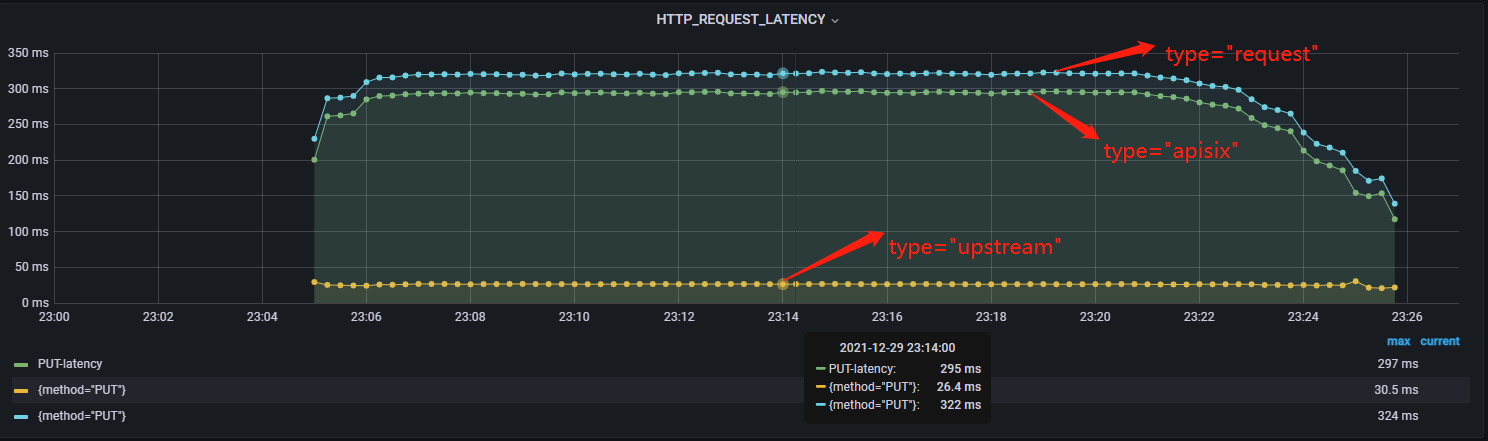
[GitHub] [apisix] zhendongcmss opened a new issue #6029: bug: It is not inappropriate using “apisix” type for prometheus metrics(count first bytes from client)
zhendongcmss opened a new issue #6029:
URL: https://github.com/apache/apisix/issues/6029
### Issue description
Because the `apisix_latency` include read contents from client, not ONLY apisix process time. It is very confused on the dashbord and got apisix lead to high latency.
https://github.com/apache/apisix/blob/aff5d825aaea12eab312e65e82d060ab9be9b06f/apisix/utils/log-util.lua#L189
https://github.com/apache/apisix/blob/aff5d825aaea12eab312e65e82d060ab9be9b06f/apisix/plugins/prometheus/exporter.lua#L164
### Environment
- apisix version (cmd: `apisix version`): master branch
- OS (cmd: `uname -a`):
- OpenResty / Nginx version (cmd: `nginx -V` or `openresty -V`):
- etcd version, if have (cmd: run `curl http://127.0.0.1:9090/v1/server_info` to get the info from server-info API):
- apisix-dashboard version, if have:
- the plugin runner version, if the issue is about a plugin runner (cmd: depended on the kind of runner):
- luarocks version, if the issue is about installation (cmd: `luarocks --version`):
### Steps to reproduce
I suggest use "apisix-and-client" type.
### Actual result
nil
### Error log
nil
### Expected result
_No response_
--
This is an automated message from the Apache Git Service.
To respond to the message, please log on to GitHub and use the
URL above to go to the specific comment.
To unsubscribe, e-mail: notifications-unsubscribe@apisix.apache.org
For queries about this service, please contact Infrastructure at:
users@infra.apache.org
[GitHub] [apisix] tzssangglass commented on issue #6029: discuss: It is not inappropriate using “apisix” type for prometheus metrics(count first bytes from client)
Posted by GitBox <gi...@apache.org>.
tzssangglass commented on issue #6029:
URL: https://github.com/apache/apisix/issues/6029#issuecomment-1006577360


   I prefer break change to make the metrics clearer, but of course, we need the mailing list to discuss that.


--
This is an automated message from the Apache Git Service.
To respond to the message, please log on to GitHub and use the
URL above to go to the specific comment.

To unsubscribe, e-mail: notifications-unsubscribe@apisix.apache.org

For queries about this service, please contact Infrastructure at:
users@infra.apache.org
[GitHub] [apisix] zhendongcmss edited a comment on issue #6029: discuss: It is not inappropriate using “apisix” type for prometheus metrics(count first bytes from client)
Posted by GitBox <gi...@apache.org>.
zhendongcmss edited a comment on issue #6029:
URL: https://github.com/apache/apisix/issues/6029#issuecomment-1006535320


   @spacewander Add notes on doc is easy. But it doesn't dispel confused. See the Grafana dashboard person is different with seening the document.


--
This is an automated message from the Apache Git Service.
To respond to the message, please log on to GitHub and use the
URL above to go to the specific comment.

To unsubscribe, e-mail: notifications-unsubscribe@apisix.apache.org

For queries about this service, please contact Infrastructure at:
users@infra.apache.org
[GitHub] [apisix] tzssangglass commented on issue #6029: discuss: It is not inappropriate using “apisix” type for prometheus metrics(count first bytes from client)
Posted by GitBox <gi...@apache.org>.
tzssangglass commented on issue #6029:
URL: https://github.com/apache/apisix/issues/6029#issuecomment-1068687942


   > do you mean read contents from client cost a lot of time? Why does it take so much time in read data.

   For example, in file upload scenario, it takes a long time to read the data from the client


--
This is an automated message from the Apache Git Service.
To respond to the message, please log on to GitHub and use the
URL above to go to the specific comment.

To unsubscribe, e-mail: notifications-unsubscribe@apisix.apache.org

For queries about this service, please contact Infrastructure at:
users@infra.apache.org
[GitHub] [apisix] xianshun163 commented on issue #6029: discuss: It is not inappropriate using “apisix” type for prometheus metrics(count first bytes from client)
Posted by GitBox <gi...@apache.org>.
xianshun163 commented on issue #6029:
URL: https://github.com/apache/apisix/issues/6029#issuecomment-1068706468


   Yes, I found that although QPS is not high, but  there is file transfer


--
This is an automated message from the Apache Git Service.
To respond to the message, please log on to GitHub and use the
URL above to go to the specific comment.

To unsubscribe, e-mail: notifications-unsubscribe@apisix.apache.org

For queries about this service, please contact Infrastructure at:
users@infra.apache.org
[GitHub] [apisix] xianshun163 commented on issue #6029: discuss: It is not inappropriate using “apisix” type for prometheus metrics(count first bytes from client)
Posted by GitBox <gi...@apache.org>.
xianshun163 commented on issue #6029:
URL: https://github.com/apache/apisix/issues/6029#issuecomment-1068669911
@zhendongcmss @tzssangglass
Because the `apisix_latency` include read contents from client, not ONLY apisix process time.
do you mean read contents from client cost a lot of time? Why does it take so much time in read data.
> ### Issue description
> Because the `apisix_latency` include read contents from client, not ONLY apisix process time. It is very confused on the dashbord and got resault that apisix lead to high latency.
>
> https://github.com/apache/apisix/blob/aff5d825aaea12eab312e65e82d060ab9be9b06f/apisix/utils/log-util.lua#L189
>
>
> https://github.com/apache/apisix/blob/aff5d825aaea12eab312e65e82d060ab9be9b06f/apisix/plugins/prometheus/exporter.lua#L164
>
> 
>
> ### Environment
> * apisix version (cmd: `apisix version`): master branch
> * OS (cmd: `uname -a`):
> * OpenResty / Nginx version (cmd: `nginx -V` or `openresty -V`):
> * etcd version, if have (cmd: run `curl http://127.0.0.1:9090/v1/server_info` to get the info from server-info API):
> * apisix-dashboard version, if have:
> * the plugin runner version, if the issue is about a plugin runner (cmd: depended on the kind of runner):
> * luarocks version, if the issue is about installation (cmd: `luarocks --version`):
>
> ### Steps to reproduce
> I suggest use "apisix-and-client" type.
>
> ### Actual result
> nil
>
> ### Error log
> nil
>
> ### Expected result
> _No response_
--
This is an automated message from the Apache Git Service.
To respond to the message, please log on to GitHub and use the
URL above to go to the specific comment.
To unsubscribe, e-mail: notifications-unsubscribe@apisix.apache.org
For queries about this service, please contact Infrastructure at:
users@infra.apache.org
[GitHub] [apisix] zhendongcmss commented on issue #6029: discuss: It is not inappropriate using “apisix” type for prometheus metrics(count first bytes from client)
Posted by GitBox <gi...@apache.org>.
zhendongcmss commented on issue #6029:
URL: https://github.com/apache/apisix/issues/6029#issuecomment-1006535320


   @spacewander Add notes on doc is easy. But it doesn't dispel confused. See the Grafana dashboard persion is different with seening the document.


--
This is an automated message from the Apache Git Service.
To respond to the message, please log on to GitHub and use the
URL above to go to the specific comment.

To unsubscribe, e-mail: notifications-unsubscribe@apisix.apache.org

For queries about this service, please contact Infrastructure at:
users@infra.apache.org
[GitHub] [apisix] spacewander commented on issue #6029: discuss: It is not inappropriate using “apisix” type for prometheus metrics(count first bytes from client)
Posted by GitBox <gi...@apache.org>.
spacewander commented on issue #6029:
URL: https://github.com/apache/apisix/issues/6029#issuecomment-1006405618


   Yes, people often found that the APISIX latency is high caused by slow clients. But changing the type will be a break change.

   What about adding a note in the doc: https://github.com/apache/apisix/blob/master/docs/en/latest/plugins/prometheus.md?


--
This is an automated message from the Apache Git Service.
To respond to the message, please log on to GitHub and use the
URL above to go to the specific comment.

To unsubscribe, e-mail: notifications-unsubscribe@apisix.apache.org

For queries about this service, please contact Infrastructure at:
users@infra.apache.org
[GitHub] [apisix] xianshun163 edited a comment on issue #6029: discuss: It is not inappropriate using “apisix” type for prometheus metrics(count first bytes from client)
Posted by GitBox <gi...@apache.org>.
xianshun163 edited a comment on issue #6029:
URL: https://github.com/apache/apisix/issues/6029#issuecomment-1068669911


   @zhendongcmss @tzssangglass

   " Because the `apisix_latency` include read contents from client, not ONLY apisix process time. "
   do you  mean read contents from client cost a  lot of time?   Why does it take so much time in  read data.


--
This is an automated message from the Apache Git Service.
To respond to the message, please log on to GitHub and use the
URL above to go to the specific comment.

To unsubscribe, e-mail: notifications-unsubscribe@apisix.apache.org

For queries about this service, please contact Infrastructure at:
users@infra.apache.org