You are viewing a plain text version of this content. The canonical link for it is here.
Posted to commits@echarts.apache.org by GitBox <gi...@apache.org> on 2021/04/23 03:38:15 UTC
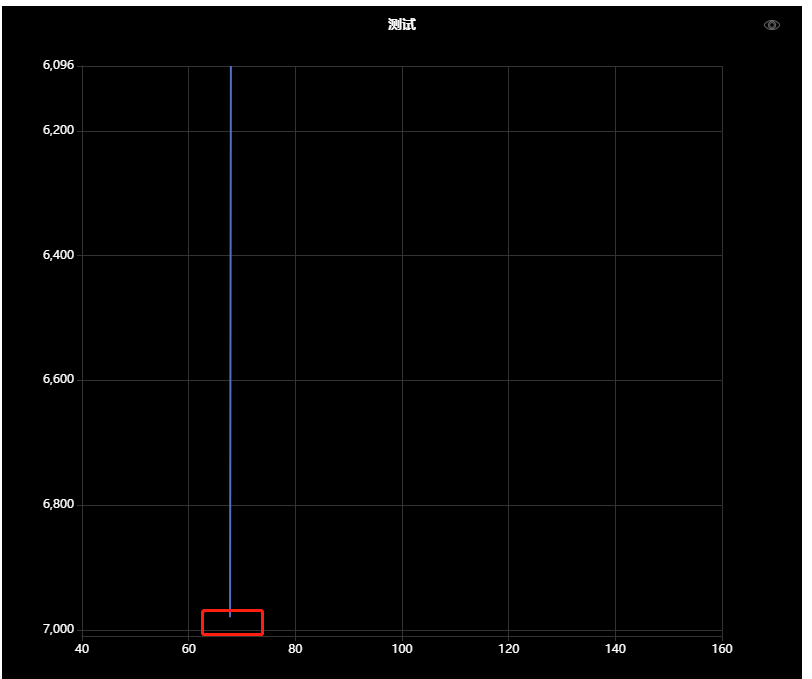
[GitHub] [echarts] Alexander-txj edited a comment on issue #14763: After using the toolbox, the graphics are wrong
Alexander-txj edited a comment on issue #14763:
URL: https://github.com/apache/echarts/issues/14763#issuecomment-825362721
@Ovilia https://codepen.io/alexander-txj/pen/yLgGbeB
I need to draw such an area chart. But after using the toolbox, the area chart becomes invalid. If you use a custom toolbox, there will be cases where the line exceeding the maximum value is not connected

--
This is an automated message from the Apache Git Service.
To respond to the message, please log on to GitHub and use the
URL above to go to the specific comment.
For queries about this service, please contact Infrastructure at:
users@infra.apache.org
---------------------------------------------------------------------
To unsubscribe, e-mail: commits-unsubscribe@echarts.apache.org
For additional commands, e-mail: commits-help@echarts.apache.org