You are viewing a plain text version of this content. The canonical link for it is here.
Posted to commits@echarts.apache.org by GitBox <gi...@apache.org> on 2022/08/08 14:44:32 UTC
[GitHub] [echarts] dvago opened a new issue, #17487: [Bug] DataZoom doesn't represent correctly multi series charts
dvago opened a new issue, #17487:
URL: https://github.com/apache/echarts/issues/17487
### Version
5.3.3
### Link to Minimal Reproduction
https://echarts.apache.org/examples/en/editor.html?code=PYBwLglsB2AEC8sDeAoWsDGwA2wBOAXLANoBEAxAMyUCcAHACIBCpAugDRqxjA6QhFU6dGDwQA5uICmhWKQCGADwgBnUlwC-ndIoCCylYK7oAJvLDyiZAEwAGAIwAWALS2A7M6el2cu09ce9gCs3r4OLu6eAGyhpH4RgW6x8QGedMnhqfY0Gf6RdrkJztb2hanW1mX5lFUe1o61xSE-cZn5MS0p-UmdbXXpvXl1OYNFlLaNlKWjrnSu02F5c7aVM7bLNWvLzYsRyx27swFVywOH664j53P2E1ueC61LnqvXnptvXvfBJ9G_9j1PmcnntPFcQUcCvcSr8KrCPhCLvVYTtEXNrAc0cVAVjrMCuujwQTnONflMqjR5hTXAiupTbA01vTUXTXJjWe5qesuUS2pTbtT7I9WfZXoj-bS-Z5Ged-SypfZ2QqcSL8QreXlKVDZcVhVK4UzipLNcUZeKmtSMZaVfq1SbrBqIpTSTNblTXbZXGKUm7bMaXL6zT7PbZ5f5fUrwyGbVHZmVfY7PJ6BR6HvHk0HMm6fqnFenPDGA8m7UWwfntRC3TDUwbDlX_UnTeWw6WrTXC428eXE26XXXPeTXfZ3XXh3742PM-Gxy2Hsch3GF7Ye8OU6O0wv7A2hdKJ55Zzu85uO4eS3PsnvrNvh8iF9YDzfIwGbyeb2edw749YR5XvysvzSAGhkBT4vPOdZ_u-f49t-a6_huEHvABXyITmqEnrBMHFN6WbfleAH3gRoGitiBFQcUWF9k8QTzD-fg0Q4Xq5AxY7GixrhTuxwGDFxkZcTGXF2lxGrsXB9G0UKzESThwQSWxEmcRJYaiXxEkCRJQkSSJtEVuJjG1tROnyfpin6cpOmqfpmn6dpjGDosDF_nqskrExPFeoB7mudxDkebYlnQVJrliQ4jkIYZwUyWFW5BbBpmweZw
UBWksVll5eF3L5rnVlleFRR5-HpU2rCaNosAAJ76KoRjCLAKggNgEBgAAMhA0BSDVtV1QAFsAADuRAAGbyNgKhSMYsAaKVXBmBYABavAALZWEgGgcFwY1iFIhjIBN0DyItHVyEwUgQAAVm14iwLoACKACS3gTWA5UgEdpAAEbyHgj21bNlgkMEUQ-E4tjA9QwN0EDsD2HQ1jA_5wPZD4UR0D4QSOD4sM-DQoPQ5QGPQ3QqPQzQBPBDQwNBBT0NRNT9RkzQ1OKpQwOONTdC41EbjA1EcPQ44uNOCz0P3j4bhQ0K1NuILDLw0zVPA_UYNBJTgtRGTtOY8LwQq7Abi6wrevE1uEt-vDZPi5jTPWNzsDo_DgsCxDUN2Jz9hy4j7vQ042O26TyNQ_bsB0LbHOY2TAI88bDqK7b6vI47Fu40ExMh2LyfCzQfNuNHmcGwTKM-K7PhTATlBuNT-Mu-Dwe424wuW3jfMlF7eJ00EuNY7AjM88LGK25QQQN8Tbh80TrO43YLuy7AUQG_LdfU1EmfC2H3fz8jutuLbQvY8T8fd33Xc69jDMuzQq_az7sA24HBcG17vNW5vmPN43wTC0EfOa97q98z3dttZm2hrYOu2sgi63qOA3WopdZzxfnrOmoCi4YkVt_TuMCcbw0gesNGTMoiTyFEXeBsBKCQ0Rqnam_s9Y7y3KzPuQRaE7zoDApGs9dZp1njLY249-bCyfiAwWX8eaBw3tDfWRcL4l1QdDIeYs-5cwhsLWgZMU6Y2nm4Eq6ApoaCAA&_source=echarts-doc-preview
### Steps to Reproduce
Replace the example with the following snippet:
```
option = {
tooltip: {
trigger: "axis"
},
xAxis: {
data: ["2014-07-14", "2014-07-15", "2014-07-16", "2014-07-17", "2014-07-18", "2014-07-19", "2014-07-20", "2014-07-21", "2014-07-22", "2014-07-23", "2014-07-24", "2014-07-25", "2014-07-26", "2014-07-27", "2014-07-28"]
},
yAxis: {
splitLine: {
show: false
}
},
dataZoom: [{}],
legend: {
show: true
},
series: [
{
name: "Carrots",
type: "line",
itemStyle: {
color: "rgba(83, 63, 123, 0.75)"
},
data: [1, 2, 3, 4, 5, 6, null, null, null, null, null, null, null, null, null]
},
{
name: "Potato",
type: "line",
itemStyle: {
color: "rgba(255, 125, 35, 0.75)"
},
data: [null, null, null, null, null, 6, 7, 8, 9, 10, 11, 12, 13, 14, 15]
},
]
}
```
### Current Behavior
The data zoom shows one of the 2 lines within the minimap
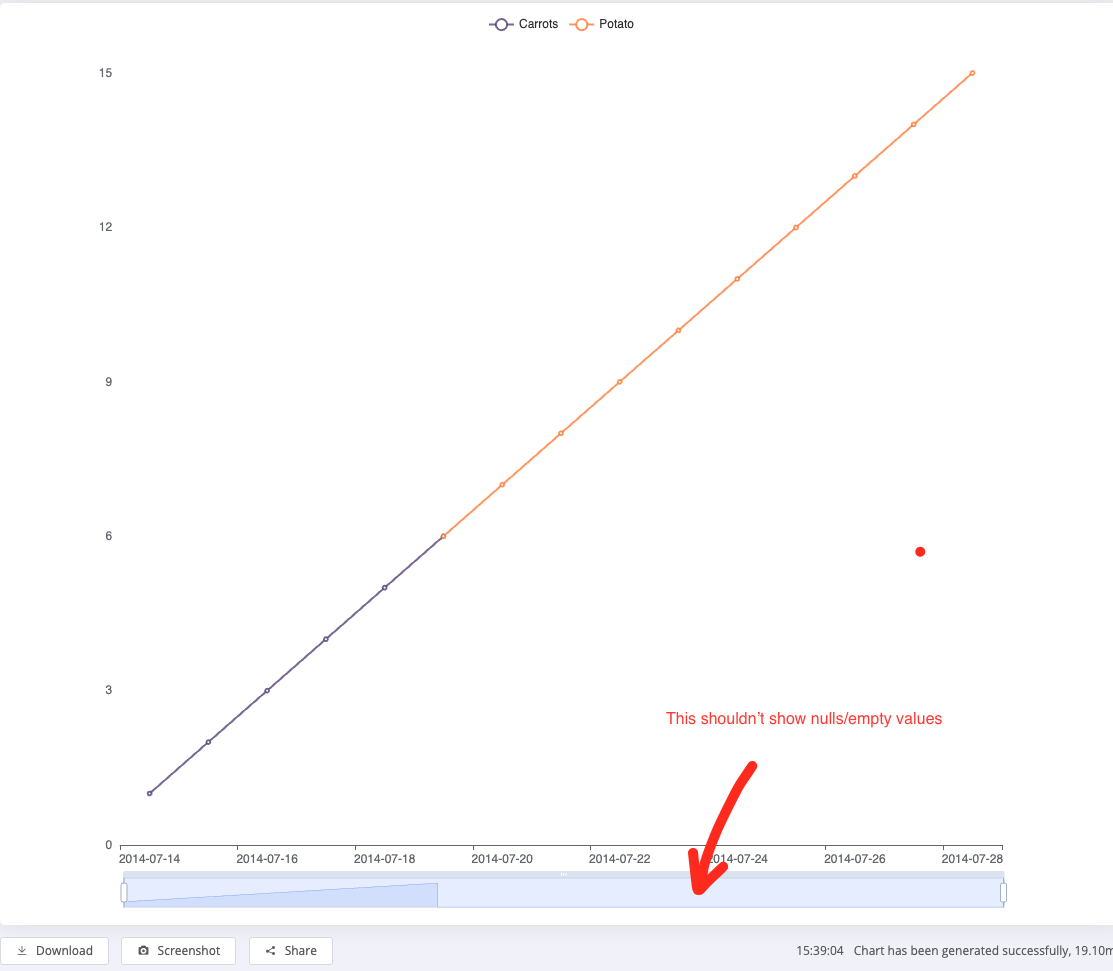
### Expected Behavior
The data zoom should show the shape of both of the lines as it looks completely wrong
### Environment
```markdown
- OS: n/a
- Browser: n/a
- Framework: n/a
```
### Any additional comments?
_No response_
--
This is an automated message from the Apache Git Service.
To respond to the message, please log on to GitHub and use the
URL above to go to the specific comment.
To unsubscribe, e-mail: commits-unsubscribe@echarts.apache.org.apache.org
For queries about this service, please contact Infrastructure at:
users@infra.apache.org
---------------------------------------------------------------------
To unsubscribe, e-mail: commits-unsubscribe@echarts.apache.org
For additional commands, e-mail: commits-help@echarts.apache.org
[GitHub] [echarts] Ovilia commented on issue #17487: [Bug] DataZoom doesn't represent correctly multi series charts
Posted by GitBox <gi...@apache.org>.
Ovilia commented on issue #17487:
URL: https://github.com/apache/echarts/issues/17487#issuecomment-1208882680

   Let's see if we could fix this in #17143


--
This is an automated message from the Apache Git Service.
To respond to the message, please log on to GitHub and use the
URL above to go to the specific comment.

To unsubscribe, e-mail: commits-unsubscribe@echarts.apache.org

For queries about this service, please contact Infrastructure at:
users@infra.apache.org


---------------------------------------------------------------------
To unsubscribe, e-mail: commits-unsubscribe@echarts.apache.org
For additional commands, e-mail: commits-help@echarts.apache.org