You are viewing a plain text version of this content. The canonical link for it is here.
Posted to commits@echarts.apache.org by GitBox <gi...@apache.org> on 2021/10/29 13:50:48 UTC
[GitHub] [echarts] ragava28 commented on issue #15960: Create Horizontal Bar chart using both axis as type 'Value'.
ragava28 commented on issue #15960:
URL: https://github.com/apache/echarts/issues/15960#issuecomment-954761169
@Ovilia ,
We are trying to to build some thing like below where x & y axis are continues numbers.
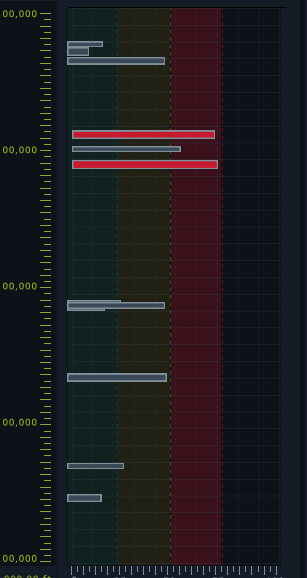
Our data in x & y axis is not discreate (like category) .
So for that we tried below configuration .
==========================
option = {
title: {
text: 'Depth Vs Level Of Concern'
},
tooltip: {
trigger: 'axis',
axisPointer: {
type: 'shadow'
}
},
xAxis: {
type: 'value',
name : 'Level of concern'
},
yAxis: {
type: 'value',
name : 'Depth'
},
series: [
{
type: 'bar',
data: [[40,100], [50,200], [60,500], [60,800]] // [xAxis, yAxis]
}
]
};
==========================
this is drawing bars on xAxis always , how do we change orientation of the these bars so that they are horizontally aligned on Yaxis with out using Category axis .
--
This is an automated message from the Apache Git Service.
To respond to the message, please log on to GitHub and use the
URL above to go to the specific comment.
To unsubscribe, e-mail: commits-unsubscribe@echarts.apache.org
For queries about this service, please contact Infrastructure at:
users@infra.apache.org
---------------------------------------------------------------------
To unsubscribe, e-mail: commits-unsubscribe@echarts.apache.org
For additional commands, e-mail: commits-help@echarts.apache.org