You are viewing a plain text version of this content. The canonical link for it is here.
Posted to commits@echarts.apache.org by GitBox <gi...@apache.org> on 2022/06/13 12:17:30 UTC
[GitHub] [echarts] DavidMarquezF opened a new issue, #17210: [Feature] Bar marker line
DavidMarquezF opened a new issue, #17210:
URL: https://github.com/apache/echarts/issues/17210
### What problem does this feature solve?
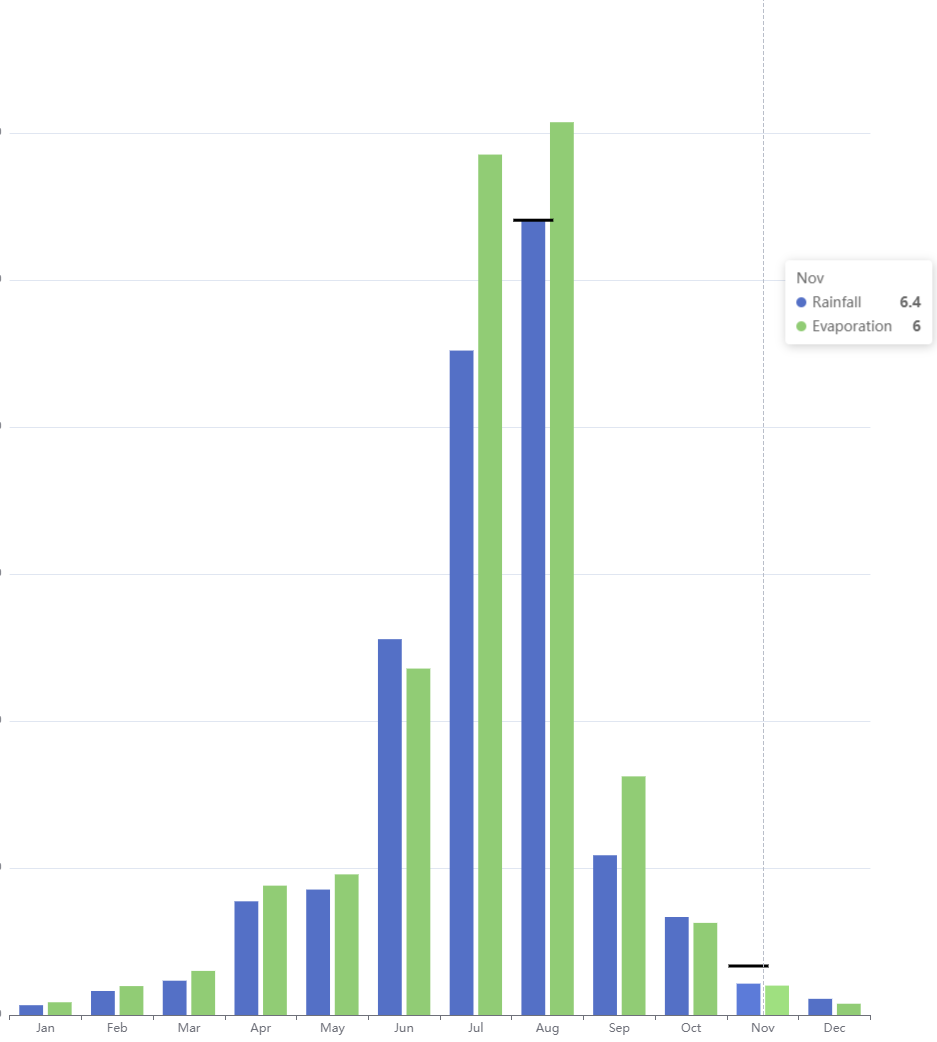
There is no way to create marker lines for each bar with an appropiate width. There is a workaround with marker pointers, but the width has to be hardcoded, which means that it doesn't respond to changes in number of bars, redimension, etc.
The workaround:
```
option = {
title: {
text: 'Rainfall vs Evaporation',
subtext: 'Fake Data'
},
tooltip: {
trigger: 'axis'
},
legend: {
data: ['Rainfall', 'Evaporation']
},
toolbox: {
show: true,
feature: {
dataView: { show: true, readOnly: false },
magicType: { show: true, type: ['line', 'bar'] },
restore: { show: true },
saveAsImage: { show: true }
}
},
calculable: true,
xAxis: [
{
type: 'category',
// prettier-ignore
data: ['Jan', 'Feb', 'Mar', 'Apr', 'May', 'Jun', 'Jul', 'Aug', 'Sep', 'Oct', 'Nov', 'Dec']
}
],
yAxis: [
{
type: 'value'
}
],
series: [
{
name: 'Rainfall',
type: 'bar',
data: [
2.0, 4.9, 7.0, 23.2, 25.6, 76.7, 135.6, 162.2, 32.6, 20.0, 6.4, 3.3
],
markPoint: {
data: [
{ type: 'max', name: 'Max' },
{ type: 'min', name: 'Min', coord: [10,10] }
],
symbol: "rect",
silent: true,
symbolSize: [40,3],
itemStyle: {color: "black"},
label: {show: false },
},
},
{
name: 'Evaporation',
type: 'bar',
data: [
2.6, 5.9, 9.0, 26.4, 28.7, 70.7, 175.6, 182.2, 48.7, 18.8, 6.0, 2.3
],
}
]
};
```
Result:

### What does the proposed API look like?
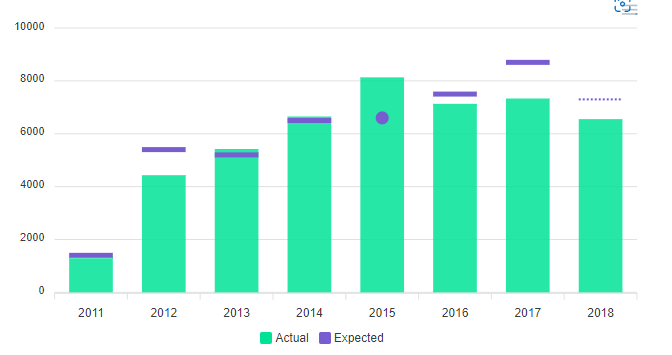
Add a new option for the bar series `barMarker`, which would have a data property with the ordered value of the markers. It could also just have a reference to a dataset with `datasetIndex`. Another option would be to have a list of objects with the dimension name and the value to assign (this way you would be able to omit columns).
It should have styling options similar to the ones offered by markPoint:
* Specify symbol (it could be a circle, line, dotted line, etc.)
* Label
* Color
* Etc.
This would allow us to create things like this (photo from apexcharts):

Another way of doing this would be with the `markPointer` like the workaround but allow to set a custom string for the size (something like `['barWidth', 3]`)
--
This is an automated message from the Apache Git Service.
To respond to the message, please log on to GitHub and use the
URL above to go to the specific comment.
To unsubscribe, e-mail: commits-unsubscribe@echarts.apache.org.apache.org
For queries about this service, please contact Infrastructure at:
users@infra.apache.org
---------------------------------------------------------------------
To unsubscribe, e-mail: commits-unsubscribe@echarts.apache.org
For additional commands, e-mail: commits-help@echarts.apache.org
[GitHub] [echarts] DavidMarquezF commented on issue #17210: [Feature] Bar marker line
Posted by GitBox <gi...@apache.org>.
DavidMarquezF commented on issue #17210:
URL: https://github.com/apache/echarts/issues/17210#issuecomment-1156631773

   I found a workaround but it is a **VERY DIRTY WORKAROUND**. It is prone to break in the future and it just hurts my eyes to look at it in my code, but it works 😁

   I found it looking at the source code:
   https://github.com/apache/echarts/blob/1047e897b90fe250f89a369e3646a7fbbfdc2b35/src/chart/bar/BarView.ts#L1119-L1123

   So basically I do the same they do to calculate the barWidth. Maybe there is better way of getting the bar width, but for now I just found this.

   After calling `setOption` or `resize`:

   ```js
   const barSize = this.echart["_chartsViews"][0]["_model"].getData().getLayout("size");

       const sizeOption: ECOption = {
         series: [
           {
             id: this.MAIN_SERIES_ID,
             markPoint: {
               symbolSize: [barSize, 3]
             }
           }
         ]
       };
   this.echart.setOption(sizeOption);
   ```

   I'm accessing at the chartsView index 0 because I know I have my BarChartView, but you should put the index of your bar dataset I guess.

   Again, this is just dirty and not a good fix, but I guess it will just work until echarts provides a proper solution


--
This is an automated message from the Apache Git Service.
To respond to the message, please log on to GitHub and use the
URL above to go to the specific comment.

To unsubscribe, e-mail: commits-unsubscribe@echarts.apache.org

For queries about this service, please contact Infrastructure at:
users@infra.apache.org


---------------------------------------------------------------------
To unsubscribe, e-mail: commits-unsubscribe@echarts.apache.org
For additional commands, e-mail: commits-help@echarts.apache.org