You are viewing a plain text version of this content. The canonical link for it is here.
Posted to commits@echarts.apache.org by GitBox <gi...@apache.org> on 2022/06/16 03:35:39 UTC
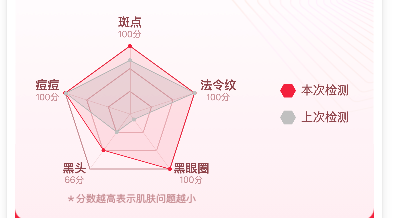
[GitHub] [echarts] Chang-Chen opened a new issue, #17224: 雷达图radar内series有多组数据时,设置series的z值,z值大构建的区域不会覆盖到z值小的区域。
Chang-Chen opened a new issue, #17224:
URL: https://github.com/apache/echarts/issues/17224
### Version
5.2.0
### Link to Minimal Reproduction
_No response_
### Steps to Reproduce
ec: {
onInit: function (canvas, width, height, dpr) {
chart = echarts.init(canvas, null, {
width: width,
height: height,
devicePixelRatio: dpr // new
});
canvas.setChart(chart);
let option = {
// color: ["rgba(242, 48, 64, 0.15)", "rgba(0, 0, 0, 0.1)"],
xAxis: {
show: false
},
yAxis: {
show: false
},
legend: {
show: true,
right: 20,
itemGap: 12,
top: 'middle',
orient: "vertical",
// selectedMode: "single",
selectedMode: false,
itemWidth: 16,
itemHeight: 16,
icon: "path://M0,0L0,0L0,0L0,0L0,0Z M12,1.0717967748641968L16,8L12,14.928203582763672L4,14.928203582763672L0,8L4,1.0717967748641968Z",
textStyle: {
color: 'rgba(153, 80, 85, 1)',
}
}
};
chart.setOption(option);
return chart;
}
},
chart.setOption({
radar: {
radius: 68,
nameGap: 6,
splitNumber: 3,
center: ['32%', '56%'],
axisName: {
show: true,
color: "#995055",
fontWeight: 500,
formatter: (a, b) => {
i++;
console.log(data['currentValue'], i);
return [
`{a|${a}}`,
`{b|${data['currentValue'][i]}分}`
].join('\n');
},
rich: {
a: {
color: "#995055",
fontWeight: 500,
fontSize: 12,
align: 'center'
},
b: {
color: "#CC999D",
fontWeight: 400,
fontSize: 9,
align: 'center',
lineHeight: 12
},
}
},
indicator: data['indicator'] || [],
axisLine: {
show: true,
lineStyle: {
color: '#F2DADC',
width: 0.5
}
},
splitLine: {
show: true,
lineStyle: {
color: ["rgba(204, 153, 157, 1)", "rgba(230, 195, 198, 1)", "rgba(230, 195, 198, 1)"],
type: "solid",
fontWeight: 500
}
},
splitArea: {
show: false
},
radarIndex: 5,
},
series: [{
name: '',
type: 'radar',
symbolSize: 4,
data: [ {
name: '本次检测',
z: 10,
colorBy: 'series',
value: data['currentValue'] || [],
areaStyle: {
color: "rgba(242, 48, 64, 0.15)",
},
itemStyle: {
color: "rgba(242, 48, 64, 1)"
},
lineStyle: {
width: 0.8,
color: "rgba(242, 48, 64, 1)"
}
},{
name: '上次检测',
z: 1,
colorBy: 'series',
value: data['lastValue'] || [],
areaStyle: {
color: "rgba(0, 0, 0, 0.1)",
},
itemStyle: {
color: "rgba(199, 199, 199, 1)",
},
lineStyle: {
width: 0.8,
color: "rgba(199, 199, 199, 1)"
}
}]
}]
});
### Current Behavior
series区域的代码示例:
series: [{
name: '',
type: 'radar',
symbolSize: 4,
data: [ {
name: '本次检测',
z: 10,
colorBy: 'series',
value: data['currentValue'] || [],
areaStyle: {
color: "rgba(242, 48, 64, 0.15)",
},
itemStyle: {
color: "rgba(242, 48, 64, 1)"
},
lineStyle: {
width: 0.8,
color: "rgba(242, 48, 64, 1)"
}
},{
name: '上次检测',
z: 1,
colorBy: 'series',
value: data['lastValue'] || [],
areaStyle: {
color: "rgba(0, 0, 0, 0.1)",
},
itemStyle: {
color: "rgba(199, 199, 199, 1)",
},
lineStyle: {
width: 0.8,
color: "rgba(199, 199, 199, 1)"
}
}]
}]
### Expected Behavior
目前看到的层级是根据series内数据先后顺序决定了构建区域的优先级。
希望z为10构建的图形盖在z为1构建的图形上面。
### Environment
```markdown
- OS:
- Browser:
- Framework:
```
### Any additional comments?
无
--
This is an automated message from the Apache Git Service.
To respond to the message, please log on to GitHub and use the
URL above to go to the specific comment.
To unsubscribe, e-mail: commits-unsubscribe@echarts.apache.org.apache.org
For queries about this service, please contact Infrastructure at:
users@infra.apache.org
---------------------------------------------------------------------
To unsubscribe, e-mail: commits-unsubscribe@echarts.apache.org
For additional commands, e-mail: commits-help@echarts.apache.org
[GitHub] [echarts] Chang-Chen closed issue #17224: 雷达图radar内series有多组数据时,设置series的z值,z值大构建的区域不会覆盖到z值小的区域。
Posted by GitBox <gi...@apache.org>.
Chang-Chen closed issue #17224: 雷达图radar内series有多组数据时,设置series的z值,z值大构建的区域不会覆盖到z值小的区域。
URL: https://github.com/apache/echarts/issues/17224


--
This is an automated message from the Apache Git Service.
To respond to the message, please log on to GitHub and use the
URL above to go to the specific comment.

To unsubscribe, e-mail: commits-unsubscribe@echarts.apache.org

For queries about this service, please contact Infrastructure at:
users@infra.apache.org


---------------------------------------------------------------------
To unsubscribe, e-mail: commits-unsubscribe@echarts.apache.org
For additional commands, e-mail: commits-help@echarts.apache.org
[GitHub] [echarts] echarts-bot[bot] commented on issue #17224: 雷达图radar内series有多组数据时,设置series的z值,z值大构建的区域不会覆盖到z值小的区域。
Posted by GitBox <gi...@apache.org>.
echarts-bot[bot] commented on issue #17224:
URL: https://github.com/apache/echarts/issues/17224#issuecomment-1157195499

   @Chang-Chen It seems you are not using English, I've helped translate the content automatically. To make your issue understood by more people and get helped, we'd like to suggest using English next time. 🤗
   <details><summary><b>TRANSLATED</b></summary><br>

   **TITLE**

   When the series in the radar chart has multiple sets of data, set the z value of the series, and the area constructed with a large z value will not cover the area with a small z value.
   </details>


--
This is an automated message from the Apache Git Service.
To respond to the message, please log on to GitHub and use the
URL above to go to the specific comment.

To unsubscribe, e-mail: commits-unsubscribe@echarts.apache.org

For queries about this service, please contact Infrastructure at:
users@infra.apache.org


---------------------------------------------------------------------
To unsubscribe, e-mail: commits-unsubscribe@echarts.apache.org
For additional commands, e-mail: commits-help@echarts.apache.org
[GitHub] [echarts] Ovilia commented on issue #17224: 雷达图radar内series有多组数据时,设置series的z值,z值大构建的区域不会覆盖到z值小的区域。
Posted by GitBox <gi...@apache.org>.
Ovilia commented on issue #17224:
URL: https://github.com/apache/echarts/issues/17224#issuecomment-1158444900

   Please read the doc carefully. There is no `z` under `data` but only under `series`.


--
This is an automated message from the Apache Git Service.
To respond to the message, please log on to GitHub and use the
URL above to go to the specific comment.

To unsubscribe, e-mail: commits-unsubscribe@echarts.apache.org

For queries about this service, please contact Infrastructure at:
users@infra.apache.org


---------------------------------------------------------------------
To unsubscribe, e-mail: commits-unsubscribe@echarts.apache.org
For additional commands, e-mail: commits-help@echarts.apache.org