You are viewing a plain text version of this content. The canonical link for it is here.
Posted to dev@echarts.apache.org by GitBox <gi...@apache.org> on 2018/10/15 03:04:06 UTC
[GitHub] cn-xufei opened a new issue #9227: 柱状图设置背景
cn-xufei opened a new issue #9227: 柱状图设置背景
URL: https://github.com/apache/incubator-echarts/issues/9227
<!--
为了方便我们能够复现和修复 bug,请遵从下面的规范描述您的问题。
-->
### One-line summary [问题简述]
很多业务场景需要给柱状图设置个背景,比如👇
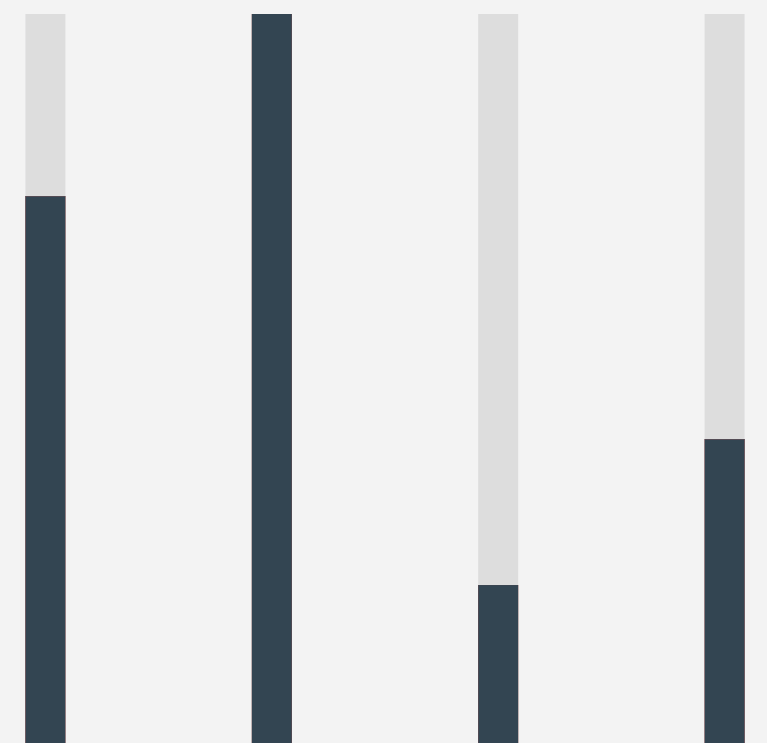
当然echars目前可以通过barGap=‘-100%'来将一组bar的serie重叠,并且还得用一组最大值数据填充data,然后才看起来是个背景
但是当柱状图是多个系列的,比如👇
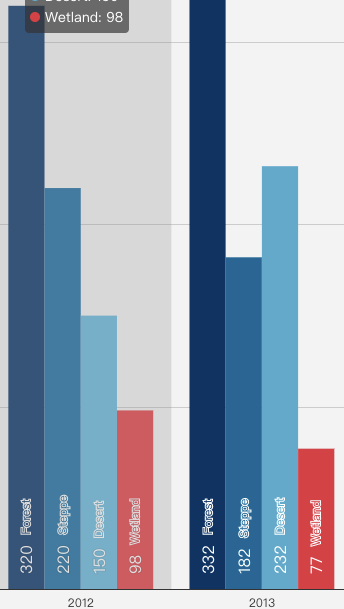
就不能barGap=‘-100%'这么玩了,但也可以曲线救国,比如可以设置双xAxis,原数据在第一个x轴展示,将原数据拷贝一份在第二个x轴展示,取最大值数据作为data,并设置第二个x轴不可见,两个x轴的刻度数据保持一致,最终效果👇
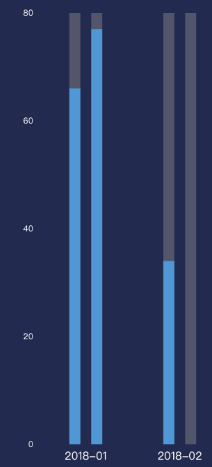
给柱状图设置背景,这是一个痛点,相信很多人也有类似的需求,希望官方可以扩展下配置支持这种模式
### Version & Environment [版本及环境]
+ ECharts version [ECharts 版本]:4.x
### Expected behaviour [期望结果]
希望柱状图开放一个柱子背景的配置项
### ECharts option [ECharts配置项]
<!-- Copy and paste your 'echarts option' here. -->
<!-- [下方贴你的option,注意不要删掉下方 ```javascript 和 尾部的 ``` 字样。最好是我们能够直接运行的 option。如何得到能运行的 option 参见上方的 guidelines for contributing] -->
```javascript
option = {
xAxis: {
data: ['a', 'b', 'c', 'd'],
axisTick: {show: false},
axisLabel: {
formatter: 'barGap: \'-100%\''
}
},
yAxis: {
splitLine: {show: false}
},
animationDurationUpdate: 1200,
series: [{
type: 'bar',
itemStyle: {
normal: {
color: '#ddd'
}
},
silent: true,
barWidth: 40,
barGap: '-100%', // Make series be overlap
data: [60, 60, 60, 60]
}, {
type: 'bar',
barWidth: 40,
z: 10,
data: [45, 60, 13, 25]
}, {
name: 'hehe',
type: 'bar',
barWidth: 40,
z: 10,
data: [45, 60, 13, 25]
}]
};
```
### Other comments [其他信息]
<!-- For example: Screenshot or Online demo -->
<!-- [例如,截图或线上实例 (JSFiddle/JSBin/Codepen)] -->
----------------------------------------------------------------
This is an automated message from the Apache Git Service.
To respond to the message, please log on GitHub and use the
URL above to go to the specific comment.
For queries about this service, please contact Infrastructure at:
users@infra.apache.org
With regards,
Apache Git Services
---------------------------------------------------------------------
To unsubscribe, e-mail: dev-unsubscribe@echarts.apache.org
For additional commands, e-mail: dev-help@echarts.apache.org