You are viewing a plain text version of this content. The canonical link for it is here.
Posted to notifications@superset.apache.org by GitBox <gi...@apache.org> on 2021/09/10 01:04:28 UTC
[GitHub] [superset] rwspielman edited a comment on issue #15877: [mixed time-series]can not add chart to the dashboard
rwspielman edited a comment on issue #15877:
URL: https://github.com/apache/superset/issues/15877#issuecomment-916547582
I'm getting this error in 1.3.0 with async and cache on. I didn't seeing anything in `CHANGELOG.md` about a fix pertaining to this, but have **not** tested on master yet.
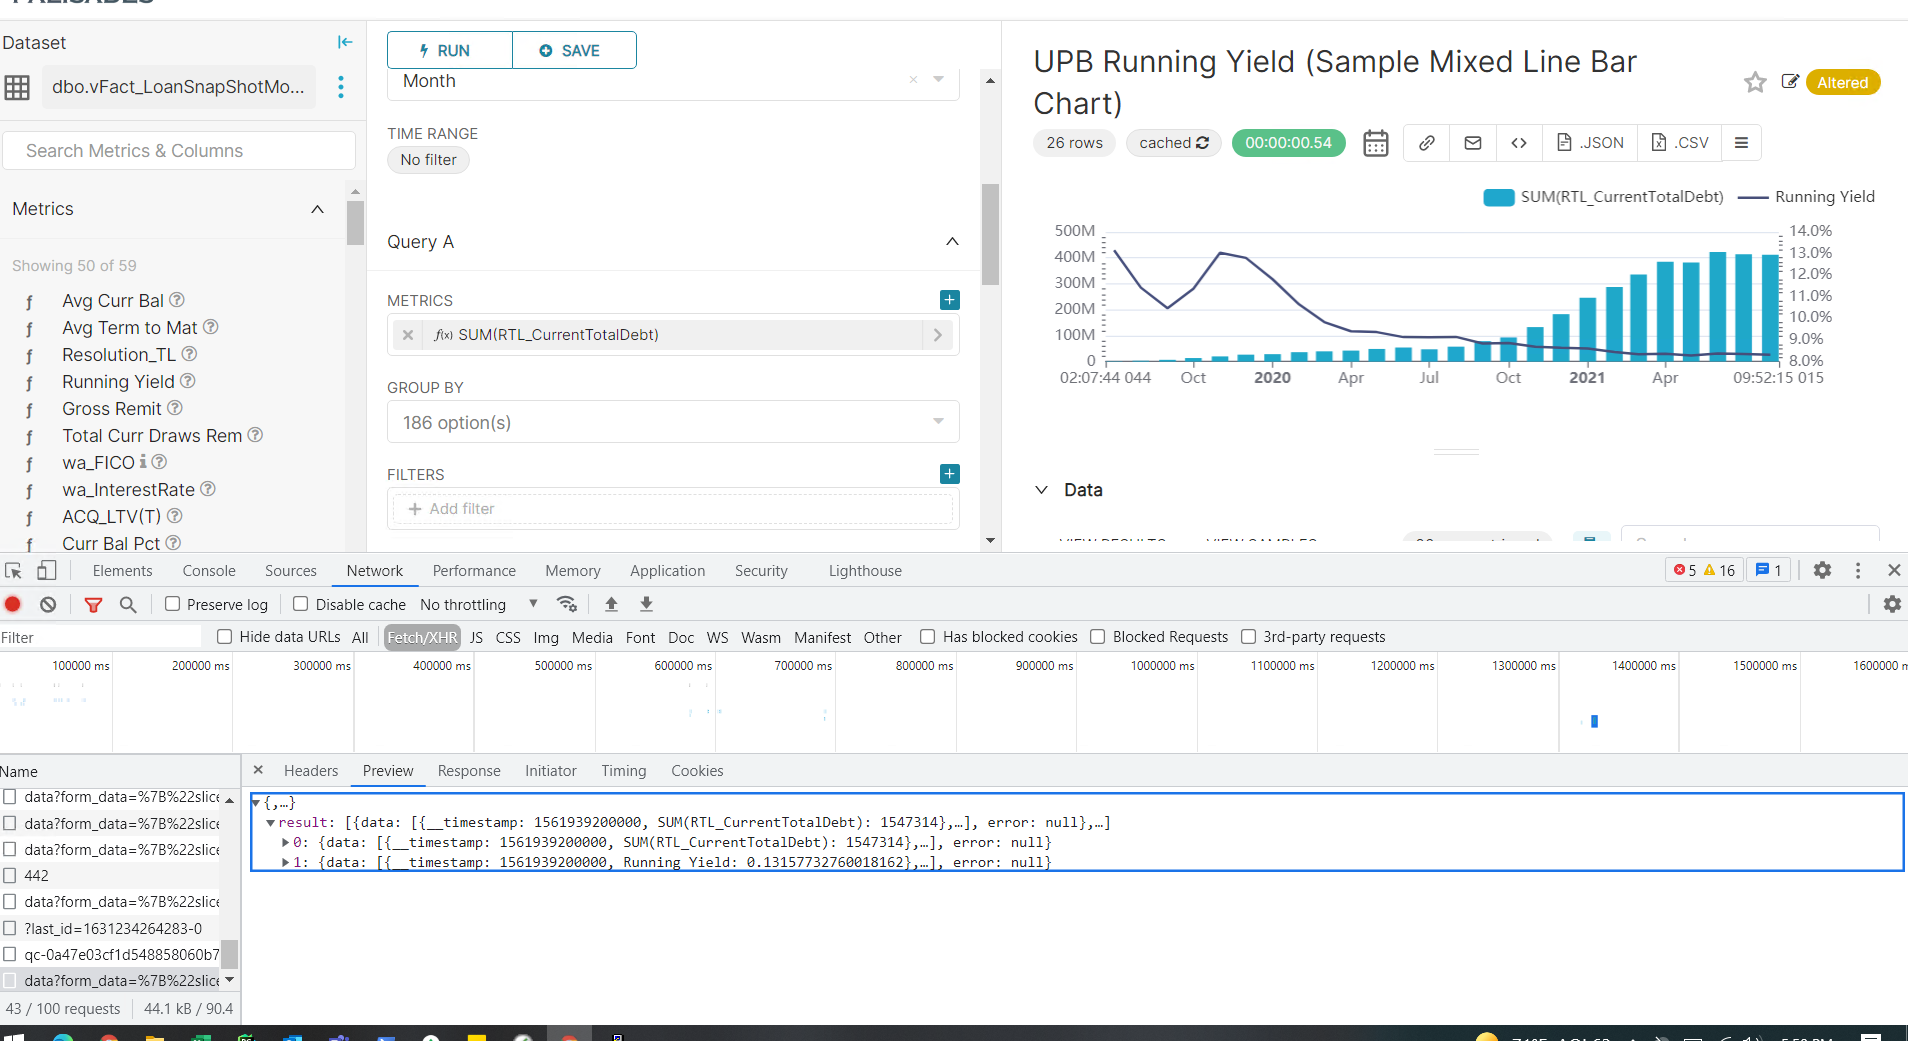
I'm noticing flip-flopping API calls to 2 different endpoints to get the chart data. It seems to only be affecting this mixed time-series chart from what I've tested so far.
It will make a call using the `/api/v1/chart/data?form_data={{sliceID}}` endpoint
This succeeds. It returns an object with `result` property and then the data for the chart
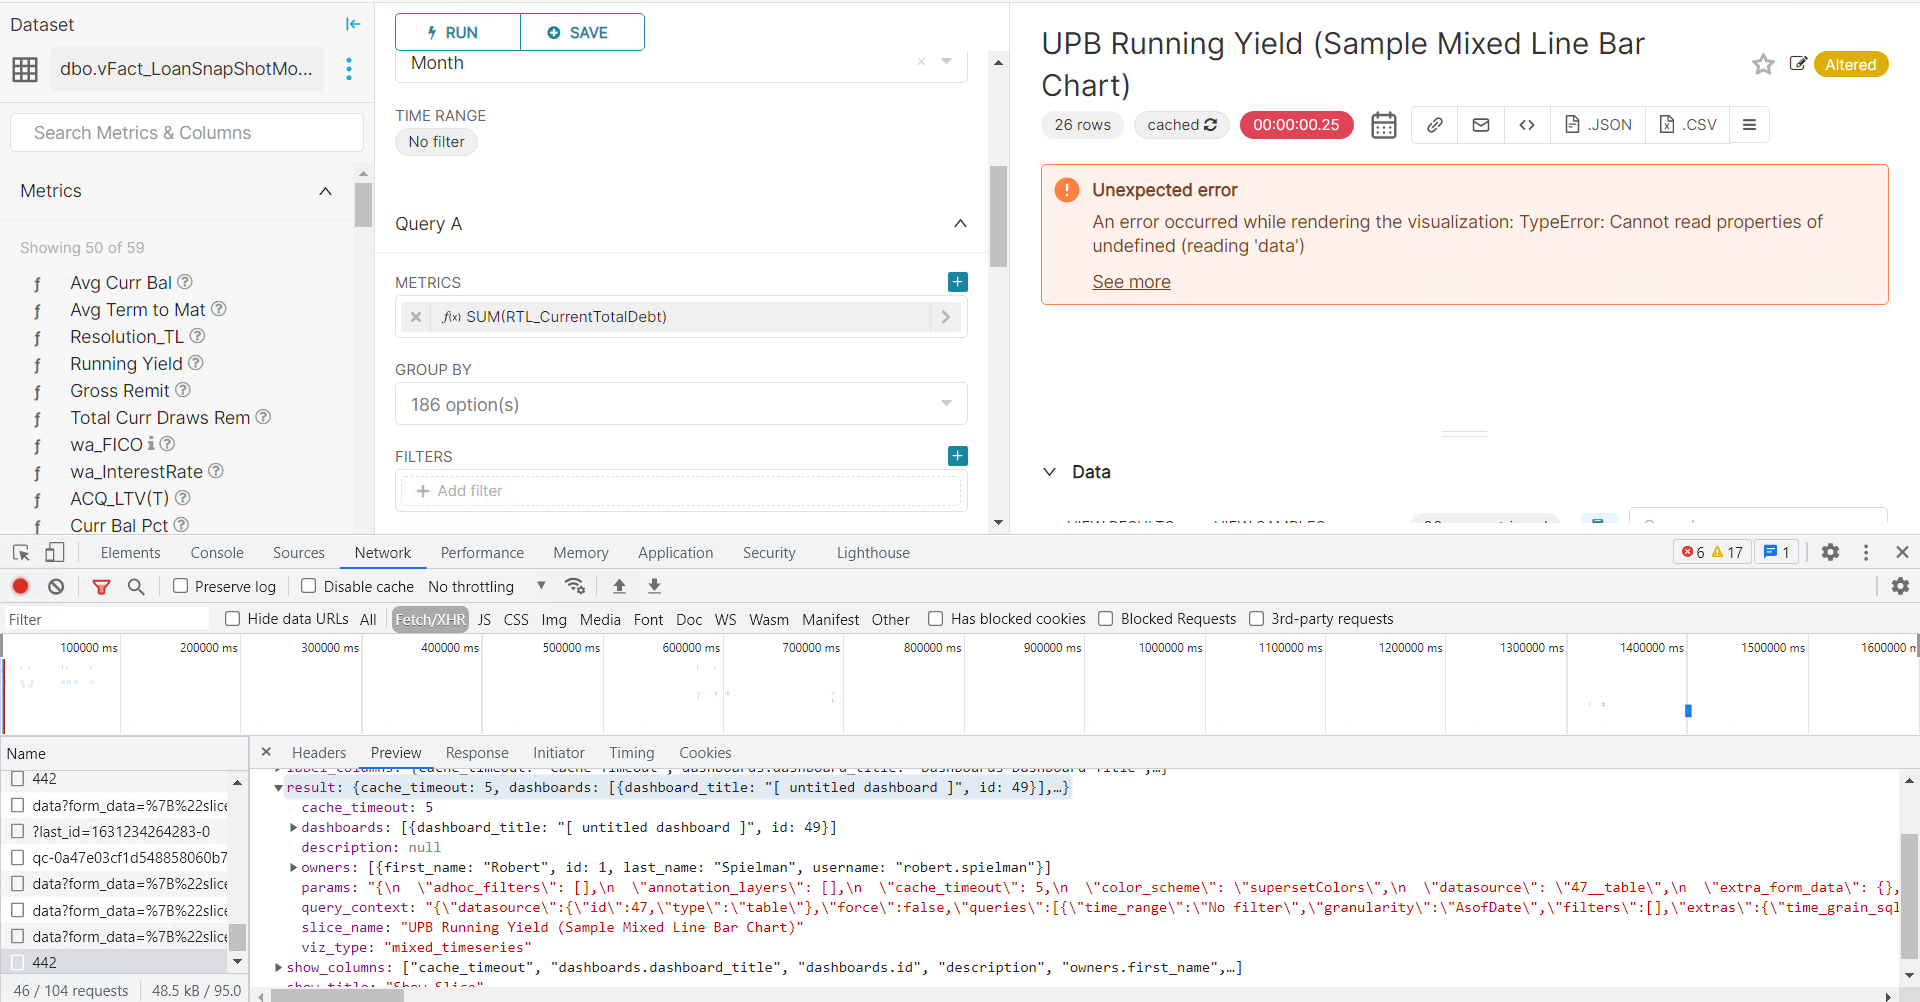
It also makes a call using the `/api/v1/chart/{{sliceID}}` endpoint
This one fails. It returns an object that has a `result` property, but doesn't contain the data needed.
Admittedly, it's been a while since I have looked in the codebase so I forget where to check
--
This is an automated message from the Apache Git Service.
To respond to the message, please log on to GitHub and use the
URL above to go to the specific comment.
To unsubscribe, e-mail: notifications-unsubscribe@superset.apache.org
For queries about this service, please contact Infrastructure at:
users@infra.apache.org
---------------------------------------------------------------------
To unsubscribe, e-mail: notifications-unsubscribe@superset.apache.org
For additional commands, e-mail: notifications-help@superset.apache.org