You are viewing a plain text version of this content. The canonical link for it is here.
Posted to notifications@apisix.apache.org by GitBox <gi...@apache.org> on 2021/04/27 01:10:20 UTC
[GitHub] [apisix] to2false opened a new issue #4137: bug: apisix metrics sometimes slow requests get encountered
to2false opened a new issue #4137:
URL: https://github.com/apache/apisix/issues/4137
### Issue description
### Environment
* apisix version (cmd: `apisix version`): 2.4
* OS (cmd: `uname -a`): Linux gateway 3.10.0-1127.19.1.el7.x86_64 #1 SMP Tue Aug 25 17:23:54 UTC 2020 x86_64 x86_64 x86_64 GNU/Linux
* OpenResty / Nginx version (cmd: `nginx -V` or `openresty -V`):
* etcd version, if have (cmd: run `curl http://127.0.0.1:9090/v1/server_info` to get the info from server-info API): v3.4.13
* apisix-dashboard version, if have: 2.5
* luarocks version, if the issue is about installation (cmd: `luarocks --version`):
### Minimal test code / Steps to reproduce the issue
 I can't reproduce it, it only happens occasionally now
additional, the server load is not high.
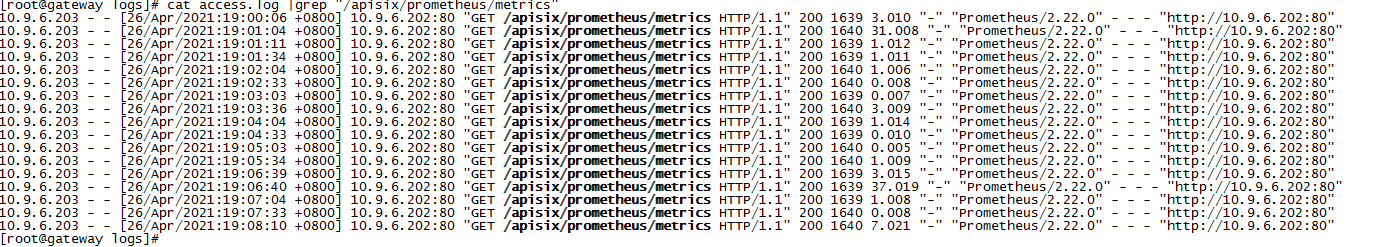
### What's the actual result? (including assertion message & call stack if applicable)
- metrics requested over 30s
### What's the expected result?
- metrics requested should be quick
--
This is an automated message from the Apache Git Service.
To respond to the message, please log on to GitHub and use the
URL above to go to the specific comment.
For queries about this service, please contact Infrastructure at:
users@infra.apache.org
[GitHub] [apisix] to2false closed issue #4137: bug: apisix metrics sometimes slow requests get encountered
Posted by GitBox <gi...@apache.org>.
to2false closed issue #4137:
URL: https://github.com/apache/apisix/issues/4137


--
This is an automated message from the Apache Git Service.
To respond to the message, please log on to GitHub and use the
URL above to go to the specific comment.

For queries about this service, please contact Infrastructure at:
users@infra.apache.org
[GitHub] [apisix] to2false commented on issue #4137: bug: apisix metrics sometimes slow requests get encountered
Posted by GitBox <gi...@apache.org>.
to2false commented on issue #4137:
URL: https://github.com/apache/apisix/issues/4137#issuecomment-827439026


   I found the problem caused by sysctl net. nf_conntrack_max is too small, I increase the value of it, seems work well now.


--
This is an automated message from the Apache Git Service.
To respond to the message, please log on to GitHub and use the
URL above to go to the specific comment.

For queries about this service, please contact Infrastructure at:
users@infra.apache.org
[GitHub] [apisix] Firstsawyou commented on issue #4137: bug: apisix metrics sometimes slow requests get encountered
Posted by GitBox <gi...@apache.org>.
Firstsawyou commented on issue #4137:
URL: https://github.com/apache/apisix/issues/4137#issuecomment-827334456


   > I can't reproduce it, it only happens occasionally now
   >
   > additional, the server load is not high.

   The metrics data is real-time, which may be related to the time interval when you call the `/apisix/prometheus/metrics` interface.

   This is the log of my test calling the `/apisix/prometheus/metrics` interface:

   ```shell
   127.0.0.1 - - [27/Apr/2021:13:52:45 +0800] 127.0.0.1:9080 "GET /apisix/prometheus/metrics HTTP/1.1" 200 8062 0.001 "-" "curl/7.29.0" - - - "http://127.0.0.1:9080"
   127.0.0.1 - - [27/Apr/2021:13:52:46 +0800] 127.0.0.1:9080 "GET /apisix/prometheus/metrics HTTP/1.1" 200 8062 0.002 "-" "curl/7.29.0" - - - "http://127.0.0.1:9080"
   127.0.0.1 - - [27/Apr/2021:13:52:47 +0800] 127.0.0.1:9080 "GET /apisix/prometheus/metrics HTTP/1.1" 200 8062 0.003 "-" "curl/7.29.0" - - - "http://127.0.0.1:9080"
   127.0.0.1 - - [27/Apr/2021:13:52:47 +0800] 127.0.0.1:9080 "GET /apisix/prometheus/metrics HTTP/1.1" 200 8062 0.002 "-" "curl/7.29.0" - - - "http://127.0.0.1:9080"
   127.0.0.1 - - [27/Apr/2021:13:52:46 +0800] 127.0.0.1:9080 "GET /apisix/prometheus/metrics HTTP/1.1" 200 8062 0.003 "-" "curl/7.29.0" - - - "http://127.0.0.1:9080"
   127.0.0.1 - - [27/Apr/2021:13:52:48 +0800] 127.0.0.1:9080 "GET /apisix/prometheus/metrics HTTP/1.1" 200 8062 0.002 "-" "curl/7.29.0" - - - "http://127.0.0.1:9080"
   127.0.0.1 - - [27/Apr/2021:13:52:48 +0800] 127.0.0.1:9080 "GET /apisix/prometheus/metrics HTTP/1.1" 200 8062 0.002 "-" "curl/7.29.0" - - - "http://127.0.0.1:9080"
   127.0.0.1 - - [27/Apr/2021:13:52:49 +0800] 127.0.0.1:9080 "GET /apisix/prometheus/metrics HTTP/1.1" 200 8062 0.002 "-" "curl/7.29.0" - - - "http://127.0.0.1:9080"
   ```


--
This is an automated message from the Apache Git Service.
To respond to the message, please log on to GitHub and use the
URL above to go to the specific comment.

For queries about this service, please contact Infrastructure at:
users@infra.apache.org
[GitHub] [apisix] to2false commented on issue #4137: bug: apisix metrics sometimes slow requests get encountered
Posted by GitBox <gi...@apache.org>.
to2false commented on issue #4137:
URL: https://github.com/apache/apisix/issues/4137#issuecomment-827341907


   The above metrics requests come from prometheus, the interval is 30s.
   Not sure if it caused by machine resources.

   An additional question, are the sources of the metrics all in memory? Or come from other places? Which places should I check?


--
This is an automated message from the Apache Git Service.
To respond to the message, please log on to GitHub and use the
URL above to go to the specific comment.

For queries about this service, please contact Infrastructure at:
users@infra.apache.org