You are viewing a plain text version of this content. The canonical link for it is here.
Posted to commits@mxnet.apache.org by GitBox <gi...@apache.org> on 2019/03/22 03:50:08 UTC
[GitHub] [incubator-mxnet] dwSun opened a new issue #14500: Default
parameters of gluon.data.vision.transforms.RandomColorJitter should be set
to 0.5
dwSun opened a new issue #14500: Default parameters of gluon.data.vision.transforms.RandomColorJitter should be set to 0.5
URL: https://github.com/apache/incubator-mxnet/issues/14500
## Description
The default parameters of gluon.data.vision.transforms.RandomColorJitter are (brightness=0, contrast=0, saturation=0, hue=0).
According to mxnet api docs,
```
Parameters:
- brightness (float) – How much to jitter brightness. brightness factor is randomly chosen from [max(0, 1 - brightness), 1 + brightness].
- contrast (float) – How much to jitter contrast. contrast factor is randomly chosen from [max(0, 1 - contrast), 1 + contrast].
- saturation (float) – How much to jitter saturation. saturation factor is randomly chosen from [max(0, 1 - saturation), 1 + saturation].
-hue (float) – How much to jitter hue. hue factor is randomly chosen from [max(0, 1 - hue), 1 + hue].
```
Those parametes will be choosen from [max(0, 1 - 0), 1 + 0], that is [1, 1].
This will cause problmes.
Try this script:
```py
#!/usr/bin/env python3
"""Doc."""
import mxnet as mx
from matplotlib import pyplot as plt
from mxnet.gluon.data.vision.transforms import Compose
# %% main
img = mx.image.imread('1.png')
aug1 = mx.gluon.data.vision.transforms.RandomFlipLeftRight()
aug2 = mx.gluon.data.vision.transforms.RandomResizedCrop(
(200, 200), scale=(0.5, 1.0))
aug3 = mx.gluon.data.vision.transforms.RandomColorJitter()
aug4 = mx.gluon.data.vision.transforms.RandomColorJitter(
brightness=0.5, contrast=0.5, saturation=0.5, hue=0.5)
def show_images(imgs, num_rows, num_cols, scale=2):
figsize = (num_cols * scale, num_rows * scale)
_, axes = plt.subplots(num_rows, num_cols, figsize=figsize)
for i in range(num_rows):
for j in range(num_cols):
axes[i][j].imshow(imgs[i * num_cols + j].asnumpy())
axes[i][j].axes.get_xaxis().set_visible(False)
axes[i][j].axes.get_yaxis().set_visible(False)
return axes
def apply(img, aug, num_rows=2, num_cols=2, scale=1.5, filename='test.png'):
Y = [aug(img) for _ in range(num_rows * num_cols)]
show_images(Y, num_rows, num_cols, scale)
plt.savefig(filename)
apply(img, Compose([aug1, aug2, aug3]), scale=8,
filename='test-{}.png'.format('1-2-3'))
apply(img, Compose([aug1, aug2, aug4]), scale=8,
filename='test-{}.png'.format('1-2-4'))
```
## test-1-2-3.png, weird ouput.
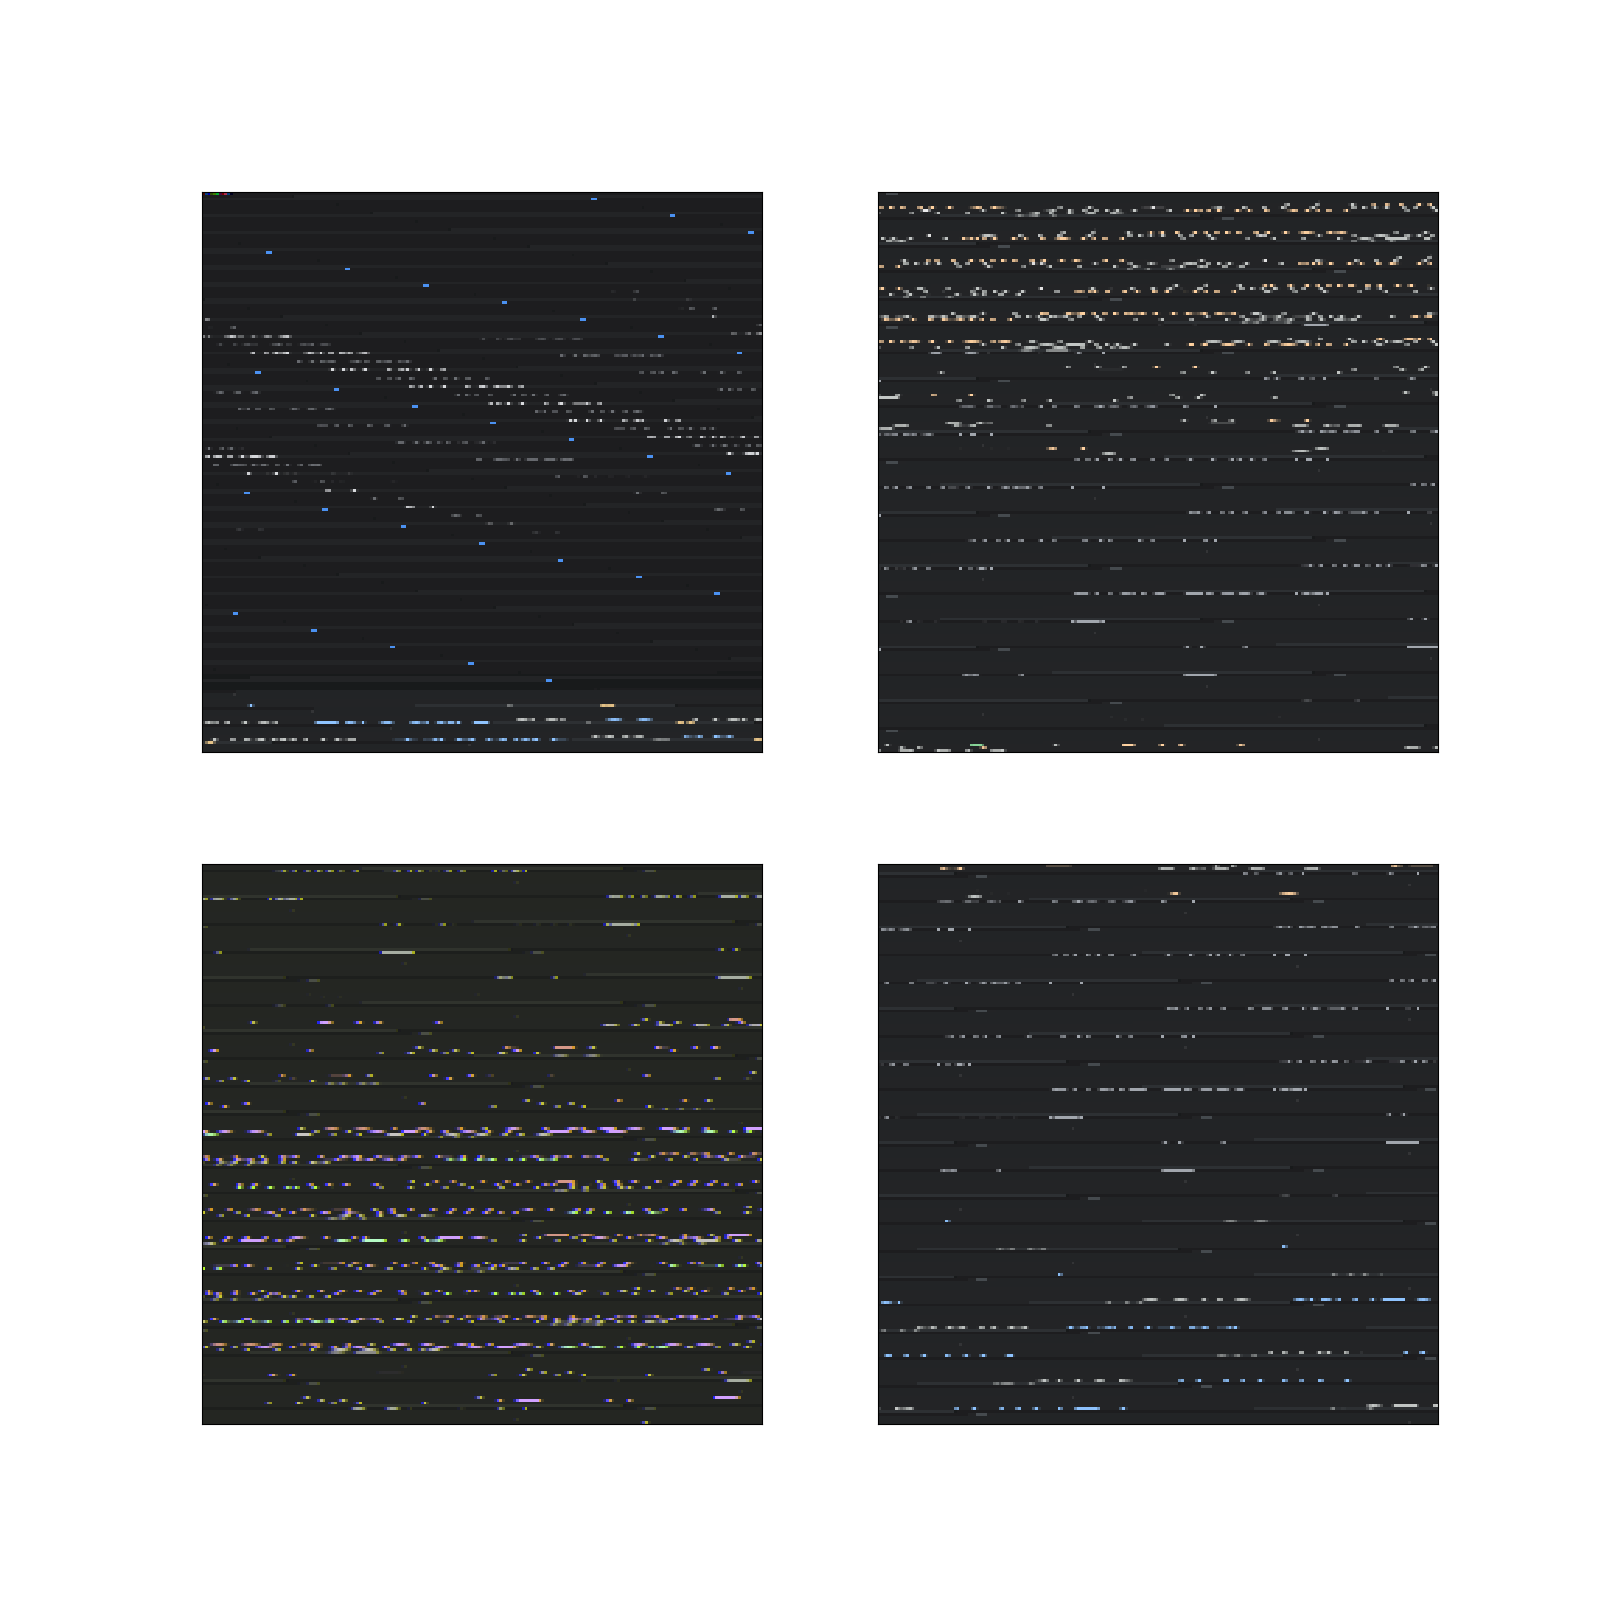
## test-1-2-4.png, this is OK
----------------------------------------------------------------
This is an automated message from the Apache Git Service.
To respond to the message, please log on to GitHub and use the
URL above to go to the specific comment.
For queries about this service, please contact Infrastructure at:
users@infra.apache.org
With regards,
Apache Git Services