You are viewing a plain text version of this content. The canonical link for it is here.
Posted to commits@echarts.apache.org by GitBox <gi...@apache.org> on 2022/08/02 13:10:15 UTC
[GitHub] [echarts] pe-3 opened a new pull request, #17461: feat(funnel): set prop to flatten the funnel exit #14863
pe-3 opened a new pull request, #17461:
URL: https://github.com/apache/echarts/pull/17461
<!-- Please fill in the following information to help us review your PR more efficiently. -->
## Brief Information
This pull request is in the type of:
- [ ] bug fixing
- [x] new feature
- [ ] others
### What does this PR do?
<!-- USE ONE SENTENCE TO DESCRIBE WHAT THIS PR DOES. -->
Add a property to flatten the funnel exit based on the existing funnel style.
### Fixed issues
<!--
- #xxxx: ...
-->
#14863
## Details
### Before: What was the problem?
<!-- DESCRIBE THE BUG OR REQUIREMENT HERE. -->
#### We need to maintain the pyramid shape of the funnel and add a way to flatten funnel exit to make it closer to the funnel
<!-- ADD SCREENSHOT HERE IF APPLICABLE. -->

### After: How does it behave after the fixing?
#### Add a new property to set is as rect then the funnel exit is flattened.
<!-- THE RESULT AFTER FIXING AND A SIMPLE EXPLANATION ABOUT HOW IT IS FIXED. -->
`series:[{ ..., exitShape: 'rect' }]`
<!-- ADD SCREENSHOT HERE IF APPLICABLE. -->


## Document Info
One of the following should be checked.
- [ ] This PR doesn't relate to document changes
- [x] The document should be updated later
- [ ] The document changes have been made in apache/echarts-doc#xxx
## Misc
### ZRender Changes
- [ ] This PR depends on ZRender changes (ecomfe/zrender#xxx).
### Related test cases or examples to use the new APIs
Please refer to test/funnel.html
N.A.
## Others
### Merging options
- [ ] Please squash the commits into a single one when merging.
### Other information
--
This is an automated message from the Apache Git Service.
To respond to the message, please log on to GitHub and use the
URL above to go to the specific comment.
To unsubscribe, e-mail: commits-unsubscribe@echarts.apache.org
For queries about this service, please contact Infrastructure at:
users@infra.apache.org
---------------------------------------------------------------------
To unsubscribe, e-mail: commits-unsubscribe@echarts.apache.org
For additional commands, e-mail: commits-help@echarts.apache.org
[GitHub] [echarts] pissang commented on a diff in pull request #17461: feat(funnel): add funnel new styles #14863
Posted by GitBox <gi...@apache.org>.
pissang commented on code in PR #17461:
URL: https://github.com/apache/echarts/pull/17461#discussion_r950959256
##########
src/chart/funnel/funnelLayout.ts:
##########
@@ -28,9 +28,9 @@ import { isFunction } from 'zrender/src/core/util';
function getViewRect(seriesModel: FunnelSeriesModel, api: ExtensionAPI) {
return layout.getLayoutRect(
seriesModel.getBoxLayoutParams(), {
- width: api.getWidth(),
- height: api.getHeight()
- }
+ width: api.getWidth(),
Review Comment:
wrong indentation here
##########
src/chart/funnel/FunnelSeries.ts:
##########
@@ -45,7 +45,7 @@ import SeriesData from '../../data/SeriesData';
type FunnelLabelOption = Omit<SeriesLabelOption, 'position'> & {
position?: LabelOption['position']
- | 'outer' | 'inner' | 'center' | 'rightTop' | 'rightBottom' | 'leftTop' | 'leftBottom'
+ | 'outer' | 'inner' | 'center' | 'rightTop' | 'rightBottom' | 'leftTop' | 'leftBottom'
Review Comment:
Please avoid this kind of code style change
##########
src/chart/funnel/funnelLayout.ts:
##########
@@ -337,55 +427,156 @@ export default function funnelLayout(ecModel: GlobalModel, api: ExtensionAPI) {
indices = indices.reverse();
}
- for (let i = 0; i < indices.length; i++) {
- const idx = indices[i];
- const nextIdx = indices[i + 1];
- const itemModel = data.getItemModel<FunnelDataItemOption>(idx);
+ const valueSum = valueArr.reduce((pre, cur) => pre + cur);
- if (orient === 'horizontal') {
- let width = itemModel.get(['itemStyle', 'width']);
- if (width == null) {
- width = itemSize;
+ const getSideLen = function (sideLen: number | string, idx?: number): number {
+ if (dynamicHeight) {
+ // in dy height, user can't set itemHeight or itemWidth
+ const val = data.get(valueDim, idx) as number || 0;
+ sideLen = linearMap(val, [0, valueSum], sizeExtent, true);
+ sideLen = sort === 'ascending' ? -sideLen : sideLen;
+ return sideLen;
+ }
+
+ if (sideLen == null) {
+ sideLen = itemSize;
+ }
+ else {
+ if (orient === 'horizontal') {
+ sideLen = parsePercent(sideLen, viewWidth);
}
else {
- width = parsePercent(width, viewWidth);
- if (sort === 'ascending') {
- width = -width;
- }
+ sideLen = parsePercent(sideLen, viewHeight);
}
- const start = getLinePoints(idx, x);
- const end = getLinePoints(nextIdx, x + width);
+ if (sort === 'ascending') {
+ sideLen = -sideLen;
+ }
+ }
+ return sideLen;
+ };
- x += width + gap;
+ const exitShape = seriesModel.get('exitShape');
+ let resSize = sizeExtent[1];
+ let maxSize = sizeExtent[1];
+ let exitWidth: string | number = seriesModel.get('exitWidth');
- data.setItemLayout(idx, {
- points: start.concat(end.slice().reverse())
- });
+ if (exitWidth) {
+ const percentReg = /^\w{1,2}\.{0,}\w{0,}%$/;
Review Comment:
`parsePercent` can be used here
##########
src/chart/funnel/funnelLayout.ts:
##########
@@ -324,6 +374,46 @@ export default function funnelLayout(ecModel: GlobalModel, api: ExtensionAPI) {
];
};
+ const getLinePointsBySize = function (offset: number, itemSize: number) {
+ if (orient === 'horizontal') {
Review Comment:
Similar to the comments above. the code can be more tight here.
##########
src/chart/funnel/funnelLayout.ts:
##########
@@ -277,9 +322,14 @@ export default function funnelLayout(ecModel: GlobalModel, api: ExtensionAPI) {
}
const funnelAlign = seriesModel.get('funnelAlign');
- let gap = seriesModel.get('gap');
- const viewSize = orient === 'horizontal' ? viewWidth : viewHeight;
- let itemSize = (viewSize - gap * (data.count() - 1)) / data.count();
+ let viewSize: number;
+ if (dynamicHeight) {
+ viewSize = orient === 'vertical' ? viewWidth : viewHeight;
Review Comment:
It's better to do the same check 'horizontal' so the behavior will be more consistent when the value is neither `vertical` nor `horizontal`
##########
test/funnel.html:
##########
@@ -19,141 +18,196 @@
-->
<html>
- <head>
- <meta charset="utf-8">
- <script src="lib/simpleRequire.js"></script>
- <script src="lib/config.js"></script>
- <script src="lib/dat.gui.min.js"></script>
- </head>
- <body>
- <style>
- html, body, #main {
- width: 100%;
- height: 100%;
- margin: 0;
- }
- </style>
- <div id="main"></div>
- <script>
- require([
- 'echarts'
- ], function (echarts) {
+<head>
+ <meta charset="utf-8">
Review Comment:
Please add create a new test case here. Changing the original test case will break the automatic test
##########
src/chart/funnel/funnelLayout.ts:
##########
@@ -337,55 +427,156 @@ export default function funnelLayout(ecModel: GlobalModel, api: ExtensionAPI) {
indices = indices.reverse();
}
- for (let i = 0; i < indices.length; i++) {
- const idx = indices[i];
- const nextIdx = indices[i + 1];
- const itemModel = data.getItemModel<FunnelDataItemOption>(idx);
+ const valueSum = valueArr.reduce((pre, cur) => pre + cur);
- if (orient === 'horizontal') {
- let width = itemModel.get(['itemStyle', 'width']);
- if (width == null) {
- width = itemSize;
+ const getSideLen = function (sideLen: number | string, idx?: number): number {
+ if (dynamicHeight) {
+ // in dy height, user can't set itemHeight or itemWidth
+ const val = data.get(valueDim, idx) as number || 0;
+ sideLen = linearMap(val, [0, valueSum], sizeExtent, true);
+ sideLen = sort === 'ascending' ? -sideLen : sideLen;
+ return sideLen;
+ }
+
+ if (sideLen == null) {
+ sideLen = itemSize;
+ }
+ else {
+ if (orient === 'horizontal') {
+ sideLen = parsePercent(sideLen, viewWidth);
}
else {
- width = parsePercent(width, viewWidth);
- if (sort === 'ascending') {
- width = -width;
- }
+ sideLen = parsePercent(sideLen, viewHeight);
}
- const start = getLinePoints(idx, x);
- const end = getLinePoints(nextIdx, x + width);
+ if (sort === 'ascending') {
+ sideLen = -sideLen;
+ }
+ }
+ return sideLen;
+ };
- x += width + gap;
+ const exitShape = seriesModel.get('exitShape');
+ let resSize = sizeExtent[1];
+ let maxSize = sizeExtent[1];
+ let exitWidth: string | number = seriesModel.get('exitWidth');
- data.setItemLayout(idx, {
- points: start.concat(end.slice().reverse())
- });
+ if (exitWidth) {
+ const percentReg = /^\w{1,2}\.{0,}\w{0,}%$/;
+ if (percentReg.test(exitWidth)) {
+ exitWidth = parseInt(exitWidth, 10);
+ resSize = maxSize = 100 * maxSize / (100 - exitWidth);
}
else {
- let height = itemModel.get(['itemStyle', 'height']);
- if (height == null) {
- height = itemSize;
- }
- else {
- height = parsePercent(height, viewHeight);
- if (sort === 'ascending') {
- height = -height;
+ throw new Error(`the exitWidth must be in percentage format and cannot be greater than 99%,
+ but you set it as '${exitWidth}'`);
+ }
+ }
+
+ const showRate = seriesModel.get('showRate');
+ let firstVal: number;
+ const setLayoutPoints =
+ // The subsequent funnel shape modification will be done in this func.
+ // We don’t need to concern direction when we use this function to set points.
+ function (
+ index: number,
+ idx: number,
+ nextIdx: number,
+ sideLen: number,
+ pos: number
+ ): void {
+ if (dynamicHeight) {
+ const start = getLinePointsBySize(pos, resSize / maxSize * viewSize);
+ let end;
+
+ if (index === indices.length - 1 && exitShape === 'rect') {
+ end = getLinePointsBySize(pos + sideLen, resSize / maxSize * viewSize);
+ }
+ else {
+ resSize += sort === 'ascending' ? sideLen : -sideLen;
+ end = getLinePointsBySize(pos + sideLen, resSize / maxSize * viewSize);
}
+
+ data.setItemLayout(idx, {
+ points: start.concat(end.slice().reverse())
+ });
+ return;
}
+ else if (showRate) {
+ const dataStart = getLinePoints(idx, pos);
+ let dataEnd;
+ if (exitWidth !== undefined && index === indices.length - 1) {
+ const val = data.get(valueDim, idx) as number || 0;
+ const itemSize = linearMap(val, [min, max], sizeExtent, true);
+ const exitSize = itemSize * (exitWidth as number) / 100;
+ dataEnd = getLinePointsBySize(pos + sideLen / 2, exitSize);
+ }
+ else {
+ dataEnd = getLinePoints(idx, pos + sideLen / 2);
+ }
+ const rateStart = getLinePoints(idx, pos + sideLen / 2);
+ const rateEnd = getLinePoints(nextIdx, pos + sideLen);
- const start = getLinePoints(idx, y);
- const end = getLinePoints(nextIdx, y + height);
+ const val = data.get(valueDim, idx) as number || 0;
+ const nextVal = data.get(valueDim, nextIdx) as number || 0;
+ let rate: number | string = nextVal / val;
+ rate = 'Rate ' + (rate * 100).toFixed(0) + '%';
+ if (index === 0) {
+ firstVal = val;
+ }
+ else if (index === indices.length - 1) {
+ const lastVal = val;
+ rate = lastVal / firstVal;
+ rate = 'Overall rate ' + (rate * 100).toFixed(0) + '%';
Review Comment:
rate string should not be fixed here. It needs to be configurable by the `formatter` option like the existing `label.formatter` option
##########
src/chart/funnel/funnelLayout.ts:
##########
@@ -246,26 +246,71 @@ function labelLayout(data: SeriesData) {
});
}
+function rateLabelLayout(data: SeriesData) {
+ data.each(function (idx) {
+ const layout = data.getItemLayout(idx);
+ const points = layout.ratePoints;
+
+ const isLabelInside = true;
+
+ const textX = (points[0][0] + points[1][0] + points[2][0] + points[3][0]) / 4;
+ const textY = (points[0][1] + points[1][1] + points[2][1] + points[3][1]) / 4;
+ const textAlign = 'center';
+
+ const linePoints = [
+ [textX, textY], [textX, textY]
+ ];
+
+ layout.rateLabel = {
+ linePoints: linePoints,
+ x: textX,
+ y: textY,
+ verticalAlign: 'middle',
+ textAlign: textAlign,
+ inside: isLabelInside
+ };
+ });
+}
+
export default function funnelLayout(ecModel: GlobalModel, api: ExtensionAPI) {
ecModel.eachSeriesByType('funnel', function (seriesModel: FunnelSeriesModel) {
const data = seriesModel.getData();
const valueDim = data.mapDimension('value');
+ const valueArr = data.mapArray(valueDim, function (val: number) {
+ return val;
+ });
const sort = seriesModel.get('sort');
const viewRect = getViewRect(seriesModel, api);
const orient = seriesModel.get('orient');
+ const dynamicHeight = seriesModel.get('dynamicHeight');
const viewWidth = viewRect.width;
const viewHeight = viewRect.height;
let indices = getSortedIndices(data, sort);
let x = viewRect.x;
let y = viewRect.y;
- const sizeExtent = orient === 'horizontal' ? [
- parsePercent(seriesModel.get('minSize'), viewHeight),
- parsePercent(seriesModel.get('maxSize'), viewHeight)
- ] : [
+ let gap = seriesModel.get('gap');
+ const gapSum = gap * (data.count() - 1);
+ let sizeExtent: Array<number> = null;
+ if (dynamicHeight) {
+ sizeExtent = orient === 'horizontal' ? [
Review Comment:
The code can be more tight here.
```ts
const isHorizontal = orient === 'horizontal';
const size = isHorizontal ? xxxx : dynamicHeight ? xxx : xxx;
sizeExtent = [
parsePercent(seriesModel.get( 'minSize'), size),
parsePercent(seriesModel.get( 'maxSize'), size),
]
```
##########
src/chart/funnel/funnelLayout.ts:
##########
@@ -337,55 +427,156 @@ export default function funnelLayout(ecModel: GlobalModel, api: ExtensionAPI) {
indices = indices.reverse();
}
- for (let i = 0; i < indices.length; i++) {
- const idx = indices[i];
- const nextIdx = indices[i + 1];
- const itemModel = data.getItemModel<FunnelDataItemOption>(idx);
+ const valueSum = valueArr.reduce((pre, cur) => pre + cur);
- if (orient === 'horizontal') {
- let width = itemModel.get(['itemStyle', 'width']);
- if (width == null) {
- width = itemSize;
+ const getSideLen = function (sideLen: number | string, idx?: number): number {
+ if (dynamicHeight) {
+ // in dy height, user can't set itemHeight or itemWidth
+ const val = data.get(valueDim, idx) as number || 0;
+ sideLen = linearMap(val, [0, valueSum], sizeExtent, true);
+ sideLen = sort === 'ascending' ? -sideLen : sideLen;
+ return sideLen;
+ }
+
+ if (sideLen == null) {
+ sideLen = itemSize;
+ }
+ else {
+ if (orient === 'horizontal') {
+ sideLen = parsePercent(sideLen, viewWidth);
}
else {
- width = parsePercent(width, viewWidth);
- if (sort === 'ascending') {
- width = -width;
- }
+ sideLen = parsePercent(sideLen, viewHeight);
}
- const start = getLinePoints(idx, x);
- const end = getLinePoints(nextIdx, x + width);
+ if (sort === 'ascending') {
+ sideLen = -sideLen;
+ }
+ }
+ return sideLen;
+ };
- x += width + gap;
+ const exitShape = seriesModel.get('exitShape');
+ let resSize = sizeExtent[1];
+ let maxSize = sizeExtent[1];
+ let exitWidth: string | number = seriesModel.get('exitWidth');
- data.setItemLayout(idx, {
- points: start.concat(end.slice().reverse())
- });
+ if (exitWidth) {
+ const percentReg = /^\w{1,2}\.{0,}\w{0,}%$/;
+ if (percentReg.test(exitWidth)) {
+ exitWidth = parseInt(exitWidth, 10);
+ resSize = maxSize = 100 * maxSize / (100 - exitWidth);
}
else {
- let height = itemModel.get(['itemStyle', 'height']);
- if (height == null) {
- height = itemSize;
- }
- else {
- height = parsePercent(height, viewHeight);
- if (sort === 'ascending') {
- height = -height;
+ throw new Error(`the exitWidth must be in percentage format and cannot be greater than 99%,
+ but you set it as '${exitWidth}'`);
+ }
+ }
+
+ const showRate = seriesModel.get('showRate');
+ let firstVal: number;
+ const setLayoutPoints =
+ // The subsequent funnel shape modification will be done in this func.
+ // We don’t need to concern direction when we use this function to set points.
+ function (
+ index: number,
+ idx: number,
+ nextIdx: number,
+ sideLen: number,
+ pos: number
+ ): void {
+ if (dynamicHeight) {
+ const start = getLinePointsBySize(pos, resSize / maxSize * viewSize);
+ let end;
+
+ if (index === indices.length - 1 && exitShape === 'rect') {
+ end = getLinePointsBySize(pos + sideLen, resSize / maxSize * viewSize);
+ }
+ else {
+ resSize += sort === 'ascending' ? sideLen : -sideLen;
+ end = getLinePointsBySize(pos + sideLen, resSize / maxSize * viewSize);
}
+
+ data.setItemLayout(idx, {
+ points: start.concat(end.slice().reverse())
+ });
+ return;
}
+ else if (showRate) {
+ const dataStart = getLinePoints(idx, pos);
+ let dataEnd;
+ if (exitWidth !== undefined && index === indices.length - 1) {
+ const val = data.get(valueDim, idx) as number || 0;
Review Comment:
`number || 0` is still `number`
##########
src/chart/funnel/funnelLayout.ts:
##########
@@ -337,55 +427,156 @@ export default function funnelLayout(ecModel: GlobalModel, api: ExtensionAPI) {
indices = indices.reverse();
}
- for (let i = 0; i < indices.length; i++) {
- const idx = indices[i];
- const nextIdx = indices[i + 1];
- const itemModel = data.getItemModel<FunnelDataItemOption>(idx);
+ const valueSum = valueArr.reduce((pre, cur) => pre + cur);
- if (orient === 'horizontal') {
- let width = itemModel.get(['itemStyle', 'width']);
- if (width == null) {
- width = itemSize;
+ const getSideLen = function (sideLen: number | string, idx?: number): number {
+ if (dynamicHeight) {
+ // in dy height, user can't set itemHeight or itemWidth
+ const val = data.get(valueDim, idx) as number || 0;
+ sideLen = linearMap(val, [0, valueSum], sizeExtent, true);
+ sideLen = sort === 'ascending' ? -sideLen : sideLen;
+ return sideLen;
+ }
+
+ if (sideLen == null) {
+ sideLen = itemSize;
+ }
+ else {
+ if (orient === 'horizontal') {
+ sideLen = parsePercent(sideLen, viewWidth);
}
else {
- width = parsePercent(width, viewWidth);
- if (sort === 'ascending') {
- width = -width;
- }
+ sideLen = parsePercent(sideLen, viewHeight);
}
- const start = getLinePoints(idx, x);
- const end = getLinePoints(nextIdx, x + width);
+ if (sort === 'ascending') {
+ sideLen = -sideLen;
+ }
+ }
+ return sideLen;
+ };
- x += width + gap;
+ const exitShape = seriesModel.get('exitShape');
+ let resSize = sizeExtent[1];
+ let maxSize = sizeExtent[1];
+ let exitWidth: string | number = seriesModel.get('exitWidth');
- data.setItemLayout(idx, {
- points: start.concat(end.slice().reverse())
- });
+ if (exitWidth) {
+ const percentReg = /^\w{1,2}\.{0,}\w{0,}%$/;
+ if (percentReg.test(exitWidth)) {
+ exitWidth = parseInt(exitWidth, 10);
+ resSize = maxSize = 100 * maxSize / (100 - exitWidth);
}
else {
- let height = itemModel.get(['itemStyle', 'height']);
- if (height == null) {
- height = itemSize;
- }
- else {
- height = parsePercent(height, viewHeight);
- if (sort === 'ascending') {
- height = -height;
+ throw new Error(`the exitWidth must be in percentage format and cannot be greater than 99%,
+ but you set it as '${exitWidth}'`);
+ }
+ }
+
+ const showRate = seriesModel.get('showRate');
+ let firstVal: number;
+ const setLayoutPoints =
+ // The subsequent funnel shape modification will be done in this func.
+ // We don’t need to concern direction when we use this function to set points.
+ function (
+ index: number,
+ idx: number,
+ nextIdx: number,
+ sideLen: number,
+ pos: number
+ ): void {
+ if (dynamicHeight) {
+ const start = getLinePointsBySize(pos, resSize / maxSize * viewSize);
+ let end;
+
+ if (index === indices.length - 1 && exitShape === 'rect') {
+ end = getLinePointsBySize(pos + sideLen, resSize / maxSize * viewSize);
+ }
+ else {
+ resSize += sort === 'ascending' ? sideLen : -sideLen;
+ end = getLinePointsBySize(pos + sideLen, resSize / maxSize * viewSize);
}
+
+ data.setItemLayout(idx, {
+ points: start.concat(end.slice().reverse())
+ });
+ return;
}
+ else if (showRate) {
+ const dataStart = getLinePoints(idx, pos);
+ let dataEnd;
+ if (exitWidth !== undefined && index === indices.length - 1) {
+ const val = data.get(valueDim, idx) as number || 0;
+ const itemSize = linearMap(val, [min, max], sizeExtent, true);
+ const exitSize = itemSize * (exitWidth as number) / 100;
+ dataEnd = getLinePointsBySize(pos + sideLen / 2, exitSize);
+ }
+ else {
+ dataEnd = getLinePoints(idx, pos + sideLen / 2);
+ }
+ const rateStart = getLinePoints(idx, pos + sideLen / 2);
+ const rateEnd = getLinePoints(nextIdx, pos + sideLen);
- const start = getLinePoints(idx, y);
- const end = getLinePoints(nextIdx, y + height);
+ const val = data.get(valueDim, idx) as number || 0;
+ const nextVal = data.get(valueDim, nextIdx) as number || 0;
+ let rate: number | string = nextVal / val;
+ rate = 'Rate ' + (rate * 100).toFixed(0) + '%';
+ if (index === 0) {
+ firstVal = val;
+ }
+ else if (index === indices.length - 1) {
+ const lastVal = val;
+ rate = lastVal / firstVal;
+ rate = 'Overall rate ' + (rate * 100).toFixed(0) + '%';
+ }
- y += height + gap;
+ data.setItemLayout(idx, {
+ points: dataStart.concat(dataEnd.slice().reverse()),
+ ratePoints: rateStart.concat(rateEnd.slice().reverse()),
+ isLastPiece: index === indices.length - 1,
+ rate
+ });
+ return;
+ }
+ const start = getLinePoints(idx, pos);
+ let end;
+
+ if (index === indices.length - 1 && exitShape === 'rect') {
+ end = getLinePoints(idx, pos + sideLen);
Review Comment:
Like the comments above. The code can be tighter here.
```ts
end = getLinePoints( index === indices.length - 1 && exitShape === 'rect' ? idx : nextIdx, pos + sideLen);
```
--
This is an automated message from the Apache Git Service.
To respond to the message, please log on to GitHub and use the
URL above to go to the specific comment.
To unsubscribe, e-mail: commits-unsubscribe@echarts.apache.org
For queries about this service, please contact Infrastructure at:
users@infra.apache.org
---------------------------------------------------------------------
To unsubscribe, e-mail: commits-unsubscribe@echarts.apache.org
For additional commands, e-mail: commits-help@echarts.apache.org
[GitHub] [echarts] pe-3 commented on pull request #17461: feat(funnel): add funnel new styles #14863
Posted by GitBox <gi...@apache.org>.
pe-3 commented on PR #17461:
URL: https://github.com/apache/echarts/pull/17461#issuecomment-1229369083

   > To be honest, I don't like the idea of `dynamicHeight` from the perspect of data visualization because it may cause much misunderstanding. But I understand this may be a common requirement so we can provide this option.
   >
   > But `dynamicHeight` is not a good name because it does not tell how it works with _dynamic_. From the description, I understand that the height is relative to the data. So we should probably present this information in the name.
   >
   > #17566 suggests using the area of the shapes to represent the data. Although you don't have to implement this feature in your PR, you should probably better design the API to make that feature possible in future PRs.
   >
   > > FYI, pie series use [roseType](https://echarts.apache.org/en/option.html#series-pie.roseType), although I'm not sure if this is useful.

   I also find this attribute suboptimal,what about dyamicMode, and it's alternative values are `height` and `size`.


--
This is an automated message from the Apache Git Service.
To respond to the message, please log on to GitHub and use the
URL above to go to the specific comment.

To unsubscribe, e-mail: commits-unsubscribe@echarts.apache.org

For queries about this service, please contact Infrastructure at:
users@infra.apache.org


---------------------------------------------------------------------
To unsubscribe, e-mail: commits-unsubscribe@echarts.apache.org
For additional commands, e-mail: commits-help@echarts.apache.org
[GitHub] [echarts] pe-3 commented on a diff in pull request #17461: feat(funnel): add funnel new styles #14863
Posted by GitBox <gi...@apache.org>.
pe-3 commented on code in PR #17461:
URL: https://github.com/apache/echarts/pull/17461#discussion_r954477455


##########
src/chart/funnel/FunnelSeries.ts:
##########
@@ -94,7 +94,15 @@ export interface FunnelSeriesOption

     funnelAlign?: HorizontalAlign | VerticalAlign

+    exitShape?: 'rect' | 'none'
+
     data?: (OptionDataValueNumeric | OptionDataValueNumeric[] | FunnelDataItemOption)[]
+
+    dynamicHeight?: boolean
+
+    exitWidth?: string

Review Comment:
   Because when dynamicHeight is  true, set exitWidth to make whole funnel a trapezoidal. When exitWidth is '100%', it's mean whole funnel a rect, it's unreasonable . And when showRate is true, and not in dynamicHeight, set exitWidth to make exit piece a trapezoidal. Set exitShape rect when dynamicHeight is true and default situation, it will make exit piece a rect, beacaue exitWidth can't control exit piece in this two situation.


--
This is an automated message from the Apache Git Service.
To respond to the message, please log on to GitHub and use the
URL above to go to the specific comment.

To unsubscribe, e-mail: commits-unsubscribe@echarts.apache.org

For queries about this service, please contact Infrastructure at:
users@infra.apache.org


---------------------------------------------------------------------
To unsubscribe, e-mail: commits-unsubscribe@echarts.apache.org
For additional commands, e-mail: commits-help@echarts.apache.org
[GitHub] [echarts] pe-3 commented on pull request #17461: feat(funnel): add funnel new styles #14863
Posted by GitBox <gi...@apache.org>.
pe-3 commented on PR #17461:
URL: https://github.com/apache/echarts/pull/17461#issuecomment-1229173484

   What about dynamicSize?

   > To be honest, I don't like the idea of `dynamicHeight` from the perspect of data visualization because it may cause much misunderstanding. But I understand this may be a common requirement so we can provide this option.
   >
   > But `dynamicHeight` is not a good name because it does not tell how it works with _dynamic_. From the description, I understand that the height is relative to the data. So we should probably present this information in the name.
   >
   > #17566 suggests using the area of the shapes to represent the data. Although you don't have to implement this feature in your PR, you should probably better design the API to make that feature possible in future PRs.
   >
   > > FYI, pie series use [roseType](https://echarts.apache.org/en/option.html#series-pie.roseType), although I'm not sure if this is useful.


--
This is an automated message from the Apache Git Service.
To respond to the message, please log on to GitHub and use the
URL above to go to the specific comment.

To unsubscribe, e-mail: commits-unsubscribe@echarts.apache.org

For queries about this service, please contact Infrastructure at:
users@infra.apache.org


---------------------------------------------------------------------
To unsubscribe, e-mail: commits-unsubscribe@echarts.apache.org
For additional commands, e-mail: commits-help@echarts.apache.org
[GitHub] [echarts] pe-3 commented on a diff in pull request #17461: feat(funnel): add funnel new styles #14863
Posted by GitBox <gi...@apache.org>.
pe-3 commented on code in PR #17461:
URL: https://github.com/apache/echarts/pull/17461#discussion_r954479080


##########
src/chart/funnel/FunnelSeries.ts:
##########
@@ -19,8 +19,8 @@

 import * as zrUtil from 'zrender/src/core/util';
 import createSeriesDataSimply from '../helper/createSeriesDataSimply';
-import {defaultEmphasis} from '../../util/model';
-import {makeSeriesEncodeForNameBased} from '../../data/helper/sourceHelper';
+import { defaultEmphasis } from '../../util/model';

Review Comment:
   My vscode plugins format those unexpected change.


--
This is an automated message from the Apache Git Service.
To respond to the message, please log on to GitHub and use the
URL above to go to the specific comment.

To unsubscribe, e-mail: commits-unsubscribe@echarts.apache.org

For queries about this service, please contact Infrastructure at:
users@infra.apache.org


---------------------------------------------------------------------
To unsubscribe, e-mail: commits-unsubscribe@echarts.apache.org
For additional commands, e-mail: commits-help@echarts.apache.org
[GitHub] [echarts] Ovilia commented on a diff in pull request #17461: feat(funnel): add funnel new styles #14863
Posted by GitBox <gi...@apache.org>.
Ovilia commented on code in PR #17461:
URL: https://github.com/apache/echarts/pull/17461#discussion_r953284462


##########
src/chart/funnel/FunnelSeries.ts:
##########
@@ -94,7 +94,15 @@ export interface FunnelSeriesOption

     funnelAlign?: HorizontalAlign | VerticalAlign

+    exitShape?: 'rect' | 'none'
+
     data?: (OptionDataValueNumeric | OptionDataValueNumeric[] | FunnelDataItemOption)[]
+
+    dynamicHeight?: boolean
+
+    exitWidth?: string

Review Comment:
   Since we provide `exitWidth`, the user can set `exitWidth: '100%'` to make the exit shape to be rect, why do we need an extra option `exitShape`?


##########
src/chart/funnel/FunnelSeries.ts:
##########
@@ -19,8 +19,8 @@

 import * as zrUtil from 'zrender/src/core/util';
 import createSeriesDataSimply from '../helper/createSeriesDataSimply';
-import {defaultEmphasis} from '../../util/model';
-import {makeSeriesEncodeForNameBased} from '../../data/helper/sourceHelper';
+import { defaultEmphasis } from '../../util/model';

Review Comment:
   Unexpected change


##########
src/chart/funnel/FunnelView.ts:
##########
@@ -167,8 +169,141 @@ class FunnelPiece extends graphic.Polygon {
             stroke: visualColor
         });
     }
+
+    ratePiece: RatePiece;
 }

+class RatePiece extends graphic.Polygon {
+
+    constructor(data: SeriesData, idx: number) {
+        super();
+
+        const polygon = this;
+        const labelLine = new graphic.Polyline();
+        const text = new graphic.Text();
+        polygon.setTextContent(text);
+        this.setTextGuideLine(labelLine);
+
+        this.updateData(data, idx, true);
+    }
+    updateData(data: SeriesData, idx: number, firstCreate?: boolean) {
+        const polygon = this;
+        const layout = data.getItemLayout(idx);
+        const seriesModel = data.hostModel;
+        let opacity: number;
+        if (layout.isLastPiece) {
+            opacity = 1;
+        }
+        else {
+            opacity = 0.5;
+        }
+
+        if (!firstCreate) {
+            saveOldStyle(polygon);
+        }
+
+        if (layout.isLastPiece) {
+            polygon.useStyle(Object.assign(data.getItemVisual(idx, 'style'), { fill: 'rgba(0,0,0,0)' }));

Review Comment:
   Can you explain what `fill: 'rgba(0,0,0,0)'` is used for?


##########
src/chart/funnel/FunnelView.ts:
##########
@@ -167,8 +169,141 @@ class FunnelPiece extends graphic.Polygon {
             stroke: visualColor
         });
     }
+
+    ratePiece: RatePiece;
 }

+class RatePiece extends graphic.Polygon {
+
+    constructor(data: SeriesData, idx: number) {
+        super();
+
+        const polygon = this;
+        const labelLine = new graphic.Polyline();
+        const text = new graphic.Text();
+        polygon.setTextContent(text);
+        this.setTextGuideLine(labelLine);
+
+        this.updateData(data, idx, true);
+    }
+    updateData(data: SeriesData, idx: number, firstCreate?: boolean) {
+        const polygon = this;
+        const layout = data.getItemLayout(idx);
+        const seriesModel = data.hostModel;
+        let opacity: number;
+        if (layout.isLastPiece) {
+            opacity = 1;
+        }
+        else {
+            opacity = 0.5;
+        }
+
+        if (!firstCreate) {
+            saveOldStyle(polygon);
+        }
+
+        if (layout.isLastPiece) {
+            polygon.useStyle(Object.assign(data.getItemVisual(idx, 'style'), { fill: 'rgba(0,0,0,0)' }));
+        }
+        else {
+            polygon.useStyle(data.getItemVisual(idx, 'style'));
+        }
+
+        if (firstCreate) {
+            polygon.setShape({
+                points: layout.ratePoints
+            });
+            polygon.style.opacity = 0;
+            graphic.initProps(polygon, {
+                style: {
+                    opacity
+                }
+            }, seriesModel, idx);
+        }
+        else {
+            graphic.updateProps(polygon, {
+                style: {
+                    opacity
+                },
+                shape: {
+                    points: layout.ratePoints
+                }
+            }, seriesModel, idx);
+        }
+        this._updateLabel(data, idx);
+    }

Review Comment:
   Add an empty line before fuctions


##########
src/chart/funnel/FunnelSeries.ts:
##########
@@ -45,7 +45,7 @@ import SeriesData from '../../data/SeriesData';

 type FunnelLabelOption = Omit<SeriesLabelOption, 'position'> & {
     position?: LabelOption['position']
-        | 'outer' | 'inner' | 'center' | 'rightTop' | 'rightBottom' | 'leftTop' | 'leftBottom'
+    | 'outer' | 'inner' | 'center' | 'rightTop' | 'rightBottom' | 'leftTop' | 'leftBottom'

Review Comment:
   Unexpected change


--
This is an automated message from the Apache Git Service.
To respond to the message, please log on to GitHub and use the
URL above to go to the specific comment.

To unsubscribe, e-mail: commits-unsubscribe@echarts.apache.org

For queries about this service, please contact Infrastructure at:
users@infra.apache.org


---------------------------------------------------------------------
To unsubscribe, e-mail: commits-unsubscribe@echarts.apache.org
For additional commands, e-mail: commits-help@echarts.apache.org
[GitHub] [echarts] pissang commented on a diff in pull request #17461: feat(funnel): add funnel new styles #14863
Posted by GitBox <gi...@apache.org>.
pissang commented on code in PR #17461:
URL: https://github.com/apache/echarts/pull/17461#discussion_r996377448
##########
src/chart/funnel/funnelLayout.ts:
##########
@@ -324,68 +377,242 @@ export default function funnelLayout(ecModel: GlobalModel, api: ExtensionAPI) {
];
};
+ const getLinePointsBySize = function (offset: number, itemSize: number) {
+ // do not caculate line width in this func
+ if (orient === 'horizontal') {
+ const itemHeight = itemSize;
+ let y0;
+ switch (funnelAlign) {
+ case 'top':
+ y0 = y;
+ break;
+ case 'center':
+ y0 = y + (viewHeight - itemHeight) / 2;
+ break;
+ case 'bottom':
+ y0 = y + (viewHeight - itemHeight);
+ break;
+ }
+
+ return [
+ [offset, y0],
+ [offset, y0 + itemHeight]
+ ];
+ }
+ const itemWidth = itemSize;
+ let x0;
+ switch (funnelAlign) {
+ case 'left':
+ x0 = x;
+ break;
+ case 'center':
+ x0 = x + (viewWidth - itemWidth) / 2;
+ break;
+ case 'right':
+ x0 = x + viewWidth - itemWidth;
+ break;
+ }
+ return [
+ [x0, offset],
+ [x0 + itemWidth, offset]
+ ];
+ };
+
+ // adjust related param
if (sort === 'ascending') {
// From bottom to top
itemSize = -itemSize;
- gap = -gap;
+ const symbol = !dynamicHeight && dynamicArea ? 1 : -1;
+ gap = gap * symbol;
if (orient === 'horizontal') {
- x += viewWidth;
+ x += symbol === 1 ? 0 : viewWidth;
}
else {
- y += viewHeight;
+ y += symbol === 1 ? 0 : viewHeight;
}
indices = indices.reverse();
}
-
- for (let i = 0; i < indices.length; i++) {
- const idx = indices[i];
- const nextIdx = indices[i + 1];
- const itemModel = data.getItemModel<FunnelDataItemOption>(idx);
-
- if (orient === 'horizontal') {
- let width = itemModel.get(['itemStyle', 'width']);
- if (width == null) {
- width = itemSize;
+ else {
+ if (dynamicArea && !dynamicHeight) {
+ gap = -gap;
+ if (orient === 'horizontal') {
+ x += viewWidth;
}
else {
- width = parsePercent(width, viewWidth);
- if (sort === 'ascending') {
- width = -width;
- }
+ y += viewHeight;
}
+ }
+ }
- const start = getLinePoints(idx, x);
- const end = getLinePoints(nextIdx, x + width);
+ // dynamicArea about
+ const areaExtent = [0, viewHeight * viewWidth / 2];
+ // auxiliary variable
+ let cumulativeArea = 0;
+ let cumulativeHeight = 0;
+ // piece top and bottom
+ let pieceAreaBottom = 0;
+ let pieceAreaTop = 0;
- x += width + gap;
+ const valueSum = valueArr.reduce((pre, cur) => pre + cur);
- data.setItemLayout(idx, {
- points: start.concat(end.slice().reverse())
- });
+ const getPieceHeight = function (pieceHeight: number | string, idx?: number): number {
+ // get funnel piece height pass to getLinePoints func based on data value
+ const val = data.get(valueDim, idx) as number || 0;
+
+ if (dynamicHeight) {
+ // in dy height, user can't set itemHeight or itemWidth
+ pieceHeight = linearMap(val, [0, valueSum], [0, size], true);
+
+ pieceHeight = sort === 'ascending' ? -pieceHeight : pieceHeight;
+ return pieceHeight;
+ }
+ else if (dynamicArea) {
+ // in dy size, user can't set itemHeight or itemWidth too
+ const pieceArea = linearMap(val, [0, valueSum], areaExtent, true);
+
+ cumulativeArea += pieceArea;
+ pieceAreaTop = pieceAreaBottom;
+
+ // calculate bottom line length and top line length
+ pieceAreaBottom = Math.sqrt(2 * cumulativeArea * size / viewSize);
+ pieceHeight = pieceAreaBottom * viewSize / size - cumulativeHeight;
+
+ cumulativeHeight += pieceHeight;
+ pieceHeight = sort === 'ascending' ? pieceHeight : -pieceHeight;
+ return pieceHeight;
+ }
+
+ // default mapping
+ if (pieceHeight == null) {
+ pieceHeight = itemSize;
}
else {
- let height = itemModel.get(['itemStyle', 'height']);
- if (height == null) {
- height = itemSize;
+ pieceHeight = parsePercent(pieceHeight, orient === 'horizontal' ? viewWidth : viewHeight);
+ pieceHeight = sort === 'ascending' ? -pieceHeight : pieceHeight;
+ }
+ return pieceHeight;
+ };
+
+ // dy height funnel size about
+ const thickDegree = parsePercent(seriesModel.get('thickDegree'), 100);
+ thickDegree >= 100 && console.warn('thickDegree shouldn\'t be greater than or equal to 100');
Review Comment:
Every `warn` should be in the `__DEV__` condition so it will be emitted in the production.
##########
src/chart/funnel/FunnelView.ts:
##########
@@ -167,6 +167,141 @@ class FunnelPiece extends graphic.Polygon {
stroke: visualColor
});
}
+
+ ratePiece: RatePiece;
+}
+
+class RatePiece extends graphic.Polygon {
Review Comment:
Seems there are too many code same to the `FunnelPiece`. Could we reuse them?
##########
src/chart/funnel/funnelLayout.ts:
##########
@@ -324,68 +377,242 @@ export default function funnelLayout(ecModel: GlobalModel, api: ExtensionAPI) {
];
};
+ const getLinePointsBySize = function (offset: number, itemSize: number) {
+ // do not caculate line width in this func
+ if (orient === 'horizontal') {
+ const itemHeight = itemSize;
+ let y0;
+ switch (funnelAlign) {
+ case 'top':
+ y0 = y;
+ break;
+ case 'center':
+ y0 = y + (viewHeight - itemHeight) / 2;
+ break;
+ case 'bottom':
+ y0 = y + (viewHeight - itemHeight);
+ break;
+ }
+
+ return [
+ [offset, y0],
+ [offset, y0 + itemHeight]
+ ];
+ }
+ const itemWidth = itemSize;
+ let x0;
+ switch (funnelAlign) {
+ case 'left':
+ x0 = x;
+ break;
+ case 'center':
+ x0 = x + (viewWidth - itemWidth) / 2;
+ break;
+ case 'right':
+ x0 = x + viewWidth - itemWidth;
+ break;
+ }
+ return [
+ [x0, offset],
+ [x0 + itemWidth, offset]
+ ];
+ };
+
+ // adjust related param
if (sort === 'ascending') {
// From bottom to top
itemSize = -itemSize;
- gap = -gap;
+ const symbol = !dynamicHeight && dynamicArea ? 1 : -1;
+ gap = gap * symbol;
if (orient === 'horizontal') {
- x += viewWidth;
+ x += symbol === 1 ? 0 : viewWidth;
}
else {
- y += viewHeight;
+ y += symbol === 1 ? 0 : viewHeight;
}
indices = indices.reverse();
}
-
- for (let i = 0; i < indices.length; i++) {
- const idx = indices[i];
- const nextIdx = indices[i + 1];
- const itemModel = data.getItemModel<FunnelDataItemOption>(idx);
-
- if (orient === 'horizontal') {
- let width = itemModel.get(['itemStyle', 'width']);
- if (width == null) {
- width = itemSize;
+ else {
+ if (dynamicArea && !dynamicHeight) {
+ gap = -gap;
+ if (orient === 'horizontal') {
+ x += viewWidth;
}
else {
- width = parsePercent(width, viewWidth);
- if (sort === 'ascending') {
- width = -width;
- }
+ y += viewHeight;
}
+ }
+ }
- const start = getLinePoints(idx, x);
- const end = getLinePoints(nextIdx, x + width);
+ // dynamicArea about
+ const areaExtent = [0, viewHeight * viewWidth / 2];
+ // auxiliary variable
+ let cumulativeArea = 0;
+ let cumulativeHeight = 0;
+ // piece top and bottom
+ let pieceAreaBottom = 0;
+ let pieceAreaTop = 0;
- x += width + gap;
+ const valueSum = valueArr.reduce((pre, cur) => pre + cur);
- data.setItemLayout(idx, {
- points: start.concat(end.slice().reverse())
- });
+ const getPieceHeight = function (pieceHeight: number | string, idx?: number): number {
+ // get funnel piece height pass to getLinePoints func based on data value
+ const val = data.get(valueDim, idx) as number || 0;
+
+ if (dynamicHeight) {
+ // in dy height, user can't set itemHeight or itemWidth
+ pieceHeight = linearMap(val, [0, valueSum], [0, size], true);
+
+ pieceHeight = sort === 'ascending' ? -pieceHeight : pieceHeight;
+ return pieceHeight;
+ }
+ else if (dynamicArea) {
+ // in dy size, user can't set itemHeight or itemWidth too
+ const pieceArea = linearMap(val, [0, valueSum], areaExtent, true);
+
+ cumulativeArea += pieceArea;
+ pieceAreaTop = pieceAreaBottom;
+
+ // calculate bottom line length and top line length
+ pieceAreaBottom = Math.sqrt(2 * cumulativeArea * size / viewSize);
+ pieceHeight = pieceAreaBottom * viewSize / size - cumulativeHeight;
+
+ cumulativeHeight += pieceHeight;
+ pieceHeight = sort === 'ascending' ? pieceHeight : -pieceHeight;
+ return pieceHeight;
+ }
+
+ // default mapping
+ if (pieceHeight == null) {
+ pieceHeight = itemSize;
}
else {
- let height = itemModel.get(['itemStyle', 'height']);
- if (height == null) {
- height = itemSize;
+ pieceHeight = parsePercent(pieceHeight, orient === 'horizontal' ? viewWidth : viewHeight);
+ pieceHeight = sort === 'ascending' ? -pieceHeight : pieceHeight;
+ }
+ return pieceHeight;
+ };
+
+ // dy height funnel size about
+ const thickDegree = parsePercent(seriesModel.get('thickDegree'), 100);
+ thickDegree >= 100 && console.warn('thickDegree shouldn\'t be greater than or equal to 100');
+ const maxSize = thickDegree < 100 ? sizeExtent[1] * 100 / (100 - thickDegree) : sizeExtent[1];
+ let resSize = maxSize;
+
+ // rate funnel about
+ const showRate = seriesModel.get('showRate');
+ let firstVal: number;
+
+ // exit shape control
+ const exitWidth = parsePercent(seriesModel.get('exitWidth'), 100);
+
+ const setLayoutPoints =
+ // The subsequent funnel shape modification will be done in this func.
+ // We don’t need to concern direction when we use this function to set points.
+ function (
+ index: number,
+ idx: number,
+ nextIdx: number,
+ pieceHeight: number,
+ pos: number
+ ): void {
+ if (dynamicHeight) {
+ const start = getLinePointsBySize(pos, resSize / maxSize * viewSize);
+ index === indices.length - 1 && exitWidth === 100
+ || (
+ resSize += sort === 'ascending' ? pieceHeight : -pieceHeight
+ );
+ const end = getLinePointsBySize(pos + pieceHeight, resSize / maxSize * viewSize);
+
+ data.setItemLayout(idx, {
+ points: start.concat(end.slice().reverse())
+ });
+ return;
}
- else {
- height = parsePercent(height, viewHeight);
- if (sort === 'ascending') {
- height = -height;
- }
+ else if (dynamicArea) {
+ const start = getLinePointsBySize(pos, pieceAreaTop);
+ const end = getLinePointsBySize(pos + pieceHeight, pieceAreaBottom);
+
+ data.setItemLayout(idx, {
+ points: start.concat(end.slice().reverse())
+ });
+ return;
}
+ else if (showRate) {
+ // data piece
+ const dataStart = getLinePoints(idx, pos);
+ let dataEnd;
+ const val = data.get(valueDim, idx) as number || 0;
+ if (exitWidth !== undefined && index === indices.length - 1) {
+ const itemSize = linearMap(val, [min, max], sizeExtent, true);
+ const exitSize = itemSize * (exitWidth > 100 ? 100 : exitWidth) / 100;
+ dataEnd = getLinePointsBySize(pos + pieceHeight / 2, exitSize);
+ }
+ else {
+ dataEnd = getLinePoints(idx, pos + pieceHeight / 2);
+ }
- const start = getLinePoints(idx, y);
- const end = getLinePoints(nextIdx, y + height);
+ // rate piece
+ const rateStart = getLinePoints(idx, pos + pieceHeight / 2);
+ const rateEnd = getLinePoints(nextIdx, pos + pieceHeight);
- y += height + gap;
+ // rate label text about
+ const nextVal = data.get(valueDim, nextIdx) as number || 0;
+ let rate: number | string = nextVal / val;
+ rate = 'Rate ' + (rate * 100).toFixed(0) + '%';
+ if (index === 0) {
+ firstVal = val;
+ }
+ else if (index === indices.length - 1) {
+ const lastVal = val;
+ rate = lastVal / firstVal;
+ rate = 'Overall rate ' + (rate * 100).toFixed(0) + '%';
Review Comment:
Still the default rate string should not be fixed here. It's not `i18n` friendly and hard to be formatted
##########
src/chart/funnel/FunnelView.ts:
##########
@@ -167,6 +167,141 @@ class FunnelPiece extends graphic.Polygon {
stroke: visualColor
});
}
+
+ ratePiece: RatePiece;
+}
+
+class RatePiece extends graphic.Polygon {
+
+ constructor(data: SeriesData, idx: number) {
+ super();
+
+ const polygon = this;
+ const labelLine = new graphic.Polyline();
+ const text = new graphic.Text();
+ polygon.setTextContent(text);
+ this.setTextGuideLine(labelLine);
+
+ this.updateData(data, idx, true);
+ }
+
+ updateData(data: SeriesData, idx: number, firstCreate?: boolean) {
+ const polygon = this;
+ const layout = data.getItemLayout(idx);
+ const seriesModel = data.hostModel;
+ let opacity: number;
+
+ if (layout.isLastPiece) {
+ opacity = 1;
+ }
+ else {
+ opacity = 0.5;
+ }
+
+ if (!firstCreate) {
+ saveOldStyle(polygon);
+ }
+
+ if (layout.isLastPiece) {
+ polygon.useStyle(Object.assign(data.getItemVisual(idx, 'style'), { fill: 'rgba(0,0,0,0)' }));
Review Comment:
If you want hide the last piece. Set it to `ignore: true` is the best way. Or set `invisible: true` if you still want it to be interactable
--
This is an automated message from the Apache Git Service.
To respond to the message, please log on to GitHub and use the
URL above to go to the specific comment.
To unsubscribe, e-mail: commits-unsubscribe@echarts.apache.org
For queries about this service, please contact Infrastructure at:
users@infra.apache.org
---------------------------------------------------------------------
To unsubscribe, e-mail: commits-unsubscribe@echarts.apache.org
For additional commands, e-mail: commits-help@echarts.apache.org
[GitHub] [echarts] pissang merged pull request #17461: feat(funnel): add funnel new styles #14863
Posted by GitBox <gi...@apache.org>.
pissang merged PR #17461:
URL: https://github.com/apache/echarts/pull/17461


--
This is an automated message from the Apache Git Service.
To respond to the message, please log on to GitHub and use the
URL above to go to the specific comment.

To unsubscribe, e-mail: commits-unsubscribe@echarts.apache.org

For queries about this service, please contact Infrastructure at:
users@infra.apache.org


---------------------------------------------------------------------
To unsubscribe, e-mail: commits-unsubscribe@echarts.apache.org
For additional commands, e-mail: commits-help@echarts.apache.org
[GitHub] [echarts] Ovilia commented on a diff in pull request #17461: feat(funnel): add funnel new styles #14863
Posted by GitBox <gi...@apache.org>.
Ovilia commented on code in PR #17461:
URL: https://github.com/apache/echarts/pull/17461#discussion_r954782704


##########
src/chart/funnel/FunnelSeries.ts:
##########
@@ -94,7 +94,15 @@ export interface FunnelSeriesOption

     funnelAlign?: HorizontalAlign | VerticalAlign

+    exitShape?: 'rect' | 'none'
+
     data?: (OptionDataValueNumeric | OptionDataValueNumeric[] | FunnelDataItemOption)[]
+
+    dynamicHeight?: boolean
+
+    exitWidth?: string

Review Comment:
   I read the description again and I found that I misunderstood the concept of `exitWidth` completely. I think this is a useful feature but a better name is required to let the developers understand this is for the overall funnel rather than the last one because the *exist* suggest it to be the last one.


--
This is an automated message from the Apache Git Service.
To respond to the message, please log on to GitHub and use the
URL above to go to the specific comment.

To unsubscribe, e-mail: commits-unsubscribe@echarts.apache.org

For queries about this service, please contact Infrastructure at:
users@infra.apache.org


---------------------------------------------------------------------
To unsubscribe, e-mail: commits-unsubscribe@echarts.apache.org
For additional commands, e-mail: commits-help@echarts.apache.org
[GitHub] [echarts] vuminhhieu1311 commented on pull request #17461: feat(funnel): add funnel new styles #14863
Posted by "vuminhhieu1311 (via GitHub)" <gi...@apache.org>.
vuminhhieu1311 commented on PR #17461:
URL: https://github.com/apache/echarts/pull/17461#issuecomment-1411861567
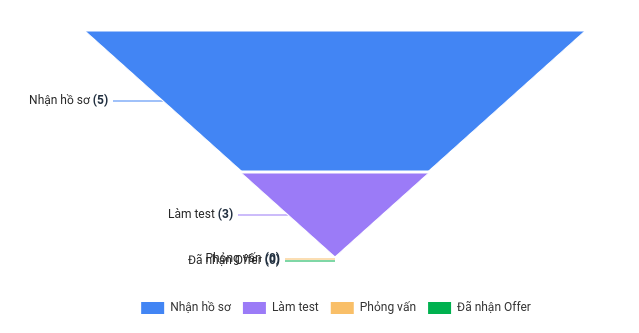
@pe-3 when the value of the last two items is 0, the label will be displayed like this. How can I solve that problem?
--
This is an automated message from the Apache Git Service.
To respond to the message, please log on to GitHub and use the
URL above to go to the specific comment.
To unsubscribe, e-mail: commits-unsubscribe@echarts.apache.org
For queries about this service, please contact Infrastructure at:
users@infra.apache.org
---------------------------------------------------------------------
To unsubscribe, e-mail: commits-unsubscribe@echarts.apache.org
For additional commands, e-mail: commits-help@echarts.apache.org
[GitHub] [echarts] Ovilia commented on pull request #17461: feat(funnel): add funnel new styles #14863
Posted by GitBox <gi...@apache.org>.
Ovilia commented on PR #17461:
URL: https://github.com/apache/echarts/pull/17461#issuecomment-1227070055

   To be honest, I don't like the idea of `dynamicHeight` from the perspect of data visualization because it may cause much misunderstanding. But I understand this may be a common requirement so we can provide this option.

   But `dynamicHeight` is not a good name because it does not tell how it works with *dynamic*. From the description, I understand that the height is relative to the data. So we should probably present this information in the name.

   #17566 suggests using the area of the shapes to represent the data. Although you don't have to implement this feature in your PR, you should probably better design the API to make that feature possible in future PRs.

   > FYI, pie series use [roseType](https://echarts.apache.org/en/option.html#series-pie.roseType), although I'm not sure if this is useful.


--
This is an automated message from the Apache Git Service.
To respond to the message, please log on to GitHub and use the
URL above to go to the specific comment.

To unsubscribe, e-mail: commits-unsubscribe@echarts.apache.org

For queries about this service, please contact Infrastructure at:
users@infra.apache.org


---------------------------------------------------------------------
To unsubscribe, e-mail: commits-unsubscribe@echarts.apache.org
For additional commands, e-mail: commits-help@echarts.apache.org
[GitHub] [echarts] pissang commented on a diff in pull request #17461: feat(funnel): add funnel new styles #14863
Posted by GitBox <gi...@apache.org>.
pissang commented on code in PR #17461:
URL: https://github.com/apache/echarts/pull/17461#discussion_r996377667


##########
src/chart/funnel/funnelLayout.ts:
##########
@@ -324,68 +377,242 @@ export default function funnelLayout(ecModel: GlobalModel, api: ExtensionAPI) {
             ];
         };

+        const getLinePointsBySize = function (offset: number, itemSize: number) {
+            // do not caculate line width in this func
+            if (orient === 'horizontal') {
+                const itemHeight = itemSize;
+                let y0;
+                switch (funnelAlign) {
+                    case 'top':
+                        y0 = y;
+                        break;
+                    case 'center':
+                        y0 = y + (viewHeight - itemHeight) / 2;
+                        break;
+                    case 'bottom':
+                        y0 = y + (viewHeight - itemHeight);
+                        break;
+                }
+
+                return [
+                    [offset, y0],
+                    [offset, y0 + itemHeight]
+                ];
+            }
+            const itemWidth = itemSize;
+            let x0;
+            switch (funnelAlign) {
+                case 'left':
+                    x0 = x;
+                    break;
+                case 'center':
+                    x0 = x + (viewWidth - itemWidth) / 2;
+                    break;
+                case 'right':
+                    x0 = x + viewWidth - itemWidth;
+                    break;
+            }
+            return [
+                [x0, offset],
+                [x0 + itemWidth, offset]
+            ];
+        };
+
+        // adjust related param
         if (sort === 'ascending') {
             // From bottom to top
             itemSize = -itemSize;
-            gap = -gap;
+            const symbol = !dynamicHeight && dynamicArea ? 1 : -1;
+            gap = gap * symbol;
             if (orient === 'horizontal') {
-                x += viewWidth;
+                x += symbol === 1 ? 0 : viewWidth;
             }
             else {
-                y += viewHeight;
+                y += symbol === 1 ? 0 : viewHeight;
             }
             indices = indices.reverse();
         }
-
-        for (let i = 0; i < indices.length; i++) {
-            const idx = indices[i];
-            const nextIdx = indices[i + 1];
-            const itemModel = data.getItemModel<FunnelDataItemOption>(idx);
-
-            if (orient === 'horizontal') {
-                let width = itemModel.get(['itemStyle', 'width']);
-                if (width == null) {
-                    width = itemSize;
+        else {
+            if (dynamicArea && !dynamicHeight) {
+                gap = -gap;
+                if (orient === 'horizontal') {
+                    x += viewWidth;
                 }
                 else {
-                    width = parsePercent(width, viewWidth);
-                    if (sort === 'ascending') {
-                        width = -width;
-                    }
+                    y += viewHeight;
                 }
+            }
+        }

-                const start = getLinePoints(idx, x);
-                const end = getLinePoints(nextIdx, x + width);
+        // dynamicArea about
+        const areaExtent = [0, viewHeight * viewWidth / 2];
+        // auxiliary variable
+        let cumulativeArea = 0;
+        let cumulativeHeight = 0;
+        // piece top and bottom
+        let pieceAreaBottom = 0;
+        let pieceAreaTop = 0;

-                x += width + gap;
+        const valueSum = valueArr.reduce((pre, cur) => pre + cur);

-                data.setItemLayout(idx, {
-                    points: start.concat(end.slice().reverse())
-                });
+        const getPieceHeight = function (pieceHeight: number | string, idx?: number): number {
+            // get funnel piece height pass to getLinePoints func based on data value
+            const val = data.get(valueDim, idx) as number || 0;
+
+            if (dynamicHeight) {
+                // in dy height, user can't set itemHeight or itemWidth
+                pieceHeight = linearMap(val, [0, valueSum], [0, size], true);
+
+                pieceHeight = sort === 'ascending' ? -pieceHeight : pieceHeight;
+                return pieceHeight;
+            }
+            else if (dynamicArea) {
+                // in dy size, user can't set itemHeight or itemWidth too
+                const pieceArea = linearMap(val, [0, valueSum], areaExtent, true);
+
+                cumulativeArea += pieceArea;
+                pieceAreaTop = pieceAreaBottom;
+
+                // calculate bottom line length and top line length
+                pieceAreaBottom = Math.sqrt(2 * cumulativeArea * size / viewSize);
+                pieceHeight = pieceAreaBottom * viewSize / size - cumulativeHeight;
+
+                cumulativeHeight += pieceHeight;
+                pieceHeight = sort === 'ascending' ? pieceHeight : -pieceHeight;
+                return pieceHeight;
+            }
+
+            // default mapping
+            if (pieceHeight == null) {
+                pieceHeight = itemSize;
             }
             else {
-                let height = itemModel.get(['itemStyle', 'height']);
-                if (height == null) {
-                    height = itemSize;
+                pieceHeight = parsePercent(pieceHeight, orient === 'horizontal' ? viewWidth : viewHeight);
+                pieceHeight = sort === 'ascending' ? -pieceHeight : pieceHeight;
+            }
+            return pieceHeight;
+        };
+
+        // dy height funnel size about
+        const thickDegree = parsePercent(seriesModel.get('thickDegree'), 100);
+        thickDegree >= 100 && console.warn('thickDegree shouldn\'t be greater than or equal to 100');
+        const maxSize = thickDegree < 100 ? sizeExtent[1] * 100 / (100 - thickDegree) : sizeExtent[1];
+        let resSize = maxSize;
+
+        // rate funnel about
+        const showRate = seriesModel.get('showRate');
+        let firstVal: number;
+
+        // exit shape control
+        const exitWidth = parsePercent(seriesModel.get('exitWidth'), 100);
+
+        const setLayoutPoints =
+            // The subsequent funnel shape modification will be done in this func.
+            // We don’t need to concern direction when we use this function to set points.
+            function (
+                index: number,
+                idx: number,
+                nextIdx: number,
+                pieceHeight: number,
+                pos: number
+            ): void {
+                if (dynamicHeight) {
+                    const start = getLinePointsBySize(pos, resSize / maxSize * viewSize);
+                    index === indices.length - 1 && exitWidth === 100
+                        || (
+                            resSize += sort === 'ascending' ? pieceHeight : -pieceHeight
+                        );
+                    const end = getLinePointsBySize(pos + pieceHeight, resSize / maxSize * viewSize);
+
+                    data.setItemLayout(idx, {
+                        points: start.concat(end.slice().reverse())
+                    });
+                    return;
                 }
-                else {
-                    height = parsePercent(height, viewHeight);
-                    if (sort === 'ascending') {
-                        height = -height;
-                    }
+                else if (dynamicArea) {
+                    const start = getLinePointsBySize(pos, pieceAreaTop);
+                    const end = getLinePointsBySize(pos + pieceHeight, pieceAreaBottom);
+
+                    data.setItemLayout(idx, {
+                        points: start.concat(end.slice().reverse())
+                    });
+                    return;
                 }
+                else if (showRate) {
+                    // data piece
+                    const dataStart = getLinePoints(idx, pos);
+                    let dataEnd;
+                    const val = data.get(valueDim, idx) as number || 0;
+                    if (exitWidth !== undefined && index === indices.length - 1) {

Review Comment:
   We usually use `!= null` instead of `!== undefined` to check both `null` and `undefined` values


##########
src/chart/funnel/FunnelView.ts:
##########
@@ -16,27 +16,98 @@
 * specific language governing permissions and limitations
 * under the License.
 */
-
+import * as zrUtil from 'zrender/src/core/util';
 import * as graphic from '../../util/graphic';
 import { setStatesStylesFromModel, toggleHoverEmphasis } from '../../util/states';
 import ChartView from '../../view/Chart';
 import FunnelSeriesModel, {FunnelDataItemOption} from './FunnelSeries';
 import GlobalModel from '../../model/Global';
 import ExtensionAPI from '../../core/ExtensionAPI';
 import SeriesData from '../../data/SeriesData';
-import { ColorString } from '../../util/types';
+import {
+    ColorString,
+    DisplayState,
+    InterpolatableValue,
+    SeriesDataType
+} from '../../util/types';
 import { setLabelLineStyle, getLabelLineStatesModels } from '../../label/labelGuideHelper';
 import { setLabelStyle, getLabelStatesModels } from '../../label/labelStyle';
 import { saveOldStyle } from '../../animation/basicTransition';

 const opacityAccessPath = ['itemStyle', 'opacity'] as const;

+const rateLabelFetcher = {
+    getFormattedLabel(
+        // In MapDraw case it can be string (region name)
+        labelDataIndex: number,
+        status: DisplayState,
+        dataType?: SeriesDataType,
+        labelDimIndex?: number,
+        formatter?: string | ((params: object) => string),
+        // If provided, the implementation of `getFormattedLabel` can use it
+        // to generate the final label text.
+        extendParams?: {
+            interpolatedValue: InterpolatableValue
+        }
+    ): string {
+        status = status || 'normal';
+        const { hostModel, layout } = this as unknown as { hostModel: FunnelSeriesModel, layout: any };
+        const data = hostModel.getData(dataType);
+
+        if (!formatter) {

Review Comment:
   `formatter` should be given in the params.


##########
src/chart/funnel/FunnelSeries.ts:
##########
@@ -95,6 +97,18 @@ export interface FunnelSeriesOption
     funnelAlign?: HorizontalAlign | VerticalAlign

     data?: (OptionDataValueNumeric | OptionDataValueNumeric[] | FunnelDataItemOption)[]
+
+    exitWidth?: string
+
+    showRate?: boolean
+
+    dynamicHeight?: boolean
+
+    /**
+     * @param rateFixed determine how much decimal places rate will keep
+     */
+
+    rateFixed?: number

Review Comment:
   It should be  `rateLabel.precision`. And rate should be a value that ranges from 0 to 1.


--
This is an automated message from the Apache Git Service.
To respond to the message, please log on to GitHub and use the
URL above to go to the specific comment.

To unsubscribe, e-mail: commits-unsubscribe@echarts.apache.org

For queries about this service, please contact Infrastructure at:
users@infra.apache.org


---------------------------------------------------------------------
To unsubscribe, e-mail: commits-unsubscribe@echarts.apache.org
For additional commands, e-mail: commits-help@echarts.apache.org
[GitHub] [echarts] pe-3 commented on a diff in pull request #17461: feat(funnel): add funnel new styles #14863
Posted by GitBox <gi...@apache.org>.
pe-3 commented on code in PR #17461:
URL: https://github.com/apache/echarts/pull/17461#discussion_r966581436


##########
src/chart/funnel/funnelLayout.ts:
##########
@@ -337,55 +427,156 @@ export default function funnelLayout(ecModel: GlobalModel, api: ExtensionAPI) {
             indices = indices.reverse();
         }

-        for (let i = 0; i < indices.length; i++) {
-            const idx = indices[i];
-            const nextIdx = indices[i + 1];
-            const itemModel = data.getItemModel<FunnelDataItemOption>(idx);
+        const valueSum = valueArr.reduce((pre, cur) => pre + cur);

-            if (orient === 'horizontal') {
-                let width = itemModel.get(['itemStyle', 'width']);
-                if (width == null) {
-                    width = itemSize;
+        const getSideLen = function (sideLen: number | string, idx?: number): number {
+            if (dynamicHeight) {
+                // in dy height, user can't set itemHeight or itemWidth
+                const val = data.get(valueDim, idx) as number || 0;
+                sideLen = linearMap(val, [0, valueSum], sizeExtent, true);
+                sideLen = sort === 'ascending' ? -sideLen : sideLen;
+                return sideLen;
+            }
+
+            if (sideLen == null) {
+                sideLen = itemSize;
+            }
+            else {
+                if (orient === 'horizontal') {
+                    sideLen = parsePercent(sideLen, viewWidth);
                 }
                 else {
-                    width = parsePercent(width, viewWidth);
-                    if (sort === 'ascending') {
-                        width = -width;
-                    }
+                    sideLen = parsePercent(sideLen, viewHeight);
                 }

-                const start = getLinePoints(idx, x);
-                const end = getLinePoints(nextIdx, x + width);
+                if (sort === 'ascending') {
+                    sideLen = -sideLen;
+                }
+            }
+            return sideLen;
+        };

-                x += width + gap;
+        const exitShape = seriesModel.get('exitShape');
+        let resSize = sizeExtent[1];
+        let maxSize = sizeExtent[1];
+        let exitWidth: string | number = seriesModel.get('exitWidth');

-                data.setItemLayout(idx, {
-                    points: start.concat(end.slice().reverse())
-                });
+        if (exitWidth) {
+            const percentReg = /^\w{1,2}\.{0,}\w{0,}%$/;
+            if (percentReg.test(exitWidth)) {
+                exitWidth = parseInt(exitWidth, 10);
+                resSize = maxSize = 100 * maxSize / (100 - exitWidth);
             }
             else {
-                let height = itemModel.get(['itemStyle', 'height']);
-                if (height == null) {
-                    height = itemSize;
-                }
-                else {
-                    height = parsePercent(height, viewHeight);
-                    if (sort === 'ascending') {
-                        height = -height;
+                throw new Error(`the exitWidth must be in percentage format and cannot be greater than 99%,
+                but you set it as '${exitWidth}'`);
+            }
+        }
+
+        const showRate = seriesModel.get('showRate');
+        let firstVal: number;
+        const setLayoutPoints =
+            // The subsequent funnel shape modification will be done in this func.
+            // We don’t need to concern direction when we use this function to set points.
+            function (
+                index: number,
+                idx: number,
+                nextIdx: number,
+                sideLen: number,
+                pos: number
+            ): void {
+                if (dynamicHeight) {
+                    const start = getLinePointsBySize(pos, resSize / maxSize * viewSize);
+                    let end;
+
+                    if (index === indices.length - 1 && exitShape === 'rect') {
+                        end = getLinePointsBySize(pos + sideLen, resSize / maxSize * viewSize);
+                    }
+                    else {
+                        resSize += sort === 'ascending' ? sideLen : -sideLen;
+                        end = getLinePointsBySize(pos + sideLen, resSize / maxSize * viewSize);
                     }
+
+                    data.setItemLayout(idx, {
+                        points: start.concat(end.slice().reverse())
+                    });
+                    return;
                 }
+                else if (showRate) {
+                    const dataStart = getLinePoints(idx, pos);
+                    let dataEnd;
+                    if (exitWidth !== undefined && index === indices.length - 1) {
+                        const val = data.get(valueDim, idx) as number || 0;
+                        const itemSize = linearMap(val, [min, max], sizeExtent, true);
+                        const exitSize = itemSize * (exitWidth as number) / 100;
+                        dataEnd = getLinePointsBySize(pos + sideLen / 2, exitSize);
+                    }
+                    else {
+                        dataEnd = getLinePoints(idx, pos + sideLen / 2);
+                    }
+                    const rateStart = getLinePoints(idx, pos + sideLen / 2);
+                    const rateEnd = getLinePoints(nextIdx, pos + sideLen);

-                const start = getLinePoints(idx, y);
-                const end = getLinePoints(nextIdx, y + height);
+                    const val = data.get(valueDim, idx) as number || 0;
+                    const nextVal = data.get(valueDim, nextIdx) as number || 0;
+                    let rate: number | string = nextVal / val;
+                    rate = 'Rate ' + (rate * 100).toFixed(0) + '%';
+                    if (index === 0) {
+                        firstVal = val;
+                    }
+                    else if (index === indices.length - 1) {
+                        const lastVal = val;
+                        rate = lastVal / firstVal;
+                        rate = 'Overall rate ' + (rate * 100).toFixed(0) + '%';

Review Comment:
   Rate formatter is different with label formatter, it has to concern previous and next, so it need a new label fetcher, so sorry, I can't implement this.


--
This is an automated message from the Apache Git Service.
To respond to the message, please log on to GitHub and use the
URL above to go to the specific comment.

To unsubscribe, e-mail: commits-unsubscribe@echarts.apache.org

For queries about this service, please contact Infrastructure at:
users@infra.apache.org


---------------------------------------------------------------------
To unsubscribe, e-mail: commits-unsubscribe@echarts.apache.org
For additional commands, e-mail: commits-help@echarts.apache.org
[GitHub] [echarts] pe-3 commented on a diff in pull request #17461: feat(funnel): add funnel new styles #14863
Posted by GitBox <gi...@apache.org>.
pe-3 commented on code in PR #17461:
URL: https://github.com/apache/echarts/pull/17461#discussion_r954478670


##########
src/chart/funnel/FunnelView.ts:
##########
@@ -167,8 +169,141 @@ class FunnelPiece extends graphic.Polygon {
             stroke: visualColor
         });
     }
+
+    ratePiece: RatePiece;
 }

+class RatePiece extends graphic.Polygon {
+
+    constructor(data: SeriesData, idx: number) {
+        super();
+
+        const polygon = this;
+        const labelLine = new graphic.Polyline();
+        const text = new graphic.Text();
+        polygon.setTextContent(text);
+        this.setTextGuideLine(labelLine);
+
+        this.updateData(data, idx, true);
+    }
+    updateData(data: SeriesData, idx: number, firstCreate?: boolean) {
+        const polygon = this;
+        const layout = data.getItemLayout(idx);
+        const seriesModel = data.hostModel;
+        let opacity: number;
+        if (layout.isLastPiece) {
+            opacity = 1;
+        }
+        else {
+            opacity = 0.5;
+        }
+
+        if (!firstCreate) {
+            saveOldStyle(polygon);
+        }
+
+        if (layout.isLastPiece) {
+            polygon.useStyle(Object.assign(data.getItemVisual(idx, 'style'), { fill: 'rgba(0,0,0,0)' }));
+        }
+        else {
+            polygon.useStyle(data.getItemVisual(idx, 'style'));
+        }
+
+        if (firstCreate) {
+            polygon.setShape({
+                points: layout.ratePoints
+            });
+            polygon.style.opacity = 0;
+            graphic.initProps(polygon, {
+                style: {
+                    opacity
+                }
+            }, seriesModel, idx);
+        }
+        else {
+            graphic.updateProps(polygon, {
+                style: {
+                    opacity
+                },
+                shape: {
+                    points: layout.ratePoints
+                }
+            }, seriesModel, idx);
+        }
+        this._updateLabel(data, idx);
+    }

Review Comment:
   OK


--
This is an automated message from the Apache Git Service.
To respond to the message, please log on to GitHub and use the
URL above to go to the specific comment.

To unsubscribe, e-mail: commits-unsubscribe@echarts.apache.org

For queries about this service, please contact Infrastructure at:
users@infra.apache.org


---------------------------------------------------------------------
To unsubscribe, e-mail: commits-unsubscribe@echarts.apache.org
For additional commands, e-mail: commits-help@echarts.apache.org
[GitHub] [echarts] pe-3 commented on a diff in pull request #17461: feat(funnel): add funnel new styles #14863
Posted by GitBox <gi...@apache.org>.
pe-3 commented on code in PR #17461:
URL: https://github.com/apache/echarts/pull/17461#discussion_r955861084


##########
src/chart/funnel/FunnelSeries.ts:
##########
@@ -94,7 +94,15 @@ export interface FunnelSeriesOption

     funnelAlign?: HorizontalAlign | VerticalAlign

+    exitShape?: 'rect' | 'none'
+
     data?: (OptionDataValueNumeric | OptionDataValueNumeric[] | FunnelDataItemOption)[]
+
+    dynamicHeight?: boolean
+
+    exitWidth?: string

Review Comment:
   Yes, I agree with you, my mistake, and I will correct it


--
This is an automated message from the Apache Git Service.
To respond to the message, please log on to GitHub and use the
URL above to go to the specific comment.

To unsubscribe, e-mail: commits-unsubscribe@echarts.apache.org

For queries about this service, please contact Infrastructure at:
users@infra.apache.org


---------------------------------------------------------------------
To unsubscribe, e-mail: commits-unsubscribe@echarts.apache.org
For additional commands, e-mail: commits-help@echarts.apache.org
[GitHub] [echarts] echarts-bot[bot] commented on pull request #17461: feat(funnel): add funnel new styles #14863
Posted by GitBox <gi...@apache.org>.
echarts-bot[bot] commented on PR #17461:
URL: https://github.com/apache/echarts/pull/17461#issuecomment-1296425830

   Congratulations! Your PR has been merged. Thanks for your contribution! 👍


--
This is an automated message from the Apache Git Service.
To respond to the message, please log on to GitHub and use the
URL above to go to the specific comment.

To unsubscribe, e-mail: commits-unsubscribe@echarts.apache.org

For queries about this service, please contact Infrastructure at:
users@infra.apache.org


---------------------------------------------------------------------
To unsubscribe, e-mail: commits-unsubscribe@echarts.apache.org
For additional commands, e-mail: commits-help@echarts.apache.org
[GitHub] [echarts] echarts-bot[bot] commented on pull request #17461: feat(funnel): set prop to flatten the funnel exit #14863
Posted by GitBox <gi...@apache.org>.
echarts-bot[bot] commented on PR #17461:
URL: https://github.com/apache/echarts/pull/17461#issuecomment-1202519372

   Thanks for your contribution!
   The community will review it ASAP. In the meanwhile, please checkout [the coding standard](https://echarts.apache.org/en/coding-standard.html) and Wiki about [How to make a pull request](https://github.com/apache/echarts/wiki/How-to-make-a-pull-request).

   Document changes are required in this PR. Please also make a PR to [apache/echarts-doc](https://github.com/apache/echarts-doc) for document changes and update the issue id in the PR description. When the doc PR is merged, the maintainers will remove the `PR: awaiting doc` label.


--
This is an automated message from the Apache Git Service.
To respond to the message, please log on to GitHub and use the
URL above to go to the specific comment.

To unsubscribe, e-mail: commits-unsubscribe@echarts.apache.org

For queries about this service, please contact Infrastructure at:
users@infra.apache.org


---------------------------------------------------------------------
To unsubscribe, e-mail: commits-unsubscribe@echarts.apache.org
For additional commands, e-mail: commits-help@echarts.apache.org
[GitHub] [echarts] Ovilia commented on a diff in pull request #17461: feat(funnel): add funnel new styles #14863
Posted by GitBox <gi...@apache.org>.
Ovilia commented on code in PR #17461:
URL: https://github.com/apache/echarts/pull/17461#discussion_r954783545


##########
src/chart/funnel/FunnelView.ts:
##########
@@ -167,8 +169,141 @@ class FunnelPiece extends graphic.Polygon {
             stroke: visualColor
         });
     }
+
+    ratePiece: RatePiece;
 }

+class RatePiece extends graphic.Polygon {
+
+    constructor(data: SeriesData, idx: number) {
+        super();
+
+        const polygon = this;
+        const labelLine = new graphic.Polyline();
+        const text = new graphic.Text();
+        polygon.setTextContent(text);
+        this.setTextGuideLine(labelLine);
+
+        this.updateData(data, idx, true);
+    }
+    updateData(data: SeriesData, idx: number, firstCreate?: boolean) {
+        const polygon = this;
+        const layout = data.getItemLayout(idx);
+        const seriesModel = data.hostModel;
+        let opacity: number;
+        if (layout.isLastPiece) {
+            opacity = 1;
+        }
+        else {
+            opacity = 0.5;
+        }
+
+        if (!firstCreate) {
+            saveOldStyle(polygon);
+        }
+
+        if (layout.isLastPiece) {
+            polygon.useStyle(Object.assign(data.getItemVisual(idx, 'style'), { fill: 'rgba(0,0,0,0)' }));

Review Comment:
   You can probably use `'none'`.


--
This is an automated message from the Apache Git Service.
To respond to the message, please log on to GitHub and use the
URL above to go to the specific comment.

To unsubscribe, e-mail: commits-unsubscribe@echarts.apache.org

For queries about this service, please contact Infrastructure at:
users@infra.apache.org


---------------------------------------------------------------------
To unsubscribe, e-mail: commits-unsubscribe@echarts.apache.org
For additional commands, e-mail: commits-help@echarts.apache.org
[GitHub] [echarts] pe-3 commented on a diff in pull request #17461: feat(funnel): add funnel new styles #14863
Posted by GitBox <gi...@apache.org>.
pe-3 commented on code in PR #17461:
URL: https://github.com/apache/echarts/pull/17461#discussion_r954478604


##########
src/chart/funnel/FunnelView.ts:
##########
@@ -167,8 +169,141 @@ class FunnelPiece extends graphic.Polygon {
             stroke: visualColor
         });
     }
+
+    ratePiece: RatePiece;
 }

+class RatePiece extends graphic.Polygon {
+
+    constructor(data: SeriesData, idx: number) {
+        super();
+
+        const polygon = this;
+        const labelLine = new graphic.Polyline();
+        const text = new graphic.Text();
+        polygon.setTextContent(text);
+        this.setTextGuideLine(labelLine);
+
+        this.updateData(data, idx, true);
+    }
+    updateData(data: SeriesData, idx: number, firstCreate?: boolean) {
+        const polygon = this;
+        const layout = data.getItemLayout(idx);
+        const seriesModel = data.hostModel;
+        let opacity: number;
+        if (layout.isLastPiece) {
+            opacity = 1;
+        }
+        else {
+            opacity = 0.5;
+        }
+
+        if (!firstCreate) {
+            saveOldStyle(polygon);
+        }
+
+        if (layout.isLastPiece) {
+            polygon.useStyle(Object.assign(data.getItemVisual(idx, 'style'), { fill: 'rgba(0,0,0,0)' }));

Review Comment:
   I want make overAll rate piece a transparent one.


--
This is an automated message from the Apache Git Service.
To respond to the message, please log on to GitHub and use the
URL above to go to the specific comment.

To unsubscribe, e-mail: commits-unsubscribe@echarts.apache.org

For queries about this service, please contact Infrastructure at:
users@infra.apache.org


---------------------------------------------------------------------
To unsubscribe, e-mail: commits-unsubscribe@echarts.apache.org
For additional commands, e-mail: commits-help@echarts.apache.org
[GitHub] [echarts] pe-3 commented on a diff in pull request #17461: feat(funnel): add funnel new styles #14863
Posted by GitBox <gi...@apache.org>.
pe-3 commented on code in PR #17461:
URL: https://github.com/apache/echarts/pull/17461#discussion_r950988393


##########
src/chart/funnel/funnelLayout.ts:
##########
@@ -337,55 +427,156 @@ export default function funnelLayout(ecModel: GlobalModel, api: ExtensionAPI) {
             indices = indices.reverse();
         }

-        for (let i = 0; i < indices.length; i++) {
-            const idx = indices[i];
-            const nextIdx = indices[i + 1];
-            const itemModel = data.getItemModel<FunnelDataItemOption>(idx);
+        const valueSum = valueArr.reduce((pre, cur) => pre + cur);

-            if (orient === 'horizontal') {
-                let width = itemModel.get(['itemStyle', 'width']);
-                if (width == null) {
-                    width = itemSize;
+        const getSideLen = function (sideLen: number | string, idx?: number): number {
+            if (dynamicHeight) {
+                // in dy height, user can't set itemHeight or itemWidth
+                const val = data.get(valueDim, idx) as number || 0;
+                sideLen = linearMap(val, [0, valueSum], sizeExtent, true);
+                sideLen = sort === 'ascending' ? -sideLen : sideLen;
+                return sideLen;
+            }
+
+            if (sideLen == null) {
+                sideLen = itemSize;
+            }
+            else {
+                if (orient === 'horizontal') {
+                    sideLen = parsePercent(sideLen, viewWidth);
                 }
                 else {
-                    width = parsePercent(width, viewWidth);
-                    if (sort === 'ascending') {
-                        width = -width;
-                    }
+                    sideLen = parsePercent(sideLen, viewHeight);
                 }

-                const start = getLinePoints(idx, x);
-                const end = getLinePoints(nextIdx, x + width);
+                if (sort === 'ascending') {
+                    sideLen = -sideLen;
+                }
+            }
+            return sideLen;
+        };

-                x += width + gap;
+        const exitShape = seriesModel.get('exitShape');
+        let resSize = sizeExtent[1];
+        let maxSize = sizeExtent[1];
+        let exitWidth: string | number = seriesModel.get('exitWidth');

-                data.setItemLayout(idx, {
-                    points: start.concat(end.slice().reverse())
-                });
+        if (exitWidth) {
+            const percentReg = /^\w{1,2}\.{0,}\w{0,}%$/;
+            if (percentReg.test(exitWidth)) {
+                exitWidth = parseInt(exitWidth, 10);
+                resSize = maxSize = 100 * maxSize / (100 - exitWidth);
             }
             else {
-                let height = itemModel.get(['itemStyle', 'height']);
-                if (height == null) {
-                    height = itemSize;
-                }
-                else {
-                    height = parsePercent(height, viewHeight);
-                    if (sort === 'ascending') {
-                        height = -height;
+                throw new Error(`the exitWidth must be in percentage format and cannot be greater than 99%,
+                but you set it as '${exitWidth}'`);
+            }
+        }
+
+        const showRate = seriesModel.get('showRate');
+        let firstVal: number;
+        const setLayoutPoints =
+            // The subsequent funnel shape modification will be done in this func.
+            // We don’t need to concern direction when we use this function to set points.
+            function (
+                index: number,
+                idx: number,
+                nextIdx: number,
+                sideLen: number,
+                pos: number
+            ): void {
+                if (dynamicHeight) {
+                    const start = getLinePointsBySize(pos, resSize / maxSize * viewSize);
+                    let end;
+
+                    if (index === indices.length - 1 && exitShape === 'rect') {
+                        end = getLinePointsBySize(pos + sideLen, resSize / maxSize * viewSize);
+                    }
+                    else {
+                        resSize += sort === 'ascending' ? sideLen : -sideLen;
+                        end = getLinePointsBySize(pos + sideLen, resSize / maxSize * viewSize);
                     }
+
+                    data.setItemLayout(idx, {
+                        points: start.concat(end.slice().reverse())
+                    });
+                    return;
                 }
+                else if (showRate) {
+                    const dataStart = getLinePoints(idx, pos);
+                    let dataEnd;
+                    if (exitWidth !== undefined && index === indices.length - 1) {
+                        const val = data.get(valueDim, idx) as number || 0;
+                        const itemSize = linearMap(val, [min, max], sizeExtent, true);
+                        const exitSize = itemSize * (exitWidth as number) / 100;
+                        dataEnd = getLinePointsBySize(pos + sideLen / 2, exitSize);
+                    }
+                    else {
+                        dataEnd = getLinePoints(idx, pos + sideLen / 2);
+                    }
+                    const rateStart = getLinePoints(idx, pos + sideLen / 2);
+                    const rateEnd = getLinePoints(nextIdx, pos + sideLen);

-                const start = getLinePoints(idx, y);
-                const end = getLinePoints(nextIdx, y + height);
+                    const val = data.get(valueDim, idx) as number || 0;
+                    const nextVal = data.get(valueDim, nextIdx) as number || 0;
+                    let rate: number | string = nextVal / val;
+                    rate = 'Rate ' + (rate * 100).toFixed(0) + '%';
+                    if (index === 0) {
+                        firstVal = val;
+                    }
+                    else if (index === indices.length - 1) {
+                        const lastVal = val;
+                        rate = lastVal / firstVal;
+                        rate = 'Overall rate ' + (rate * 100).toFixed(0) + '%';
+                    }

-                y += height + gap;
+                    data.setItemLayout(idx, {
+                        points: dataStart.concat(dataEnd.slice().reverse()),
+                        ratePoints: rateStart.concat(rateEnd.slice().reverse()),
+                        isLastPiece: index === indices.length - 1,
+                        rate
+                    });
+                    return;
+                }
+                const start = getLinePoints(idx, pos);
+                let end;
+
+                if (index === indices.length - 1 && exitShape === 'rect') {
+                    end = getLinePoints(idx, pos + sideLen);

Review Comment:
   Ok, I will fix code styles what you say 😁


--
This is an automated message from the Apache Git Service.
To respond to the message, please log on to GitHub and use the
URL above to go to the specific comment.

To unsubscribe, e-mail: commits-unsubscribe@echarts.apache.org

For queries about this service, please contact Infrastructure at:
users@infra.apache.org


---------------------------------------------------------------------
To unsubscribe, e-mail: commits-unsubscribe@echarts.apache.org
For additional commands, e-mail: commits-help@echarts.apache.org
[GitHub] [echarts] Ovilia commented on pull request #17461: feat(funnel): add funnel new styles #14863
Posted by GitBox <gi...@apache.org>.
Ovilia commented on PR #17461:
URL: https://github.com/apache/echarts/pull/17461#issuecomment-1281850957

   Please also update the visual test case by recording the changes of the GUI to test different cases.

   1. `npm run test:visual`
   2. Select `funnel.html` and click `Record Interaction`
   3. Click `New` at the top-right corner and press `ALT + R` to record
   4. Change the values in the GUI and `ALT + R` to stop
   5. Commit the changes in `test/runTest/actions`


--
This is an automated message from the Apache Git Service.
To respond to the message, please log on to GitHub and use the
URL above to go to the specific comment.

To unsubscribe, e-mail: commits-unsubscribe@echarts.apache.org

For queries about this service, please contact Infrastructure at:
users@infra.apache.org


---------------------------------------------------------------------
To unsubscribe, e-mail: commits-unsubscribe@echarts.apache.org
For additional commands, e-mail: commits-help@echarts.apache.org
[GitHub] [echarts] Ovilia commented on pull request #17461: feat(funnel): add funnel new styles #14863
Posted by GitBox <gi...@apache.org>.
Ovilia commented on PR #17461:
URL: https://github.com/apache/echarts/pull/17461#issuecomment-1225128541

   Please update the descript of this PR to add the overall changes of options.


--
This is an automated message from the Apache Git Service.
To respond to the message, please log on to GitHub and use the
URL above to go to the specific comment.

To unsubscribe, e-mail: commits-unsubscribe@echarts.apache.org

For queries about this service, please contact Infrastructure at:
users@infra.apache.org


---------------------------------------------------------------------
To unsubscribe, e-mail: commits-unsubscribe@echarts.apache.org
For additional commands, e-mail: commits-help@echarts.apache.org
[GitHub] [echarts] pe-3 commented on a diff in pull request #17461: feat(funnel): add funnel new styles #14863
Posted by GitBox <gi...@apache.org>.
pe-3 commented on code in PR #17461:
URL: https://github.com/apache/echarts/pull/17461#discussion_r955860371


##########
src/chart/funnel/FunnelView.ts:
##########
@@ -167,8 +169,141 @@ class FunnelPiece extends graphic.Polygon {
             stroke: visualColor
         });
     }
+
+    ratePiece: RatePiece;
 }

+class RatePiece extends graphic.Polygon {
+
+    constructor(data: SeriesData, idx: number) {
+        super();
+
+        const polygon = this;
+        const labelLine = new graphic.Polyline();
+        const text = new graphic.Text();
+        polygon.setTextContent(text);
+        this.setTextGuideLine(labelLine);
+
+        this.updateData(data, idx, true);
+    }
+    updateData(data: SeriesData, idx: number, firstCreate?: boolean) {
+        const polygon = this;
+        const layout = data.getItemLayout(idx);
+        const seriesModel = data.hostModel;
+        let opacity: number;
+        if (layout.isLastPiece) {
+            opacity = 1;
+        }
+        else {
+            opacity = 0.5;
+        }
+
+        if (!firstCreate) {
+            saveOldStyle(polygon);
+        }
+
+        if (layout.isLastPiece) {
+            polygon.useStyle(Object.assign(data.getItemVisual(idx, 'style'), { fill: 'rgba(0,0,0,0)' }));

Review Comment:
   ok


--
This is an automated message from the Apache Git Service.
To respond to the message, please log on to GitHub and use the
URL above to go to the specific comment.

To unsubscribe, e-mail: commits-unsubscribe@echarts.apache.org

For queries about this service, please contact Infrastructure at:
users@infra.apache.org


---------------------------------------------------------------------
To unsubscribe, e-mail: commits-unsubscribe@echarts.apache.org
For additional commands, e-mail: commits-help@echarts.apache.org