You are viewing a plain text version of this content. The canonical link for it is here.
Posted to notifications@apisix.apache.org by GitBox <gi...@apache.org> on 2021/09/27 07:23:05 UTC
[GitHub] [apisix] zhendongcmss opened a new issue #5146: bug: Prometheus http latency sum is nagative
zhendongcmss opened a new issue #5146:
URL: https://github.com/apache/apisix/issues/5146
### Issue description
**Description**
In the Cluster, we foud `apisix_http_latency_count` is negative sometimes. we add `code `and `method ` value on the metrices.latency based on community code. I’m not sure if it’s caused by this. I search "latency" on the issues list and didn't find userful message.
**Our code:apisix/plugins/prometheus/exporter.lua**
```lua line:105
metrics.latency = prometheus:histogram("http_latency",
"HTTP request latency in milliseconds per service in APISIX",
{"type","code", "method", "route", "service", "consumer", "node"}, DEFAULT_BUCKETS)
...
local latency = (ngx.now() - ngx.req.start_time()) * 1000
metrics.latency:observe(latency,
gen_arr("request", vars.status, method_id, route_id, service_id, consumer_name, balancer_ip))
local apisix_latency = latency
if ctx.var.upstream_response_time then
local upstream_latency = ctx.var.upstream_response_time * 1000
metrics.latency:observe(upstream_latency,
gen_arr("upstream", vars.status, method_id, route_id, service_id, consumer_name, balancer_ip))
apisix_latency = apisix_latency - upstream_latency
end
metrics.latency:observe(apisix_latency,
gen_arr("apisix", vars.status, method_id, route_id, service_id, consumer_name, balancer_ip))
code file: https://gist.github.com/zhendongcmss/994e1a667f8892e844e6531be5cfac2b
```
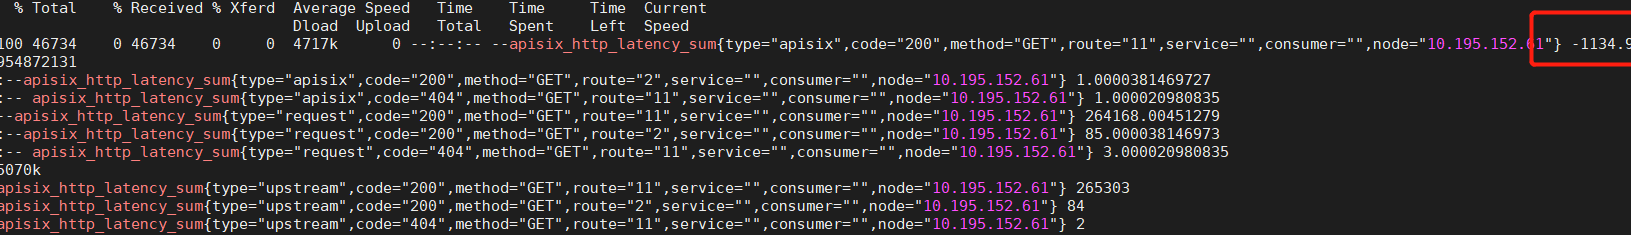
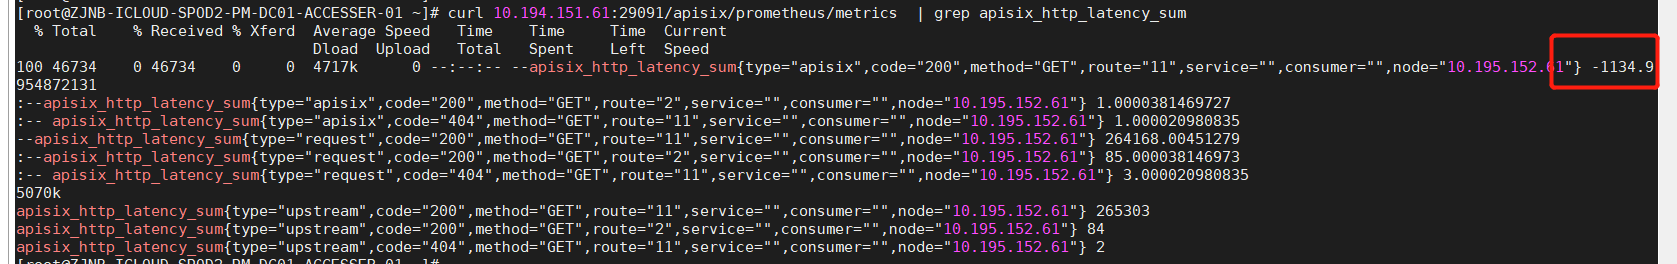
**curl http://127.0.0.1:29091/apisix/prometheus/metrics | grep 404**
```
apisix_http_latency_bucket{type="upstream",code="404",method="GET",route="11",service="",consumer="",node="10.195.152.61",le="+Inf"} 1
apisix_http_latency_count{type="apisix",code="404",method="GET",route="11",service="",consumer="",node="10.195.152.61"} 1
apisix_http_latency_count{type="request",code="404",method="GET",route="11",service="",consumer="",node="10.195.152.61"} 1
apisix_http_latency_count{type="upstream",code="404",method="GET",route="11",service="",consumer="",node="10.195.152.61"} 1
apisix_http_latency_sum{type="apisix",code="404",method="GET",route="11",service="",consumer="",node="10.195.152.61"} -1.0000114440918
apisix_http_latency_sum{type="request",code="404",method="GET",route="11",service="",consumer="",node="10.195.152.61"} 111.99998855591
apisix_http_latency_sum{type="upstream",code="404",method="GET",route="11",service="",consumer="",node="10.195.152.61"} 113
```
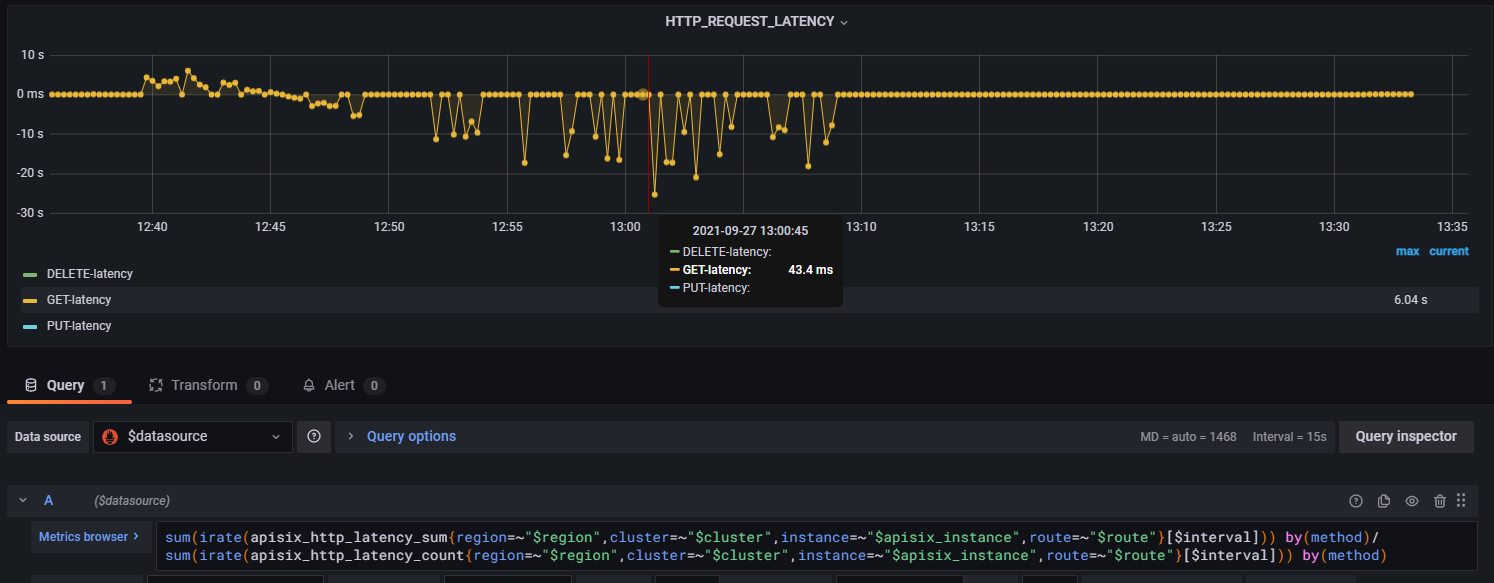
**Grafana dashboard**
### Environment
- apisix version (cmd: `apisix version`): 2.7
- OS (cmd: `uname -a`): Linux ZJNB-ICLOUD-SPOD2-PM-DC01-ACCESSER-01 4.19.25-200.el7.bclinux.x86_64 SMP Wed May 29 00:02:44 CST 2019 x86_64 x86_64 x86_64 GNU/Linux (based centos 7.6)
- OpenResty / Nginx version (cmd: `nginx -V` or `openresty -V`):
```
nginx version: openresty/1.19.3.2
built by gcc 9.3.1 20200408 (Red Hat 9.3.1-2) (GCC)
built with OpenSSL 1.1.1k 25 Mar 2021 (running with OpenSSL 1.1.1h 22 Sep 2020)
TLS SNI support enabled
configure arguments: --prefix=/usr/local/openresty/nginx --with-cc-opt='-O2 -DNGX_LUA_ABORT_AT_PANIC -I/usr/local/openresty/zlib/include -I/usr/local/openresty/pcre/include -I/usr/local/openresty/openssl111/include' --add-module=../ngx_devel_kit-0.3.1 --add-module=../echo-nginx-module-0.62 --add-module=../xss-nginx-module-0.06 --add-module=../ngx_coolkit-0.2 --add-module=../set-misc-nginx-module-0.32 --add-module=../form-input-nginx-module-0.12 --add-module=../encrypted-session-nginx-module-0.08 --add-module=../srcache-nginx-module-0.32 --add-module=../ngx_lua-0.10.19 --add-module=../ngx_lua_upstream-0.07 --add-module=../headers-more-nginx-module-0.33 --add-module=../array-var-nginx-module-0.05 --add-module=../memc-nginx-module-0.19 --add-module=../redis2-nginx-module-0.15 --add-module=../redis-nginx-module-0.3.7 --add-module=../ngx_stream_lua-0.0.9 --with-ld-opt='-Wl,-rpath,/usr/local/openresty/luajit/lib -L/usr/local/openresty/zlib/lib -L/usr/local/openresty/pcre/lib -L/usr/loca
l/openresty/openssl111/lib -Wl,-rpath,/usr/local/openresty/zlib/lib:/usr/local/openresty/pcre/lib:/usr/local/openresty/openssl111/lib' --with-cc='ccache gcc -fdiagnostics-color=always' --with-pcre-jit --with-stream --with-stream_ssl_module --with-stream_ssl_preread_module --with-http_v2_module --without-mail_pop3_module --without-mail_imap_module --without-mail_smtp_module --with-http_stub_status_module --with-http_realip_module --with-http_addition_module --with-http_auth_request_module --with-http_secure_link_module --with-http_random_index_module --with-http_gzip_static_module --with-http_sub_module --with-http_dav_module --with-http_flv_module --with-http_mp4_module --with-http_gunzip_module --with-threads --with-compat --with-stream --with-http_ssl_module
```
- etcd version, if have (cmd: run `curl http://127.0.0.1:9090/v1/server_info` to get the info from server-info API):
- apisix-dashboard version, if have:
- the plugin runner version, if the issue is about a plugin runner (cmd: depended on the kind of runner):
- luarocks version, if the issue is about installation (cmd: `luarocks --version`):
### Steps to reproduce
1. Config global rules
```
{
"node":{
"dir":true,
"nodes":[
{
"createdIndex":1280,
"value":{
"id":"1",
"update_time":1632448084,
"plugins":{
"prometheus":{
"prefer_name":false
},
"request-id":{
"header_name":"x-request-id",
"include_in_response":true
},
"limit-conn":{
"conn":1000000,
"key":"constant",
"burst":0,
"rejected_code":503,
"default_conn_delay":0.1
},
"http-logger":{
"use_tcp_transmission":true,
"concat_method":"new_line",
"send_prometheus_data":false,
"batch_max_size":1,
"auth_header":"",
"include_req_body":false,
"max_retry_count":0,
"name":"http logger",
"timeout":3,
"retry_delay":1,
"buffer_duration":60,
"inactive_timeout":5,
"uri":"http://10.195.152.61:15151"
}
},
"create_time":1630833580
},
"key":"/apisix-ZJNB-ICLOUD-SPOD2-PM-DC01-ACCESSER-01/global_rules/1",
"modifiedIndex":491489
}
],
"key":"/apisix-ZJNB-ICLOUD-SPOD2-PM-DC01-ACCESSER-01/global_rules"
},
"count":"2",
"action":"get"
}
2. Use the modified expolter.lua https://gist.github.com/zhendongcmss/994e1a667f8892e844e6531be5cfac2b
```
### Actual result
No call stack
### Error log
Don't find prometheus logs in access.log and error.log
### Expected result
_No response_
--
This is an automated message from the Apache Git Service.
To respond to the message, please log on to GitHub and use the
URL above to go to the specific comment.
To unsubscribe, e-mail: notifications-unsubscribe@apisix.apache.org
For queries about this service, please contact Infrastructure at:
users@infra.apache.org
[GitHub] [apisix] zhendongcmss commented on issue #5146: bug: Prometheus http latency sum is nagative
Posted by GitBox <gi...@apache.org>.
zhendongcmss commented on issue #5146:
URL: https://github.com/apache/apisix/issues/5146#issuecomment-927625603


   > Is there any difference between routes whose latency are negative and those aren't?

   We have many routes. we config the prometheus plugin on the global rules. The prometheus metrics print the route id on each item. It is a good question. I found negative sum mostly on the route id is 11 and 12. I don't this issue on other route until now.


   ```
   apisix_http_latency_sum{type="apisix",code="200",method="GET",route="11",service="",consumer="",node="10.195.152.61"} -155.00492858887
   apisix_http_latency_sum{type="apisix",code="200",method="HEAD",route="13",service="",consumer="",node="10.195.152.61"} 1.0000629425049
   apisix_http_latency_sum{type="apisix",code="200",method="PUT",route="12",service="",consumer="",node="10.195.152.61"} 82853.992879868
   apisix_http_latency_sum{type="apisix",code="204",method="DELETE",route="13",service="",consumer="",node="10.195.152.61"} 88.995412826538
   apisix_http_latency_sum{type="apisix",code="400",method="PUT",route="12",service="",consumer="",node="10.195.152.61"} -8.392333984375e-05

   ```


--
This is an automated message from the Apache Git Service.
To respond to the message, please log on to GitHub and use the
URL above to go to the specific comment.

To unsubscribe, e-mail: notifications-unsubscribe@apisix.apache.org

For queries about this service, please contact Infrastructure at:
users@infra.apache.org
[GitHub] [apisix] zhendongcmss edited a comment on issue #5146: bug: Prometheus plugin metrics http latency sum is negative
Posted by GitBox <gi...@apache.org>.
zhendongcmss edited a comment on issue #5146:
URL: https://github.com/apache/apisix/issues/5146#issuecomment-928933666


   Facts proved `ngx.update_time()` doesn't work.
   ```
   @@ -150,12 +150,17 @@ function _M.log(conf, ctx)
        metrics.latency:observe(latency,
            gen_arr("request", vars.status, method_id, route_id, service_id, consumer_name, balancer_ip))

   +    ngx.update_time()
        local apisix_latency = latency
        if ctx.var.upstream_response_time then
            local upstream_latency = ctx.var.upstream_response_time * 1000
            metrics.latency:observe(upstream_latency,
                gen_arr("upstream", vars.status, method_id, route_id, service_id, consumer_name, balancer_ip))
            apisix_latency =  apisix_latency - upstream_latency
   +        if apisix_latency < 0 then
   +            ngx.log(ngx.EMERG, "123456789","latency now ", ngx.now(), ", start_time: ", ngx.req.start_time(), ", upstream: ",
   +            ctx.var.upstream_response_time)
   +        end
   ```


--
This is an automated message from the Apache Git Service.
To respond to the message, please log on to GitHub and use the
URL above to go to the specific comment.

To unsubscribe, e-mail: notifications-unsubscribe@apisix.apache.org

For queries about this service, please contact Infrastructure at:
users@infra.apache.org
[GitHub] [apisix] zhendongcmss edited a comment on issue #5146: bug: Prometheus plugin metrics http latency sum is negative
Posted by GitBox <gi...@apache.org>.
zhendongcmss edited a comment on issue #5146:
URL: https://github.com/apache/apisix/issues/5146#issuecomment-927637505


   > Maybe we can add:
   >
   > ```
   > diff --git apisix/plugins/prometheus/exporter.lua apisix/plugins/prometheus/exporter.lua
   > index ea1c4843..4a8ec64e 100644
   > --- apisix/plugins/prometheus/exporter.lua
   > +++ apisix/plugins/prometheus/exporter.lua
   > @@ -153,6 +153,10 @@ function _M.log(conf, ctx)
   >          metrics.latency:observe(upstream_latency,
   >              gen_arr("upstream", route_id, service_id, consumer_name, balancer_ip))
   >          apisix_latency =  apisix_latency - upstream_latency
   > +        if apisix_latency < 0 then
   > +            ngx.log(ngx.EMERG, "latency now ", ngx.now(), ", start_time: ", ngx.req.start_time(), ", upstream: ",
   > +                    ctx.var.upstream_response_time)
   > +        end
   >      end
   >      metrics.latency:observe(apisix_latency,
   >          gen_arr("apisix", route_id, service_id, consumer_name, balancer_ip))
   > ```
   >
   > to see each value of the items.

   **Got the error.log**


   **tailf /var/log/balancer/error.log | grep start_time**
   ```
   [root@ZJNB-ICLOUD-SPOD2-PM-DC01-ACCESSER-01 ~]# tailf /var/log/balancer/error.log | grep start_time
   2021/09/27 08:10:31 [emerg] 57#57: *46261 [lua] exporter.lua:161: phase_func(): latency now 1632730231.246, start_time: 1632730231.203, upstream: 0.043 while logging request, client: 10.195.158.10, server: _, request: "GET / HTTP/1.0", upstream: "http://10.195.152.61:8085/", host: "10.9080"
   2021/09/27 08:10:31 [emerg] 50#50: *35769 [lua] exporter.lua:161: phase_func(): latency now 1632730231.622, start_time: 1632730231.288, upstream: 0.334 while logging request, client: 10.195.158.13, server: _, request: "PUT /tb3/file_tttsMM42626 HTTP/1.1", upstream: "http://10.195.152.61:8081/tb3/file_tttsMM42626", host: "10.195.156.10"
   2021/09/27 08:10:31 [emerg] 50#50: *46882 [lua] exporter.lua:161: phase_func(): latency now 1632730231.906, start_time: 1632730231.863, upstream: 0.043 while logging request, client: 10.195.158.20, server: _, request: "GET / HTTP/1.0", upstream: "http://10.195.152.61:8078/", host: "10.1:9080"
   2021/09/27 08:10:31 [emerg] 76#76: *46898 [lua] exporter.lua:161: phase_func(): latency now 1632730231.932, start_time: 1632730231.89, upstream: 0.042 while logging request, client: 10.195.158.10, server: _, request: "GET / HTTP/1.0", upstream: "http://101:8079/", host: "onest-pgy.cmecloud.cn"
   2021/09/27 08:10:31 [emerg] 67#67: *46897 [lua] exporter.lua:161: phase_func(): latency now 1632730231.934, start_time: 1632730231.89, upstream: 0.044 while logging request, client: 10.195.158.10, server: _, request: "GET / HTTP/1.0", upstream: "http://11:8079/", host: "onest-pgy.cmecloud.cn"
   2021/09/27 08:10:32 [emerg] 59#59: *47115 [lua] exporter.lua:161: phase_func(): latency now 1632730232.227, start_time: 1632730232.184, upstream: 0.043 while logging request, client: 10.195.158.10, server: _, request: "GET / HTTP/1.0", upstream: "http://11:8084/", host: "onest-pgy.cmecloud.cn"
   2021/09/27 08:10:32 [emerg] 59#59: *47138 [lua] exporter.lua:161: phase_func(): latency now 1632730232.276, start_time: 1632730232.233, upstream: 0.044 while logging request, client: 10.195.158.10, server: _, request: "GET / HTTP/1.0", upstream: "http://101:8080/", host: "10.19:9080"
   2021/09/27 08:10:32 [emerg] 67#67: *47321 [lua] exporter.lua:161: phase_func(): latency now 1632730232.449, start_time: 1632730232.405, upstream: 0.044 while logging request, client: 10.195.158.20, server: _, request: "GET / HTTP/1.0", upstream: "http://101:8084/", host: "10.61:9080"


   ```


--
This is an automated message from the Apache Git Service.
To respond to the message, please log on to GitHub and use the
URL above to go to the specific comment.

To unsubscribe, e-mail: notifications-unsubscribe@apisix.apache.org

For queries about this service, please contact Infrastructure at:
users@infra.apache.org
[GitHub] [apisix] spacewander commented on issue #5146: bug: Prometheus plugin metrics http latency sum is negative
Posted by GitBox <gi...@apache.org>.
spacewander commented on issue #5146:
URL: https://github.com/apache/apisix/issues/5146#issuecomment-928896672


   @leslie-tsang
   Please read the link given by @zhendongcmss. The problem is not about the cached time.


--
This is an automated message from the Apache Git Service.
To respond to the message, please log on to GitHub and use the
URL above to go to the specific comment.

To unsubscribe, e-mail: notifications-unsubscribe@apisix.apache.org

For queries about this service, please contact Infrastructure at:
users@infra.apache.org
[GitHub] [apisix] spacewander commented on issue #5146: bug: Prometheus plugin metrics http latency sum is negative
Posted by GitBox <gi...@apache.org>.
spacewander commented on issue #5146:
URL: https://github.com/apache/apisix/issues/5146#issuecomment-928919399


   For somebody who doesn't read the link, here is Maxim Dounin's answer:

   > This is because now on Linux $upstream_response_time
   is counted via clock_gettime(CLOCK_MONOTONIC_COARSE), and with
   typical values of CONFIG_HZ=250, it may be up to 4
   milliseconds. At the same time, the time to calculate $request_time
   is not a monotonous time, but the result of gettimeofday(), i.e.
   that is, the time according to the wall clock. So in some cases
   $upstream_response_time may be slightly larger than
   $request_time.

   https://forum.nginx.org/read.php?21,284448,284450#msg-284450

   Here is part of my letter sent to Nginx devel mail list this morning, which also give other details:

   > Currently, the request_time uses ngx_timeofday to get the time, which
   finally will call gettimeofday. Meanwhile, the upstream_x_time series
   uses ngx_current_msec to calculate the time, which finally will call
   ngx_monotonic_time.
   >
   > On Linux, the gettimeofday will call clock_gettime(CLOCK_REALTIME,
   &ts) while the ngx_monotonic_time will call
   clock_gettime(CLOCK_MONOTONIC_COARSE, &ts).
   >
   > So the request_time uses CLOCK_REALTIME and the upstream_x_time series
   uses CLOCK_MONOTONIC_COARSE. As they are different sources,


--
This is an automated message from the Apache Git Service.
To respond to the message, please log on to GitHub and use the
URL above to go to the specific comment.

To unsubscribe, e-mail: notifications-unsubscribe@apisix.apache.org

For queries about this service, please contact Infrastructure at:
users@infra.apache.org
[GitHub] [apisix] spacewander closed issue #5146: bug: Prometheus plugin metrics http latency sum is negative
Posted by GitBox <gi...@apache.org>.
spacewander closed issue #5146:
URL: https://github.com/apache/apisix/issues/5146


--
This is an automated message from the Apache Git Service.
To respond to the message, please log on to GitHub and use the
URL above to go to the specific comment.

To unsubscribe, e-mail: notifications-unsubscribe@apisix.apache.org

For queries about this service, please contact Infrastructure at:
users@infra.apache.org
[GitHub] [apisix] zhendongcmss commented on issue #5146: bug: Prometheus plugin metrics http latency sum is negative
Posted by GitBox <gi...@apache.org>.
zhendongcmss commented on issue #5146:
URL: https://github.com/apache/apisix/issues/5146#issuecomment-928933666
Facts proved `ngx.update_time()` doesn't work.
```
@@ -150,12 +150,17 @@ function _M.log(conf, ctx)
metrics.latency:observe(latency,
gen_arr("request", vars.status, method_id, route_id, service_id, consumer_name, balancer_ip))
+ ngx.update_time()
local apisix_latency = latency
if ctx.var.upstream_response_time then
local upstream_latency = ctx.var.upstream_response_time * 1000
metrics.latency:observe(upstream_latency,
gen_arr("upstream", vars.status, method_id, route_id, service_id, consumer_name, balancer_ip))
apisix_latency = apisix_latency - upstream_latency
+ if apisix_latency < 0 then
+ ngx.log(ngx.EMERG, "123456789","latency now ", ngx.now(), ", start_time: ", ngx.req.start_time(), ", upstream: ",
+ ctx.var.upstream_response_time)
+ end
```

--
This is an automated message from the Apache Git Service.
To respond to the message, please log on to GitHub and use the
URL above to go to the specific comment.
To unsubscribe, e-mail: notifications-unsubscribe@apisix.apache.org
For queries about this service, please contact Infrastructure at:
users@infra.apache.org
[GitHub] [apisix] zhendongcmss edited a comment on issue #5146: bug: Prometheus http latency sum is nagative
Posted by GitBox <gi...@apache.org>.
zhendongcmss edited a comment on issue #5146:
URL: https://github.com/apache/apisix/issues/5146#issuecomment-927609958


   I Investigation:
   1. The value is negative  only when  **type="apisix",** so `gen_arr("apisix", vars.status, method_id, route_id, service_id, consumer_name, balancer_ip)) `  has bug. from the code `apisix_latency =  apisix_latency - upstream_latency`, I don't sure `apisix_latency` is large then `upstream_latency`
   2. I found that some nodes' time is inaccurate  and doesn't configrate NTP. so I think that  `local latency = (ngx.now() - ngx.req.start_time()) * 1000` ngx.now() get the system local time ?


--
This is an automated message from the Apache Git Service.
To respond to the message, please log on to GitHub and use the
URL above to go to the specific comment.

To unsubscribe, e-mail: notifications-unsubscribe@apisix.apache.org

For queries about this service, please contact Infrastructure at:
users@infra.apache.org
[GitHub] [apisix] zhendongcmss edited a comment on issue #5146: bug: Prometheus http latency sum is nagative
Posted by GitBox <gi...@apache.org>.
zhendongcmss edited a comment on issue #5146:
URL: https://github.com/apache/apisix/issues/5146#issuecomment-927609958


   I Investigation:
   1. The value is negative  only when  **type="apisix",** so `gen_arr("apisix", vars.status, method_id, route_id, service_id, consumer_name, balancer_ip)) `  has bug. from the code `apisix_latency =  apisix_latency - upstream_latency`, I don't sure `apisix_latency` is large then `upstream_latency`
   2. I found that some nodes' time is inaccurate  and doesn't configrate NTP. so I think that  `local latency = (ngx.now() - ngx.req.start_time()) * 1000` ngx.now(). ngx.new() is get the system local time ?


--
This is an automated message from the Apache Git Service.
To respond to the message, please log on to GitHub and use the
URL above to go to the specific comment.

To unsubscribe, e-mail: notifications-unsubscribe@apisix.apache.org

For queries about this service, please contact Infrastructure at:
users@infra.apache.org
[GitHub] [apisix] spacewander closed issue #5146: bug: Prometheus plugin metrics http latency sum is negative
Posted by GitBox <gi...@apache.org>.
spacewander closed issue #5146:
URL: https://github.com/apache/apisix/issues/5146


--
This is an automated message from the Apache Git Service.
To respond to the message, please log on to GitHub and use the
URL above to go to the specific comment.

To unsubscribe, e-mail: notifications-unsubscribe@apisix.apache.org

For queries about this service, please contact Infrastructure at:
users@infra.apache.org
[GitHub] [apisix] spacewander commented on issue #5146: bug: Prometheus plugin metrics http latency sum is negative
Posted by GitBox <gi...@apache.org>.
spacewander commented on issue #5146:
URL: https://github.com/apache/apisix/issues/5146#issuecomment-928561094


--
This is an automated message from the Apache Git Service.
To respond to the message, please log on to GitHub and use the
URL above to go to the specific comment.

To unsubscribe, e-mail: notifications-unsubscribe@apisix.apache.org

For queries about this service, please contact Infrastructure at:
users@infra.apache.org
[GitHub] [apisix] spacewander commented on issue #5146: bug: Prometheus plugin metrics http latency sum is negative
Posted by GitBox <gi...@apache.org>.
spacewander commented on issue #5146:
URL: https://github.com/apache/apisix/issues/5146#issuecomment-928914097


   >
   >
   > > @leslie-tsang
   > > Please read the link given by @zhendongcmss. The problem is not about the cached time.
   >
   > https://github.com/apache/apisix/blob/d413d77a9eff5fd5585f83c01fc0843523ef2bf2/apisix/plugins/prometheus/exporter.lua#L146
   >
   > IMO, `ngx.now` may return a cached time, which causes incorrect latency.

   You should read the link. Maxim Dounin, the maintainer of Nginx, already gave an answer.


--
This is an automated message from the Apache Git Service.
To respond to the message, please log on to GitHub and use the
URL above to go to the specific comment.

To unsubscribe, e-mail: notifications-unsubscribe@apisix.apache.org

For queries about this service, please contact Infrastructure at:
users@infra.apache.org
[GitHub] [apisix] spacewander commented on issue #5146: bug: Prometheus plugin metrics http latency sum is negative
Posted by GitBox <gi...@apache.org>.
spacewander commented on issue #5146:
URL: https://github.com/apache/apisix/issues/5146#issuecomment-928561094


   I will ask the Nginx developer why they use two different ways to get the time.
   As for now, look like we need to add a check to avoid the negative count.


--
This is an automated message from the Apache Git Service.
To respond to the message, please log on to GitHub and use the
URL above to go to the specific comment.

To unsubscribe, e-mail: notifications-unsubscribe@apisix.apache.org

For queries about this service, please contact Infrastructure at:
users@infra.apache.org
[GitHub] [apisix] leslie-tsang commented on issue #5146: bug: Prometheus plugin metrics http latency sum is negative
Posted by GitBox <gi...@apache.org>.
leslie-tsang commented on issue #5146:
URL: https://github.com/apache/apisix/issues/5146#issuecomment-928927753


   > For somebody who doesn't read the link, here is Maxim Dounin's answer:
   >
   > > This is because now on Linux $upstream_response_time
   > > is counted via clock_gettime(CLOCK_MONOTONIC_COARSE), and with
   > > typical values of CONFIG_HZ=250, it may be up to 4
   > > milliseconds. At the same time, the time to calculate $request_time
   > > is not a monotonous time, but the result of gettimeofday(), i.e.
   > > that is, the time according to the wall clock. So in some cases
   > > $upstream_response_time may be slightly larger than
   > > $request_time.
   >
   > https://forum.nginx.org/read.php?21,284448,284450#msg-284450
   >
   > Here is part of my letter sent to Nginx devel mail list this morning, which also give other details:
   >
   > > Currently, the request_time uses ngx_timeofday to get the time, which
   > > finally will call gettimeofday. Meanwhile, the upstream_x_time series
   > > uses ngx_current_msec to calculate the time, which finally will call
   > > ngx_monotonic_time.
   > > On Linux, the gettimeofday will call clock_gettime(CLOCK_REALTIME,
   > > &ts) while the ngx_monotonic_time will call
   > > clock_gettime(CLOCK_MONOTONIC_COARSE, &ts).
   > > So the request_time uses CLOCK_REALTIME and the upstream_x_time series
   > > uses CLOCK_MONOTONIC_COARSE. As they are different sources,

   Got.


--
This is an automated message from the Apache Git Service.
To respond to the message, please log on to GitHub and use the
URL above to go to the specific comment.

To unsubscribe, e-mail: notifications-unsubscribe@apisix.apache.org

For queries about this service, please contact Infrastructure at:
users@infra.apache.org
[GitHub] [apisix] zhendongcmss commented on issue #5146: bug: Prometheus plugin metrics http latency sum is negative
Posted by GitBox <gi...@apache.org>.
zhendongcmss commented on issue #5146:
URL: https://github.com/apache/apisix/issues/5146#issuecomment-927963685


   I fount this blog which said that $upstream_response_time can large than $request_time. https://stackoverflow.com/questions/53978695/how-can-request-time-be-less-than-upstream-response-time-in-nginx


--
This is an automated message from the Apache Git Service.
To respond to the message, please log on to GitHub and use the
URL above to go to the specific comment.

To unsubscribe, e-mail: notifications-unsubscribe@apisix.apache.org

For queries about this service, please contact Infrastructure at:
users@infra.apache.org
[GitHub] [apisix] zhendongcmss commented on issue #5146: bug: Prometheus http latency sum is nagative
Posted by GitBox <gi...@apache.org>.
zhendongcmss commented on issue #5146:
URL: https://github.com/apache/apisix/issues/5146#issuecomment-927631140


   > Maybe we can add:
   >
   > ```
   > diff --git apisix/plugins/prometheus/exporter.lua apisix/plugins/prometheus/exporter.lua
   > index ea1c4843..4a8ec64e 100644
   > --- apisix/plugins/prometheus/exporter.lua
   > +++ apisix/plugins/prometheus/exporter.lua
   > @@ -153,6 +153,10 @@ function _M.log(conf, ctx)
   >          metrics.latency:observe(upstream_latency,
   >              gen_arr("upstream", route_id, service_id, consumer_name, balancer_ip))
   >          apisix_latency =  apisix_latency - upstream_latency
   > +        if apisix_latency < 0 then
   > +            ngx.log(ngx.EMERG, "latency now ", ngx.now(), ", start_time: ", ngx.req.start_time(), ", upstream: ",
   > +                    ctx.var.upstream_response_time)
   > +        end
   >      end
   >      metrics.latency:observe(apisix_latency,
   >          gen_arr("apisix", route_id, service_id, consumer_name, balancer_ip))
   > ```
   >
   > to see each value of the items.

   ok, let me try.


--
This is an automated message from the Apache Git Service.
To respond to the message, please log on to GitHub and use the
URL above to go to the specific comment.

To unsubscribe, e-mail: notifications-unsubscribe@apisix.apache.org

For queries about this service, please contact Infrastructure at:
users@infra.apache.org
[GitHub] [apisix] zhendongcmss edited a comment on issue #5146: bug: Prometheus plugin metrics http latency sum is negative
Posted by GitBox <gi...@apache.org>.
zhendongcmss edited a comment on issue #5146:
URL: https://github.com/apache/apisix/issues/5146#issuecomment-927625603


--
This is an automated message from the Apache Git Service.
To respond to the message, please log on to GitHub and use the
URL above to go to the specific comment.

To unsubscribe, e-mail: notifications-unsubscribe@apisix.apache.org

For queries about this service, please contact Infrastructure at:
users@infra.apache.org
[GitHub] [apisix] zhendongcmss commented on issue #5146: bug: Prometheus http latency sum is nagative
Posted by GitBox <gi...@apache.org>.
zhendongcmss commented on issue #5146:
URL: https://github.com/apache/apisix/issues/5146#issuecomment-927662252


   From the log, this item is negative;
   ```
   2021/09/27 08:10:32 [emerg] 59#59: *47138 [lua] exporter.lua:161: phase_func(): latency now 1632730232.276, start_time: 1632730232.233, upstream: 0.044 while logging request, client: 10.195.158.10, server: _, request: "GET / HTTP/1.0", upstream: "http://10.195.152.61:8080/", host: "10.195.152.61:9080"
   ```
   1632730232.276 - 1632730232.233 - 0.044 = -0.001


--
This is an automated message from the Apache Git Service.
To respond to the message, please log on to GitHub and use the
URL above to go to the specific comment.

To unsubscribe, e-mail: notifications-unsubscribe@apisix.apache.org

For queries about this service, please contact Infrastructure at:
users@infra.apache.org
[GitHub] [apisix] zhendongcmss commented on issue #5146: bug: Prometheus http latency sum is nagative
Posted by GitBox <gi...@apache.org>.
zhendongcmss commented on issue #5146:
URL: https://github.com/apache/apisix/issues/5146#issuecomment-927609958


   I Investigation:
   1. The value is negative  only when  type="apisix", so from the code `apisix_latency =  apisix_latency - upstream_latency`, I sure `apisix_latency` is large then `upstream_latency`
   2. I found that some nodes' time is inaccurate  and doesn't configrate NTP. so I think that  `local latency = (ngx.now() - ngx.req.start_time()) * 1000` ngx.now(). ngx.new() is get the system local time ?


--
This is an automated message from the Apache Git Service.
To respond to the message, please log on to GitHub and use the
URL above to go to the specific comment.

To unsubscribe, e-mail: notifications-unsubscribe@apisix.apache.org

For queries about this service, please contact Infrastructure at:
users@infra.apache.org
[GitHub] [apisix] zhendongcmss edited a comment on issue #5146: bug: Prometheus http latency sum is nagative
Posted by GitBox <gi...@apache.org>.
zhendongcmss edited a comment on issue #5146:
URL: https://github.com/apache/apisix/issues/5146#issuecomment-927609958


   I Investigation:
   1. The value is negative  only when  type="apisix", so from the code `apisix_latency =  apisix_latency - upstream_latency`, I don't sure `apisix_latency` is large then `upstream_latency`
   2. I found that some nodes' time is inaccurate  and doesn't configrate NTP. so I think that  `local latency = (ngx.now() - ngx.req.start_time()) * 1000` ngx.now(). ngx.new() is get the system local time ?


--
This is an automated message from the Apache Git Service.
To respond to the message, please log on to GitHub and use the
URL above to go to the specific comment.

To unsubscribe, e-mail: notifications-unsubscribe@apisix.apache.org

For queries about this service, please contact Infrastructure at:
users@infra.apache.org
[GitHub] [apisix] zhendongcmss commented on issue #5146: bug: Prometheus http latency sum is nagative
Posted by GitBox <gi...@apache.org>.
zhendongcmss commented on issue #5146:
URL: https://github.com/apache/apisix/issues/5146#issuecomment-927637505


   > Maybe we can add:
   >
   > ```
   > diff --git apisix/plugins/prometheus/exporter.lua apisix/plugins/prometheus/exporter.lua
   > index ea1c4843..4a8ec64e 100644
   > --- apisix/plugins/prometheus/exporter.lua
   > +++ apisix/plugins/prometheus/exporter.lua
   > @@ -153,6 +153,10 @@ function _M.log(conf, ctx)
   >          metrics.latency:observe(upstream_latency,
   >              gen_arr("upstream", route_id, service_id, consumer_name, balancer_ip))
   >          apisix_latency =  apisix_latency - upstream_latency
   > +        if apisix_latency < 0 then
   > +            ngx.log(ngx.EMERG, "latency now ", ngx.now(), ", start_time: ", ngx.req.start_time(), ", upstream: ",
   > +                    ctx.var.upstream_response_time)
   > +        end
   >      end
   >      metrics.latency:observe(apisix_latency,
   >          gen_arr("apisix", route_id, service_id, consumer_name, balancer_ip))
   > ```
   >
   > to see each value of the items.

   **Got the error.log**


   **tailf /var/log/balancer/error.log | grep start_time**
   ```
   [root@ZJNB-ICLOUD-SPOD2-PM-DC01-ACCESSER-01 ~]# tailf /var/log/balancer/error.log | grep start_time
   2021/09/27 08:10:31 [emerg] 57#57: *46261 [lua] exporter.lua:161: phase_func(): latency now 1632730231.246, start_time: 1632730231.203, upstream: 0.043 while logging request, client: 10.195.158.10, server: _, request: "GET / HTTP/1.0", upstream: "http://10.195.152.61:8085/", host: "10.195.152.61:9080"
   2021/09/27 08:10:31 [emerg] 50#50: *35769 [lua] exporter.lua:161: phase_func(): latency now 1632730231.622, start_time: 1632730231.288, upstream: 0.334 while logging request, client: 10.195.158.13, server: _, request: "PUT /tb3/file_tttsMM42626 HTTP/1.1", upstream: "http://10.195.152.61:8081/tb3/file_tttsMM42626", host: "10.195.156.10"
   2021/09/27 08:10:31 [emerg] 50#50: *46882 [lua] exporter.lua:161: phase_func(): latency now 1632730231.906, start_time: 1632730231.863, upstream: 0.043 while logging request, client: 10.195.158.20, server: _, request: "GET / HTTP/1.0", upstream: "http://10.195.152.61:8078/", host: "10.195.152.61:9080"
   2021/09/27 08:10:31 [emerg] 76#76: *46898 [lua] exporter.lua:161: phase_func(): latency now 1632730231.932, start_time: 1632730231.89, upstream: 0.042 while logging request, client: 10.195.158.10, server: _, request: "GET / HTTP/1.0", upstream: "http://10.195.152.61:8079/", host: "onest-pgy.cmecloud.cn"
   2021/09/27 08:10:31 [emerg] 67#67: *46897 [lua] exporter.lua:161: phase_func(): latency now 1632730231.934, start_time: 1632730231.89, upstream: 0.044 while logging request, client: 10.195.158.10, server: _, request: "GET / HTTP/1.0", upstream: "http://10.195.152.61:8079/", host: "onest-pgy.cmecloud.cn"
   2021/09/27 08:10:32 [emerg] 59#59: *47115 [lua] exporter.lua:161: phase_func(): latency now 1632730232.227, start_time: 1632730232.184, upstream: 0.043 while logging request, client: 10.195.158.10, server: _, request: "GET / HTTP/1.0", upstream: "http://10.195.152.61:8084/", host: "onest-pgy.cmecloud.cn"
   2021/09/27 08:10:32 [emerg] 59#59: *47138 [lua] exporter.lua:161: phase_func(): latency now 1632730232.276, start_time: 1632730232.233, upstream: 0.044 while logging request, client: 10.195.158.10, server: _, request: "GET / HTTP/1.0", upstream: "http://10.195.152.61:8080/", host: "10.195.152.61:9080"
   2021/09/27 08:10:32 [emerg] 67#67: *47321 [lua] exporter.lua:161: phase_func(): latency now 1632730232.449, start_time: 1632730232.405, upstream: 0.044 while logging request, client: 10.195.158.20, server: _, request: "GET / HTTP/1.0", upstream: "http://10.195.152.61:8084/", host: "10.195.152.61:9080"


   ```


--
This is an automated message from the Apache Git Service.
To respond to the message, please log on to GitHub and use the
URL above to go to the specific comment.

To unsubscribe, e-mail: notifications-unsubscribe@apisix.apache.org

For queries about this service, please contact Infrastructure at:
users@infra.apache.org
[GitHub] [apisix] zhendongcmss edited a comment on issue #5146: bug: Prometheus plugin metrics http latency sum is negative
Posted by GitBox <gi...@apache.org>.
zhendongcmss edited a comment on issue #5146:
URL: https://github.com/apache/apisix/issues/5146#issuecomment-927603094
--
This is an automated message from the Apache Git Service.
To respond to the message, please log on to GitHub and use the
URL above to go to the specific comment.
To unsubscribe, e-mail: notifications-unsubscribe@apisix.apache.org
For queries about this service, please contact Infrastructure at:
users@infra.apache.org
[GitHub] [apisix] zhendongcmss edited a comment on issue #5146: bug: Prometheus plugin metrics http latency sum is negative
Posted by GitBox <gi...@apache.org>.
zhendongcmss edited a comment on issue #5146:
URL: https://github.com/apache/apisix/issues/5146#issuecomment-928933666
Facts proved `ngx.update_time()` doesn't work.
```
@@ -150,12 +150,17 @@ function _M.log(conf, ctx)
metrics.latency:observe(latency,
gen_arr("request", vars.status, method_id, route_id, service_id, consumer_name, balancer_ip))
+ ngx.update_time()
local apisix_latency = latency
if ctx.var.upstream_response_time then
local upstream_latency = ctx.var.upstream_response_time * 1000
metrics.latency:observe(upstream_latency,
gen_arr("upstream", vars.status, method_id, route_id, service_id, consumer_name, balancer_ip))
apisix_latency = apisix_latency - upstream_latency
+ if apisix_latency < 0 then
+ ngx.log(ngx.EMERG, "123456789","latency now ", ngx.now(), ", start_time: ", ngx.req.start_time(), ", upstream: ",
+ ctx.var.upstream_response_time)
+ end
```

--
This is an automated message from the Apache Git Service.
To respond to the message, please log on to GitHub and use the
URL above to go to the specific comment.
To unsubscribe, e-mail: notifications-unsubscribe@apisix.apache.org
For queries about this service, please contact Infrastructure at:
users@infra.apache.org
[GitHub] [apisix] leslie-tsang commented on issue #5146: bug: Prometheus plugin metrics http latency sum is negative
Posted by GitBox <gi...@apache.org>.
leslie-tsang commented on issue #5146:
URL: https://github.com/apache/apisix/issues/5146#issuecomment-928873733


   @spacewander, nginx cached time to improve performance, maybe we can use func `ngx.update_time` to fix it.


   > find how `ngx.now` work

   https://github.com/openresty/lua-resty-core/blob/985eb5b323468effaa66deb5cbd4f800b99834cf/lib/resty/core/time.lua#L69-L71

   > find how `ngx_http_lua_ffi_now` work

   https://github.com/openresty/lua-nginx-module/blob/1c1bcfeb9276c6dfc9b038a6fa779e7e4b605bc9/src/ngx_http_lua_time.c#L17-L25

   > find what `ngx_timeofday` from

   https://github.com/nginx/nginx/blob/a64190933e06758d50eea926e6a55974645096fd/src/core/ngx_times.h#L37

   > `ngx_time_update` will update `ngx_timeofday`

   https://github.com/nginx/nginx/blob/a64190933e06758d50eea926e6a55974645096fd/src/core/ngx_times.c#L80-L192


--
This is an automated message from the Apache Git Service.
To respond to the message, please log on to GitHub and use the
URL above to go to the specific comment.

To unsubscribe, e-mail: notifications-unsubscribe@apisix.apache.org

For queries about this service, please contact Infrastructure at:
users@infra.apache.org
[GitHub] [apisix] zhendongcmss commented on issue #5146: bug: Prometheus plugin metrics http latency sum is negative
Posted by GitBox <gi...@apache.org>.
zhendongcmss commented on issue #5146:
URL: https://github.com/apache/apisix/issues/5146#issuecomment-928646320


--
This is an automated message from the Apache Git Service.
To respond to the message, please log on to GitHub and use the
URL above to go to the specific comment.

To unsubscribe, e-mail: notifications-unsubscribe@apisix.apache.org

For queries about this service, please contact Infrastructure at:
users@infra.apache.org
[GitHub] [apisix] zhendongcmss edited a comment on issue #5146: bug: Prometheus plugin metrics http latency sum is negative
Posted by GitBox <gi...@apache.org>.
zhendongcmss edited a comment on issue #5146:
URL: https://github.com/apache/apisix/issues/5146#issuecomment-927625603


   > Is there any difference between routes whose latency are negative and those aren't?

   We have many routes. we config the prometheus plugin on the global rules. The prometheus metrics print the route id on each item. It is a good question. I found negative sum mostly on the route id is 11 and 12. I don't this issue on other route until now.


   ```
   apisix_http_latency_sum{type="apisix",code="200",method="GET",route="11",service="",consumer="",node="1"} -155.00492858887
   apisix_http_latency_sum{type="apisix",code="200",method="HEAD",route="13",service="",consumer="",node="10.1"} 1.0000629425049
   apisix_http_latency_sum{type="apisix",code="200",method="PUT",route="12",service="",consumer="",node="101"} 82853.992879868
   apisix_http_latency_sum{type="apisix",code="204",method="DELETE",route="13",service="",consumer="",node="11"} 88.995412826538
   apisix_http_latency_sum{type="apisix",code="400",method="PUT",route="12",service="",consumer="",node="10.11"} -8.392333984375e-05

   ```


--
This is an automated message from the Apache Git Service.
To respond to the message, please log on to GitHub and use the
URL above to go to the specific comment.

To unsubscribe, e-mail: notifications-unsubscribe@apisix.apache.org

For queries about this service, please contact Infrastructure at:
users@infra.apache.org
[GitHub] [apisix] zhendongcmss removed a comment on issue #5146: bug: Prometheus http latency sum is nagative
Posted by GitBox <gi...@apache.org>.
zhendongcmss removed a comment on issue #5146:
URL: https://github.com/apache/apisix/issues/5146#issuecomment-927624807


   > Is there any difference between routes whose latency are negative and those aren't?
   We have many routes. we config the prometheus plugin on the global rules. The prometheus metrics print the route id on each item. It is a good question. I found negative sum mostly  on the route id is 11 and 12. I don't this issue on other route until now.


   ```
   apisix_http_latency_count{type="upstream",code="400",method="PUT",route="12",service="",consumer="",node="10.195.152.61"} 1
   apisix_http_latency_sum{type="apisix",code="200",method="GET",route="11",service="",consumer="",node="10.195.152.61"} -162.00309753418
   apisix_http_latency_sum{type="apisix",code="200",method="HEAD",route="13",service="",consumer="",node="10.195.152.61"} 1.0000629425049
   apisix_http_latency_sum{type="apisix",code="200",method="PUT",route="12",service="",consumer="",node="10.195.152.61"} 82853.992879868
   apisix_http_latency_sum{type="apisix",code="204",method="DELETE",route="13",service="",consumer="",node="10.195.152.61"} 88.995412826538
   apisix_http_latency_sum{type="apisix",code="400",method="PUT",route="12",service="",consumer="",node="10.195.152.61"} -8.392333984375e-05
   apisix_http_latency_sum{type="request",code="200",method="GET",route="11",service="",consumer="",node="10.195.152.61"} 1469522.9969025
   apisix_http_latency_sum{type="request",code="200",method="HEAD",route="13",service="",consumer="",node="10.195.152.61"} 134.0000629425
   apisix_http_latency_sum{type="request",code="200",method="PUT",route="12",service="",consumer="",node="10.195.152.61"} 586015.99287987
   apisix_http_latency_sum{type="request",code="204",method="DELETE",route="13",service="",consumer="",node="10.195.152.61"} 28059.995412827

   ```


--
This is an automated message from the Apache Git Service.
To respond to the message, please log on to GitHub and use the
URL above to go to the specific comment.

To unsubscribe, e-mail: notifications-unsubscribe@apisix.apache.org

For queries about this service, please contact Infrastructure at:
users@infra.apache.org
[GitHub] [apisix] spacewander commented on issue #5146: bug: Prometheus http latency sum is nagative
Posted by GitBox <gi...@apache.org>.
spacewander commented on issue #5146:
URL: https://github.com/apache/apisix/issues/5146#issuecomment-927617329


   Is there any difference between routes whose latency are negative and those aren't?


--
This is an automated message from the Apache Git Service.
To respond to the message, please log on to GitHub and use the
URL above to go to the specific comment.

To unsubscribe, e-mail: notifications-unsubscribe@apisix.apache.org

For queries about this service, please contact Infrastructure at:
users@infra.apache.org
[GitHub] [apisix] leslie-tsang edited a comment on issue #5146: bug: Prometheus plugin metrics http latency sum is negative
Posted by GitBox <gi...@apache.org>.
leslie-tsang edited a comment on issue #5146:
URL: https://github.com/apache/apisix/issues/5146#issuecomment-928873733


   @spacewander, nginx cached time to improve performance, maybe we can use func `ngx.update_time` to fix it.


   > find how `ngx.now` work

   https://github.com/openresty/lua-resty-core/blob/985eb5b323468effaa66deb5cbd4f800b99834cf/lib/resty/core/time.lua#L69-L71

   > find how `ngx_http_lua_ffi_now` work

   https://github.com/openresty/lua-nginx-module/blob/1c1bcfeb9276c6dfc9b038a6fa779e7e4b605bc9/src/ngx_http_lua_time.c#L17-L25

   > find what `ngx_timeofday` from

   https://github.com/nginx/nginx/blob/a64190933e06758d50eea926e6a55974645096fd/src/core/ngx_times.h#L37

   > `ngx_time_update` will update `ngx_timeofday`

   https://github.com/nginx/nginx/blob/a64190933e06758d50eea926e6a55974645096fd/src/core/ngx_times.c#L80-L192
   https://github.com/nginx/nginx/blob/a64190933e06758d50eea926e6a55974645096fd/src/core/ngx_times.c#L184


--
This is an automated message from the Apache Git Service.
To respond to the message, please log on to GitHub and use the
URL above to go to the specific comment.

To unsubscribe, e-mail: notifications-unsubscribe@apisix.apache.org

For queries about this service, please contact Infrastructure at:
users@infra.apache.org
[GitHub] [apisix] zhendongcmss edited a comment on issue #5146: bug: Prometheus http latency sum is nagative
Posted by GitBox <gi...@apache.org>.
zhendongcmss edited a comment on issue #5146:
URL: https://github.com/apache/apisix/issues/5146#issuecomment-927609958


   I Investigation:
   1. The value is negative  only when  type="apisix", so `gen_arr("apisix", vars.status, method_id, route_id, service_id, consumer_name, balancer_ip)) `  has bug. from the code `apisix_latency =  apisix_latency - upstream_latency`, I don't sure `apisix_latency` is large then `upstream_latency`
   2. I found that some nodes' time is inaccurate  and doesn't configrate NTP. so I think that  `local latency = (ngx.now() - ngx.req.start_time()) * 1000` ngx.now(). ngx.new() is get the system local time ?


--
This is an automated message from the Apache Git Service.
To respond to the message, please log on to GitHub and use the
URL above to go to the specific comment.

To unsubscribe, e-mail: notifications-unsubscribe@apisix.apache.org

For queries about this service, please contact Infrastructure at:
users@infra.apache.org
[GitHub] [apisix] zhendongcmss commented on issue #5146: bug: Prometheus http latency sum is nagative
Posted by GitBox <gi...@apache.org>.
zhendongcmss commented on issue #5146:
URL: https://github.com/apache/apisix/issues/5146#issuecomment-927603094
--
This is an automated message from the Apache Git Service.
To respond to the message, please log on to GitHub and use the
URL above to go to the specific comment.
To unsubscribe, e-mail: notifications-unsubscribe@apisix.apache.org
For queries about this service, please contact Infrastructure at:
users@infra.apache.org
[GitHub] [apisix] spacewander commented on issue #5146: bug: Prometheus plugin metrics http latency sum is negative
Posted by GitBox <gi...@apache.org>.
spacewander commented on issue #5146:
URL: https://github.com/apache/apisix/issues/5146#issuecomment-928583720


   @zhendongcmss
   Would you submit a PR? Just change latency to zero when it's negative and add a comment for it. Thanks!


--
This is an automated message from the Apache Git Service.
To respond to the message, please log on to GitHub and use the
URL above to go to the specific comment.

To unsubscribe, e-mail: notifications-unsubscribe@apisix.apache.org

For queries about this service, please contact Infrastructure at:
users@infra.apache.org
[GitHub] [apisix] spacewander commented on issue #5146: bug: Prometheus http latency sum is nagative
Posted by GitBox <gi...@apache.org>.
spacewander commented on issue #5146:
URL: https://github.com/apache/apisix/issues/5146#issuecomment-927627423


   Maybe we can add:
   ```
   diff --git apisix/plugins/prometheus/exporter.lua apisix/plugins/prometheus/exporter.lua
   index ea1c4843..4a8ec64e 100644
   --- apisix/plugins/prometheus/exporter.lua
   +++ apisix/plugins/prometheus/exporter.lua
   @@ -153,6 +153,10 @@ function _M.log(conf, ctx)
            metrics.latency:observe(upstream_latency,
                gen_arr("upstream", route_id, service_id, consumer_name, balancer_ip))
            apisix_latency =  apisix_latency - upstream_latency
   +        if apisix_latency < 0 then
   +            ngx.log(ngx.EMERG, "latency now ", ngx.now(), ", start_time: ", ngx.req.start_time(), ", upstream: ",
   +                    ctx.var.upstream_response_time)
   +        end
        end
        metrics.latency:observe(apisix_latency,
            gen_arr("apisix", route_id, service_id, consumer_name, balancer_ip))
   ```

   to see each value of the items.


--
This is an automated message from the Apache Git Service.
To respond to the message, please log on to GitHub and use the
URL above to go to the specific comment.

To unsubscribe, e-mail: notifications-unsubscribe@apisix.apache.org

For queries about this service, please contact Infrastructure at:
users@infra.apache.org
[GitHub] [apisix] leslie-tsang commented on issue #5146: bug: Prometheus plugin metrics http latency sum is negative
Posted by GitBox <gi...@apache.org>.
leslie-tsang commented on issue #5146:
URL: https://github.com/apache/apisix/issues/5146#issuecomment-928873733


--
This is an automated message from the Apache Git Service.
To respond to the message, please log on to GitHub and use the
URL above to go to the specific comment.

To unsubscribe, e-mail: notifications-unsubscribe@apisix.apache.org

For queries about this service, please contact Infrastructure at:
users@infra.apache.org
[GitHub] [apisix] zhendongcmss edited a comment on issue #5146: bug: Prometheus plugin metrics http latency sum is negative
Posted by GitBox <gi...@apache.org>.
zhendongcmss edited a comment on issue #5146:
URL: https://github.com/apache/apisix/issues/5146#issuecomment-927963685


   I fount this blog which said that $upstream_response_time can large than $request_time. https://stackoverflow.com/questions/53978695/how-can-request-time-be-less-than-upstream-response-time-in-nginx
   https://stackoverflow.com/questions/55826970/nginx-log-upstream-response-time-is-larger-than-request-time
   https://stackoverflow.com/questions/53978695/how-can-request-time-be-less-than-upstream-response-time-in-nginx


--
This is an automated message from the Apache Git Service.
To respond to the message, please log on to GitHub and use the
URL above to go to the specific comment.

To unsubscribe, e-mail: notifications-unsubscribe@apisix.apache.org

For queries about this service, please contact Infrastructure at:
users@infra.apache.org
[GitHub] [apisix] leslie-tsang commented on issue #5146: bug: Prometheus plugin metrics http latency sum is negative
Posted by GitBox <gi...@apache.org>.
leslie-tsang commented on issue #5146:
URL: https://github.com/apache/apisix/issues/5146#issuecomment-928910201


   > @leslie-tsang
   > Please read the link given by @zhendongcmss. The problem is not about the cached time.

   https://github.com/apache/apisix/blob/d413d77a9eff5fd5585f83c01fc0843523ef2bf2/apisix/plugins/prometheus/exporter.lua#L146

   IMO, `ngx.now` may return a cached time, which causes incorrect latency.


--
This is an automated message from the Apache Git Service.
To respond to the message, please log on to GitHub and use the
URL above to go to the specific comment.

To unsubscribe, e-mail: notifications-unsubscribe@apisix.apache.org

For queries about this service, please contact Infrastructure at:
users@infra.apache.org
[GitHub] [apisix] leslie-tsang edited a comment on issue #5146: bug: Prometheus plugin metrics http latency sum is negative
Posted by GitBox <gi...@apache.org>.
leslie-tsang edited a comment on issue #5146:
URL: https://github.com/apache/apisix/issues/5146#issuecomment-928873733


   @spacewander, nginx cached time to improve performance, maybe we can use func `ngx.update_time` to fix it.


   > find how `ngx.now` work

   https://github.com/openresty/lua-resty-core/blob/985eb5b323468effaa66deb5cbd4f800b99834cf/lib/resty/core/time.lua#L69-L71

   > find how `ngx_http_lua_ffi_now` work

   https://github.com/openresty/lua-nginx-module/blob/1c1bcfeb9276c6dfc9b038a6fa779e7e4b605bc9/src/ngx_http_lua_time.c#L17-L25

   > find what `ngx_timeofday` from

   https://github.com/nginx/nginx/blob/a64190933e06758d50eea926e6a55974645096fd/src/core/ngx_times.h#L37

   > `ngx_time_update` will update `ngx_timeofday`

   https://github.com/nginx/nginx/blob/a64190933e06758d50eea926e6a55974645096fd/src/core/ngx_times.c#L80-L192
   https://github.com/nginx/nginx/blob/a64190933e06758d50eea926e6a55974645096fd/src/core/ngx_times.c#L184


--
This is an automated message from the Apache Git Service.
To respond to the message, please log on to GitHub and use the
URL above to go to the specific comment.

To unsubscribe, e-mail: notifications-unsubscribe@apisix.apache.org

For queries about this service, please contact Infrastructure at:
users@infra.apache.org
[GitHub] [apisix] zhendongcmss commented on issue #5146: bug: Prometheus http latency sum is nagative
Posted by GitBox <gi...@apache.org>.
zhendongcmss commented on issue #5146:
URL: https://github.com/apache/apisix/issues/5146#issuecomment-927624807


   > Is there any difference between routes whose latency are negative and those aren't?
   We have many routes. we config the prometheus plugin on the global rules. The prometheus metrics print the route id on each item. It is a good question. I found negative sum mostly  on the route id is 11 and 12. I don't this issue on other route until now.


   ```
   apisix_http_latency_count{type="upstream",code="400",method="PUT",route="12",service="",consumer="",node="10.195.152.61"} 1
   apisix_http_latency_sum{type="apisix",code="200",method="GET",route="11",service="",consumer="",node="10.195.152.61"} -162.00309753418
   apisix_http_latency_sum{type="apisix",code="200",method="HEAD",route="13",service="",consumer="",node="10.195.152.61"} 1.0000629425049
   apisix_http_latency_sum{type="apisix",code="200",method="PUT",route="12",service="",consumer="",node="10.195.152.61"} 82853.992879868
   apisix_http_latency_sum{type="apisix",code="204",method="DELETE",route="13",service="",consumer="",node="10.195.152.61"} 88.995412826538
   apisix_http_latency_sum{type="apisix",code="400",method="PUT",route="12",service="",consumer="",node="10.195.152.61"} -8.392333984375e-05
   apisix_http_latency_sum{type="request",code="200",method="GET",route="11",service="",consumer="",node="10.195.152.61"} 1469522.9969025
   apisix_http_latency_sum{type="request",code="200",method="HEAD",route="13",service="",consumer="",node="10.195.152.61"} 134.0000629425
   apisix_http_latency_sum{type="request",code="200",method="PUT",route="12",service="",consumer="",node="10.195.152.61"} 586015.99287987
   apisix_http_latency_sum{type="request",code="204",method="DELETE",route="13",service="",consumer="",node="10.195.152.61"} 28059.995412827

   ```


--
This is an automated message from the Apache Git Service.
To respond to the message, please log on to GitHub and use the
URL above to go to the specific comment.

To unsubscribe, e-mail: notifications-unsubscribe@apisix.apache.org

For queries about this service, please contact Infrastructure at:
users@infra.apache.org
[GitHub] [apisix] zhendongcmss commented on issue #5146: bug: Prometheus plugin metrics http latency sum is negative
Posted by GitBox <gi...@apache.org>.
zhendongcmss commented on issue #5146:
URL: https://github.com/apache/apisix/issues/5146#issuecomment-928646320


   > @zhendongcmss
   > Would you submit a PR? Just change latency to zero when it's negative and add a comment for it. Thanks!

   NP


--
This is an automated message from the Apache Git Service.
To respond to the message, please log on to GitHub and use the
URL above to go to the specific comment.

To unsubscribe, e-mail: notifications-unsubscribe@apisix.apache.org

For queries about this service, please contact Infrastructure at:
users@infra.apache.org
[GitHub] [apisix] zhendongcmss edited a comment on issue #5146: bug: Prometheus plugin metrics http latency sum is negative
Posted by GitBox <gi...@apache.org>.
zhendongcmss edited a comment on issue #5146:
URL: https://github.com/apache/apisix/issues/5146#issuecomment-927637505


   > Maybe we can add:
   >
   > ```
   > diff --git apisix/plugins/prometheus/exporter.lua apisix/plugins/prometheus/exporter.lua
   > index ea1c4843..4a8ec64e 100644
   > --- apisix/plugins/prometheus/exporter.lua
   > +++ apisix/plugins/prometheus/exporter.lua
   > @@ -153,6 +153,10 @@ function _M.log(conf, ctx)
   >          metrics.latency:observe(upstream_latency,
   >              gen_arr("upstream", route_id, service_id, consumer_name, balancer_ip))
   >          apisix_latency =  apisix_latency - upstream_latency
   > +        if apisix_latency < 0 then
   > +            ngx.log(ngx.EMERG, "latency now ", ngx.now(), ", start_time: ", ngx.req.start_time(), ", upstream: ",
   > +                    ctx.var.upstream_response_time)
   > +        end
   >      end
   >      metrics.latency:observe(apisix_latency,
   >          gen_arr("apisix", route_id, service_id, consumer_name, balancer_ip))
   > ```
   >
   > to see each value of the items.

   **Got the error.log**


   **tailf /var/log/balancer/error.log | grep start_time**
   ```
   [root@localhost ~]# tailf /var/log/balancer/error.log | grep start_time
   2021/09/27 08:10:31 [emerg] 57#57: *46261 [lua] exporter.lua:161: phase_func(): latency now 1632730231.246, start_time: 1632730231.203, upstream: 0.043 while logging request, client: 10.195.158.10, server: _, request: "GET / HTTP/1.0", upstream: "http://10.195.152.61:8085/", host: "10.9080"
   2021/09/27 08:10:31 [emerg] 50#50: *35769 [lua] exporter.lua:161: phase_func(): latency now 1632730231.622, start_time: 1632730231.288, upstream: 0.334 while logging request, client: 10.195.158.13, server: _, request: "PUT /tb3/file_tttsMM42626 HTTP/1.1", upstream: "http://10.195.152.61:8081/tb3/file_tttsMM42626", host: "10.195.156.10"
   2021/09/27 08:10:31 [emerg] 50#50: *46882 [lua] exporter.lua:161: phase_func(): latency now 1632730231.906, start_time: 1632730231.863, upstream: 0.043 while logging request, client: 10.195.158.20, server: _, request: "GET / HTTP/1.0", upstream: "http://10.195.152.61:8078/", host: "10.1:9080"
   2021/09/27 08:10:31 [emerg] 76#76: *46898 [lua] exporter.lua:161: phase_func(): latency now 1632730231.932, start_time: 1632730231.89, upstream: 0.042 while logging request, client: 10.195.158.10, server: _, request: "GET / HTTP/1.0", upstream: "http://101:8079/", host: "onest-pgy.cmecloud.cn"
   2021/09/27 08:10:31 [emerg] 67#67: *46897 [lua] exporter.lua:161: phase_func(): latency now 1632730231.934, start_time: 1632730231.89, upstream: 0.044 while logging request, client: 10.195.158.10, server: _, request: "GET / HTTP/1.0", upstream: "http://11:8079/", host: "onest-pgy.cmecloud.cn"
   2021/09/27 08:10:32 [emerg] 59#59: *47115 [lua] exporter.lua:161: phase_func(): latency now 1632730232.227, start_time: 1632730232.184, upstream: 0.043 while logging request, client: 10.195.158.10, server: _, request: "GET / HTTP/1.0", upstream: "http://11:8084/", host: "onest-pgy.cmecloud.cn"
   2021/09/27 08:10:32 [emerg] 59#59: *47138 [lua] exporter.lua:161: phase_func(): latency now 1632730232.276, start_time: 1632730232.233, upstream: 0.044 while logging request, client: 10.195.158.10, server: _, request: "GET / HTTP/1.0", upstream: "http://101:8080/", host: "10.19:9080"
   2021/09/27 08:10:32 [emerg] 67#67: *47321 [lua] exporter.lua:161: phase_func(): latency now 1632730232.449, start_time: 1632730232.405, upstream: 0.044 while logging request, client: 10.195.158.20, server: _, request: "GET / HTTP/1.0", upstream: "http://101:8084/", host: "10.61:9080"


   ```


--
This is an automated message from the Apache Git Service.
To respond to the message, please log on to GitHub and use the
URL above to go to the specific comment.

To unsubscribe, e-mail: notifications-unsubscribe@apisix.apache.org

For queries about this service, please contact Infrastructure at:
users@infra.apache.org