You are viewing a plain text version of this content. The canonical link for it is here.
Posted to notifications@apisix.apache.org by GitBox <gi...@apache.org> on 2021/12/04 13:42:43 UTC
[GitHub] [apisix] hepyu opened a new issue #5692: request help: etcd high load, etcd high cpu usage, and "put /data_plane/server_info" have lots of "apply request took too long" error
hepyu opened a new issue #5692:
URL: https://github.com/apache/apisix/issues/5692
### Issue description
(1).question
1.question-1:
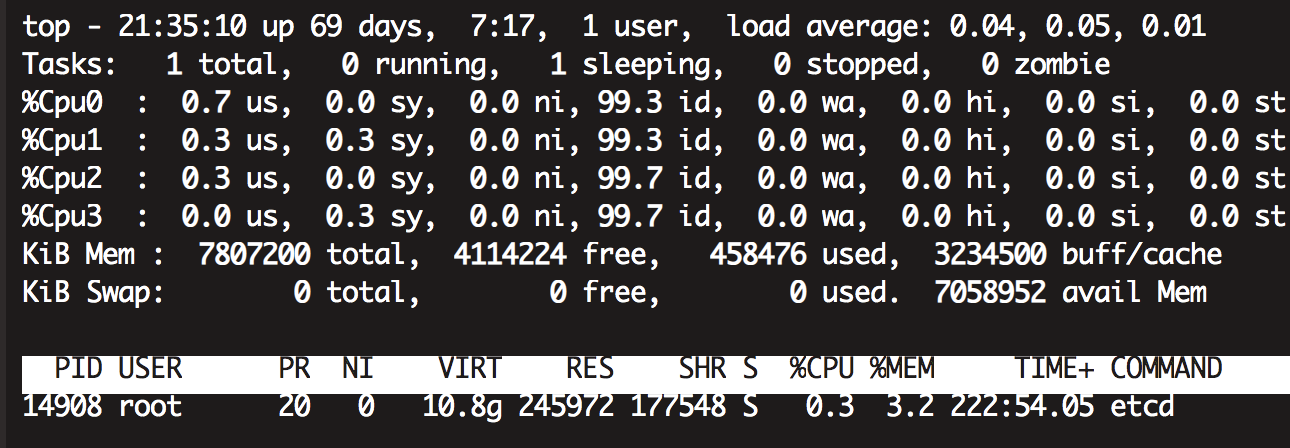
the etcd cluster have 3 nodes, 2 of them has high load and cpu usage, but load and cpu usage of the third node is low, I am so confused:
node1 and node2:high load and high cpu usage

node3:load and cpu usage is low
2.question-2: "put /data_plane/server_info" have lots of "apply request took too long" error
is this the reason why etcd nodes have high cpu usage and load?
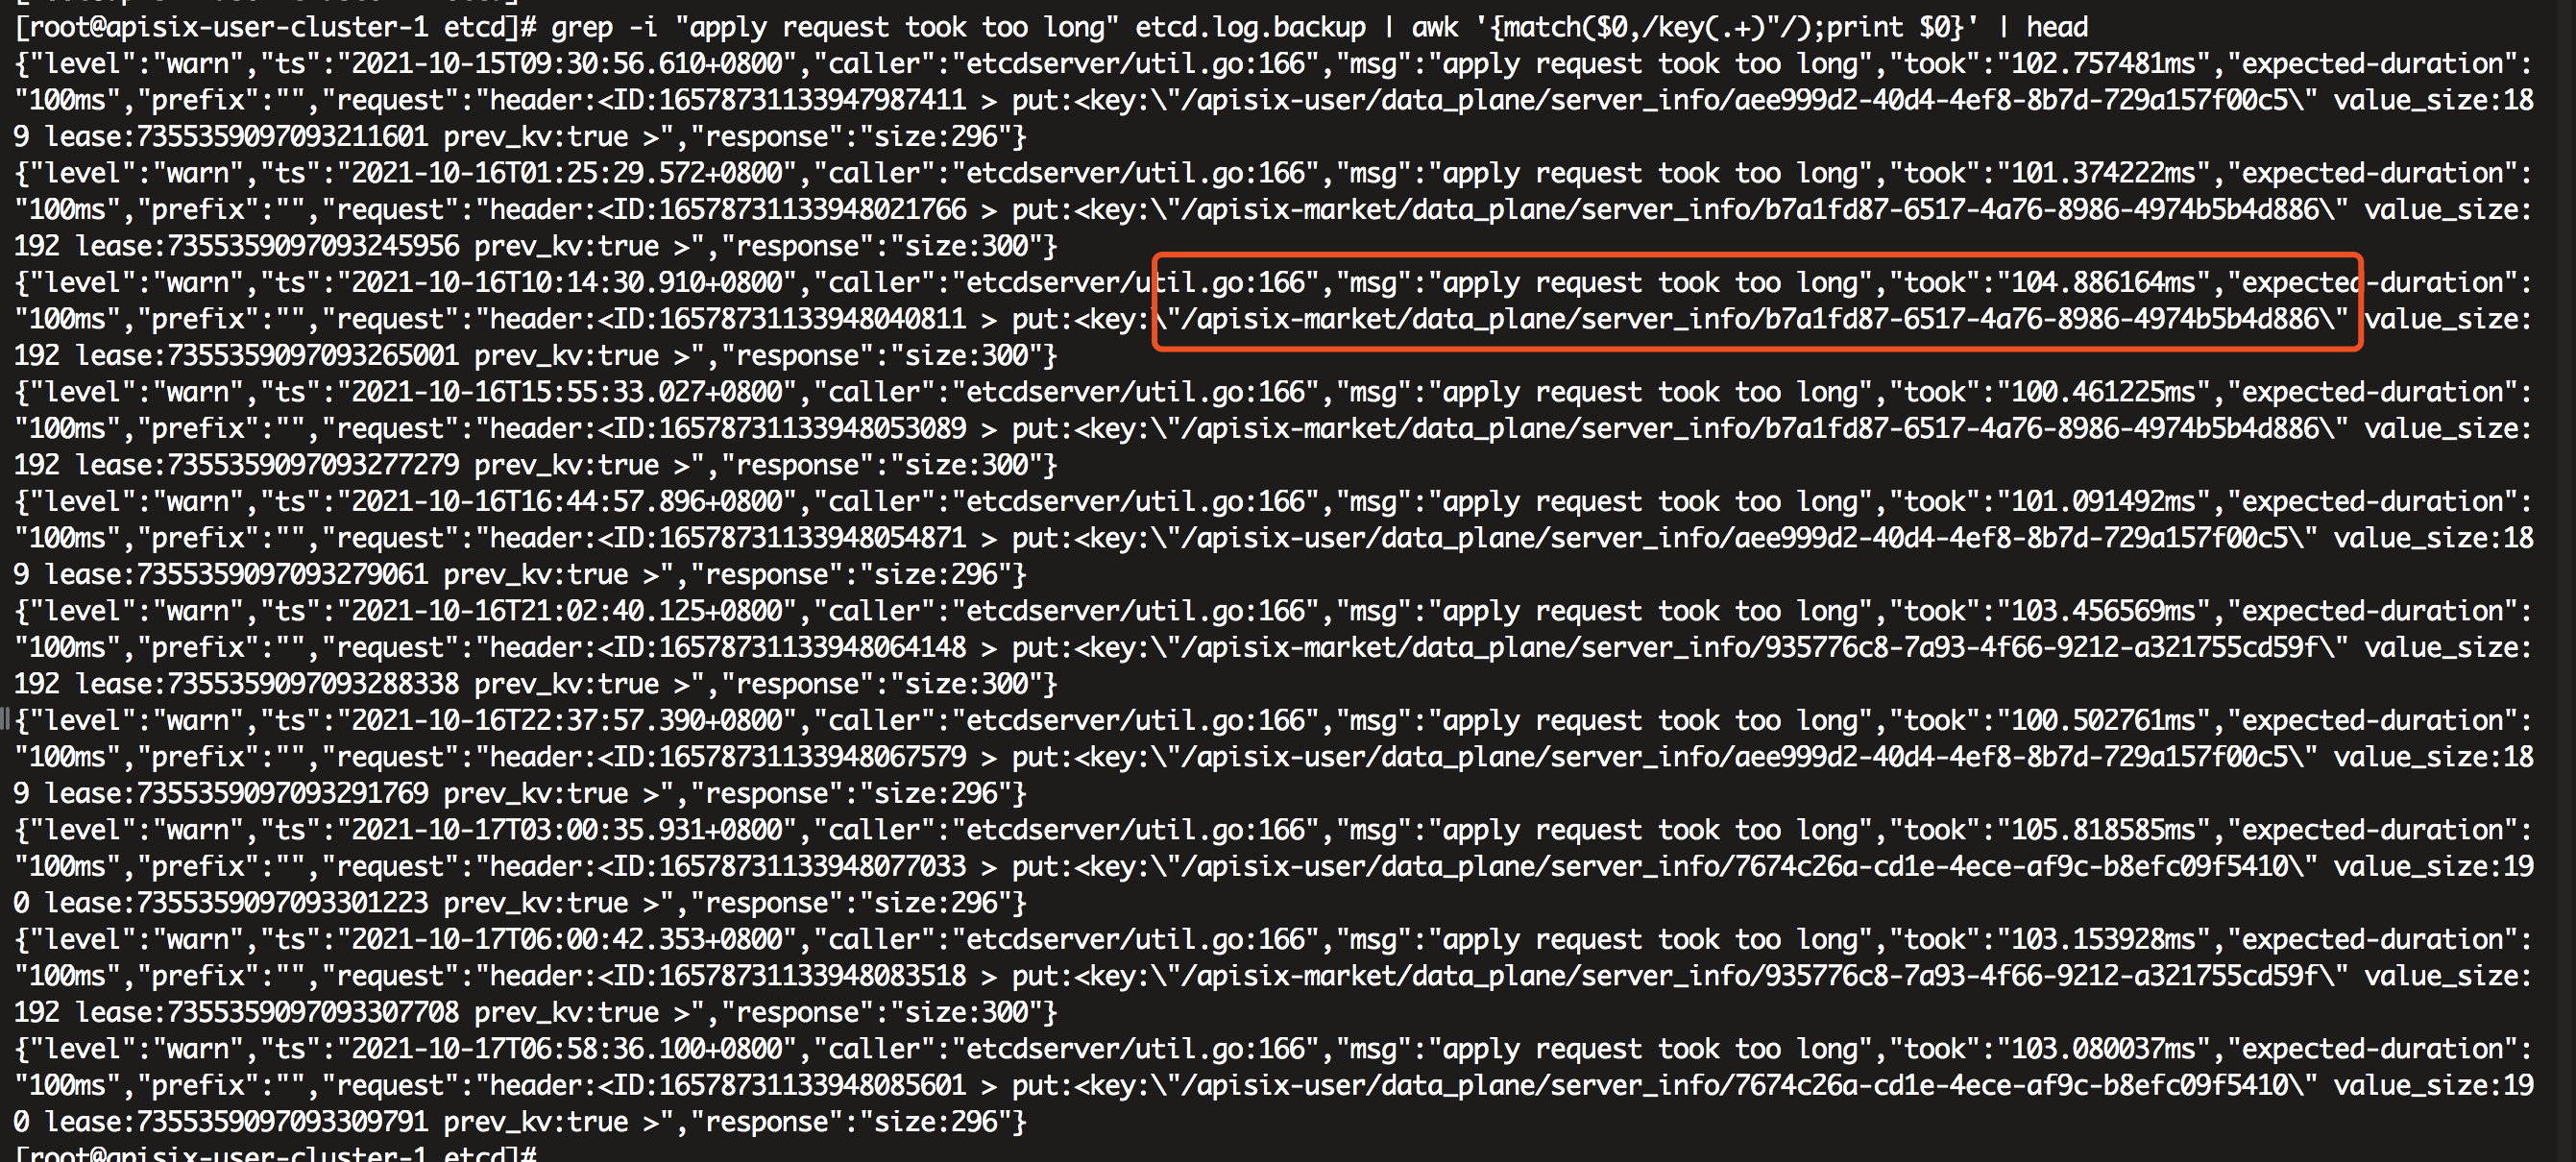
I don't know why this so simple request had so many error requests.

(2). other information
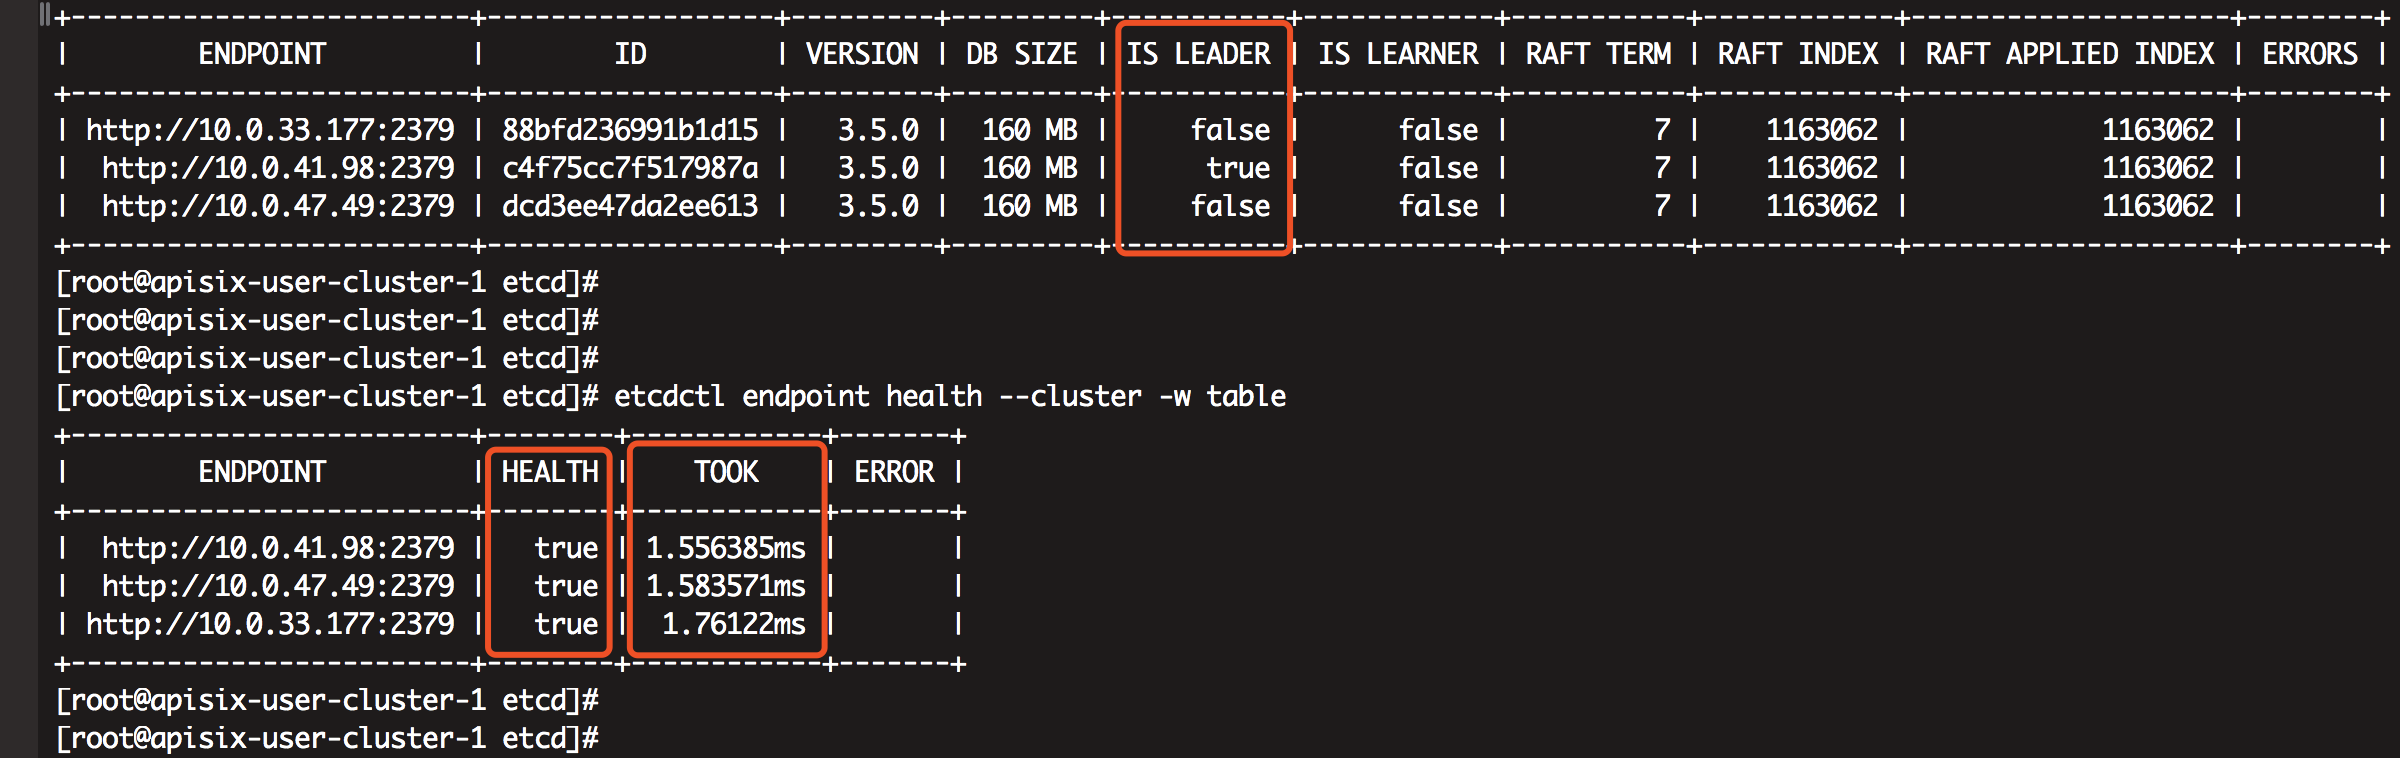
the etcd cluster have 3 nodes like this:etcd cluster is ok. And this etcd cluster support two apisix cluster(version: 2.8.0).

### Environment
- apisix version:2.8
- etcd version:3.5.0
- OS: aws linux ami 2
- OpenResty / Nginx version:openresty/1.19.9.1
- apisix-dashboard version, if have: have two , one is 2.8, another is 2.9.0
--
This is an automated message from the Apache Git Service.
To respond to the message, please log on to GitHub and use the
URL above to go to the specific comment.
To unsubscribe, e-mail: notifications-unsubscribe@apisix.apache.org
For queries about this service, please contact Infrastructure at:
users@infra.apache.org
[GitHub] [apisix] hepyu commented on issue #5692: request help: etcd high load, etcd high cpu usage, and "put /data_plane/server_info" have lots of "apply request took too long" error
Posted by GitBox <gi...@apache.org>.
hepyu commented on issue #5692:
URL: https://github.com/apache/apisix/issues/5692#issuecomment-990766775


   > I suspect the same direction as you, but I need to reproduce the problem. Or would you be willing to provide a flame graph, with the server_info plugin loaded and CPU and load high, to grab the flame graph and let us see what is wrong.
   >
   > you can make flame graph by OpenResty-Xray

   I am sorry, its our product env. And business is busy, there is no time to reproduce it for me.


--
This is an automated message from the Apache Git Service.
To respond to the message, please log on to GitHub and use the
URL above to go to the specific comment.

To unsubscribe, e-mail: notifications-unsubscribe@apisix.apache.org

For queries about this service, please contact Infrastructure at:
users@infra.apache.org
[GitHub] [apisix] hepyu commented on issue #5692: request help: etcd high load, etcd high cpu usage, and "put /data_plane/server_info" have lots of "apply request took too long" error
Posted by GitBox <gi...@apache.org>.
hepyu commented on issue #5692:
URL: https://github.com/apache/apisix/issues/5692#issuecomment-988636430


   Temporarily closed this issue.


--
This is an automated message from the Apache Git Service.
To respond to the message, please log on to GitHub and use the
URL above to go to the specific comment.

To unsubscribe, e-mail: notifications-unsubscribe@apisix.apache.org

For queries about this service, please contact Infrastructure at:
users@infra.apache.org
[GitHub] [apisix] tzssangglass commented on issue #5692: request help: etcd high load, etcd high cpu usage, and "put /data_plane/server_info" have lots of "apply request took too long" error
Posted by GitBox <gi...@apache.org>.
tzssangglass commented on issue #5692:
URL: https://github.com/apache/apisix/issues/5692#issuecomment-989722607


   I suspect the same direction as you, but I need to reproduce the problem.
   Or would you be willing to provide a flame graph, with the server_info plugin loaded and CPU and load high, to grab the flame graph and let us see what is wrong.

   you can make flame graph by OpenResty-Xray


--
This is an automated message from the Apache Git Service.
To respond to the message, please log on to GitHub and use the
URL above to go to the specific comment.

To unsubscribe, e-mail: notifications-unsubscribe@apisix.apache.org

For queries about this service, please contact Infrastructure at:
users@infra.apache.org
[GitHub] [apisix] hepyu commented on issue #5692: request help: etcd high load, etcd high cpu usage, and "put /data_plane/server_info" have lots of "apply request took too long" error
Posted by GitBox <gi...@apache.org>.
hepyu commented on issue #5692:
URL: https://github.com/apache/apisix/issues/5692#issuecomment-988633543


   disk is ok, I used ssd(gp3) of aws.

   I have solved this problem like this:
   disable pulgin "server-info".

   then, cpu usage and load of etcd became normal.

   I think this is a bug of apisix, at least improper use of etcd.


--
This is an automated message from the Apache Git Service.
To respond to the message, please log on to GitHub and use the
URL above to go to the specific comment.

To unsubscribe, e-mail: notifications-unsubscribe@apisix.apache.org

For queries about this service, please contact Infrastructure at:
users@infra.apache.org
[GitHub] [apisix] tzssangglass commented on issue #5692: request help: etcd high load, etcd high cpu usage, and "put /data_plane/server_info" have lots of "apply request took too long" error
Posted by GitBox <gi...@apache.org>.
tzssangglass commented on issue #5692:
URL: https://github.com/apache/apisix/issues/5692#issuecomment-986251113


   refer to: https://etcd.io/docs/v3.1/faq/#what-does-the-etcd-warning-apply-entries-took-too-long-mean

   I think it would be more appropriate to look at the etcd dimension for this issue.


--
This is an automated message from the Apache Git Service.
To respond to the message, please log on to GitHub and use the
URL above to go to the specific comment.

To unsubscribe, e-mail: notifications-unsubscribe@apisix.apache.org

For queries about this service, please contact Infrastructure at:
users@infra.apache.org
[GitHub] [apisix] tzssangglass commented on issue #5692: request help: etcd high load, etcd high cpu usage, and "put /data_plane/server_info" have lots of "apply request took too long" error
Posted by GitBox <gi...@apache.org>.
tzssangglass commented on issue #5692:
URL: https://github.com/apache/apisix/issues/5692#issuecomment-988807973


   > disk is ok, I used ssd(gp3) of aws.

   does your configuration meet the requirements of etcd? server info is only a low frequency operation of etcd.


--
This is an automated message from the Apache Git Service.
To respond to the message, please log on to GitHub and use the
URL above to go to the specific comment.

To unsubscribe, e-mail: notifications-unsubscribe@apisix.apache.org

For queries about this service, please contact Infrastructure at:
users@infra.apache.org
[GitHub] [apisix] hepyu commented on issue #5692: request help: etcd high load, etcd high cpu usage, and "put /data_plane/server_info" have lots of "apply request took too long" error
Posted by GitBox <gi...@apache.org>.
hepyu commented on issue #5692:
URL: https://github.com/apache/apisix/issues/5692#issuecomment-989646129


   > > disk is ok, I used ssd(gp3) of aws.
   >
   > does your configuration meet the requirements of etcd? server info is only a low frequency operation of etcd.

   Yes, my configuration meet the requirements of etcd. And the fact is that after I remove the server info plugin, the etcd load and CPU utilization returned to normal.
   Of course I know "server info is only a low frequency operation of etcd". And I am confused this so much, couldn't understand, but the fact is the fact.
   So my conclusion is that apisxi has a strange low-level bug here, at least a low-level mistake in the use of etcd.


   node1(4c8g, aws gp3 ssd):apisix-cluster1-1  etcd-1
   node2(4c8g, aws gp3 ssd):  apisix-cluster1-2  etcd-2
   node3(4c8g, aws gp3 ssd):  apisix-cluster2-1  etcd-3
   node4(4c8g, aws gp3 ssd):  apisix-cluster2-2

   And two apisix-dashboards is deployed on another new node(devops-admin-node), the use different apisix prefix in etcd.


--
This is an automated message from the Apache Git Service.
To respond to the message, please log on to GitHub and use the
URL above to go to the specific comment.

To unsubscribe, e-mail: notifications-unsubscribe@apisix.apache.org

For queries about this service, please contact Infrastructure at:
users@infra.apache.org
[GitHub] [apisix] hepyu closed issue #5692: request help: etcd high load, etcd high cpu usage, and "put /data_plane/server_info" have lots of "apply request took too long" error
Posted by GitBox <gi...@apache.org>.
hepyu closed issue #5692:
URL: https://github.com/apache/apisix/issues/5692


--
This is an automated message from the Apache Git Service.
To respond to the message, please log on to GitHub and use the
URL above to go to the specific comment.

To unsubscribe, e-mail: notifications-unsubscribe@apisix.apache.org

For queries about this service, please contact Infrastructure at:
users@infra.apache.org
[GitHub] [apisix] tokers commented on issue #5692: request help: etcd high load, etcd high cpu usage, and "put /data_plane/server_info" have lots of "apply request took too long" error
Posted by GitBox <gi...@apache.org>.
tokers commented on issue #5692:
URL: https://github.com/apache/apisix/issues/5692#issuecomment-986172247


   > the etcd cluster have 3 nodes, 2 of them has high load and cpu usage, but load and cpu usage of the third node is low, I am so confused:

   Do the 3 nodes have the same hardware configurations? Also, you may check out the file I/O utilizations.

   > 2.question-2: "put /data_plane/server_info" have lots of "apply request took too long" error

   What's the frequency settings for the `server-info` plugin, I remember the period is somewhat long (`60s`).


--
This is an automated message from the Apache Git Service.
To respond to the message, please log on to GitHub and use the
URL above to go to the specific comment.

To unsubscribe, e-mail: notifications-unsubscribe@apisix.apache.org

For queries about this service, please contact Infrastructure at:
users@infra.apache.org