You are viewing a plain text version of this content. The canonical link for it is here.
Posted to commits@echarts.apache.org by GitBox <gi...@apache.org> on 2021/10/06 15:17:01 UTC
[GitHub] [echarts] nhhaidee opened a new issue #15832: Render custom bar plot with log scale
nhhaidee opened a new issue #15832:
URL: https://github.com/apache/echarts/issues/15832


   ### Version
   5.2.1

   ### Steps to reproduce

   Please see attached file
   [custom_bar.zip](https://github.com/apache/echarts/files/7295189/custom_bar.zip)

         const colorList = [
           "#4f81bd",
           "#c0504d",
           "#9bbb59",
           "#604a7b",
           "#948a54",
           "#e46c0b",
         ];
         const data = [
           //start, end, height
           [10, 16, 300, "A"],
           [16, 18, 200, "B"],
           [18, 26, 350, "C"],
           [26, 32, 450.35, "D"],
           [40, 56, 600, "E"],
           [80, 90, 150, "F"],
         ].map(function (item, index) {
           return {
             value: item,
             itemStyle: {
               color: colorList[index],
             },
           };
         });
         option = {
           title: {
             text: "Profit",
             left: "center",
           },
           tooltip: {},
           xAxis: {
             scale: false,
             min: 1,
             max: 100,
           },
           dataZoom: [
             {
               type: "slider",
               show: false,
               filterMode: "none",
             },
             {
               type: "inside",
               filterMode: "none",
             },
           ],
           yAxis: {
             type: "log",
             min: 1,
   		      max: 1000,
             minorSplitLine: {
               show: true,
             },
           },
           series: [
             {
               type: "custom",
               renderItem: function (params, api) {
                 var yValue = api.value(2);
                 var start = api.coord([api.value(0), yValue]);
                 var x = start[0]
                 var y = start[1]
                 var width = api.size([api.value(1) - api.value(0)]);
                 var height = api.size([yValue]);
                 console.log(height)
                 return {
                   type: "rect",
                   shape: {
                     x: x,
                     y: y,
                     width: width[0],
                     height: height[0]
                   },
                   style: api.style(),
                 };
               },
               label: {
                 show: true,
                 position: "top",
               },
               dimensions: ["Start", "End", "Depth"],
               encode: {
                 x: [0, 1],
                 y: 2,
                 tooltip: [0, 1, 2],
                 itemName: 3,
               },
               data: data,
             },
           ],
         };

   ### What is expected?
   custom bar plot is rendered correctly

   ### What is actually happening?
   custom bar plot is not rendered correctly

   <!-- This issue is generated by echarts-issue-helper. DO NOT REMOVE -->
   <!-- This issue is in English. DO NOT REMOVE -->


--
This is an automated message from the Apache Git Service.
To respond to the message, please log on to GitHub and use the
URL above to go to the specific comment.

To unsubscribe, e-mail: commits-unsubscribe@echarts.apache.org

For queries about this service, please contact Infrastructure at:
users@infra.apache.org


---------------------------------------------------------------------
To unsubscribe, e-mail: commits-unsubscribe@echarts.apache.org
For additional commands, e-mail: commits-help@echarts.apache.org
[GitHub] [echarts] echarts-bot[bot] commented on issue #15832: Render custom bar plot with log scale
Posted by GitBox <gi...@apache.org>.
echarts-bot[bot] commented on issue #15832:
URL: https://github.com/apache/echarts/issues/15832#issuecomment-936477277


   Hi! We've received your issue and please be patient to get responded. 🎉
   The average response time is expected to be within one day for weekdays.

   In the meanwhile, please make sure that it contains **a minimum reproducible demo** and necessary **images** to illustrate. Otherwise, our committers will ask you to do so.

   *A minimum reproducible demo* should contain as little data and components as possible but can still illustrate your problem. This is the best way for us to reproduce it and solve the problem faster.

   You may also check out the [API](http://echarts.apache.org/api.html) and [chart option](http://echarts.apache.org/option.html) to get the answer.

   If you don't get helped for a long time (over a week) or have an urgent question to ask, you may also send an email to dev@echarts.apache.org. Please attach the issue link if it's a technical question.

   If you are interested in the project, you may also subscribe to our [mailing list](https://echarts.apache.org/en/maillist.html).

   Have a nice day! 🍵


--
This is an automated message from the Apache Git Service.
To respond to the message, please log on to GitHub and use the
URL above to go to the specific comment.

To unsubscribe, e-mail: commits-unsubscribe@echarts.apache.org

For queries about this service, please contact Infrastructure at:
users@infra.apache.org


---------------------------------------------------------------------
To unsubscribe, e-mail: commits-unsubscribe@echarts.apache.org
For additional commands, e-mail: commits-help@echarts.apache.org
[GitHub] [echarts] pissang edited a comment on issue #15832: Render custom bar plot with log scale
Posted by GitBox <gi...@apache.org>.
pissang edited a comment on issue #15832:
URL: https://github.com/apache/echarts/issues/15832#issuecomment-939710508


   @nhhaidee Hi, `api.size` is not usable in the non-linear axis like `log`. The description of `api.size` can be checked at https://echarts.apache.org/en/option.html#series-custom.renderItem.arguments.api.size.

   The underlying logic of `api.size` is quite simple:
   ```ts
   const p0 = api.coord([arbitraryX, arbitrary]);
   const p1 = api.coord([arbitraryX + size[0], arbitrary + size[1]])
   return [p1[0] - p0[0], p1[1] - p0[1]];
   ```

   So it's more like a utility method that assumes the axis is linear. For the non-linear axis, the returned size will depends on the picked `[arbitraryX, arbitrary]`. So this method becomes meaningless in this case.

   To fix this issue, as you can see, you can always use `api.coord` to calculate the size of rectangle:

   ```ts
   var start = api.coord([api.value(0), api.value(2)]);
   var end = api.coord([api.value(1), 1]);
   return {
             type: "rect",
             shape: {
               x: start[0],
               y: start[1],
               width: end[0] - start[0],
               height: end[1] - start[1]
             },
             style: api.style()
           };
   ```

   We will improve the doc to explain this point.


--
This is an automated message from the Apache Git Service.
To respond to the message, please log on to GitHub and use the
URL above to go to the specific comment.

To unsubscribe, e-mail: commits-unsubscribe@echarts.apache.org

For queries about this service, please contact Infrastructure at:
users@infra.apache.org


---------------------------------------------------------------------
To unsubscribe, e-mail: commits-unsubscribe@echarts.apache.org
For additional commands, e-mail: commits-help@echarts.apache.org
[GitHub] [echarts] nhhaidee commented on issue #15832: Render custom bar plot with log scale
Posted by GitBox <gi...@apache.org>.
nhhaidee commented on issue #15832:
URL: https://github.com/apache/echarts/issues/15832#issuecomment-938791740
@Ovilia Thank you for a quick response. This is feature that we need for our tool in which Echarts is the key component.
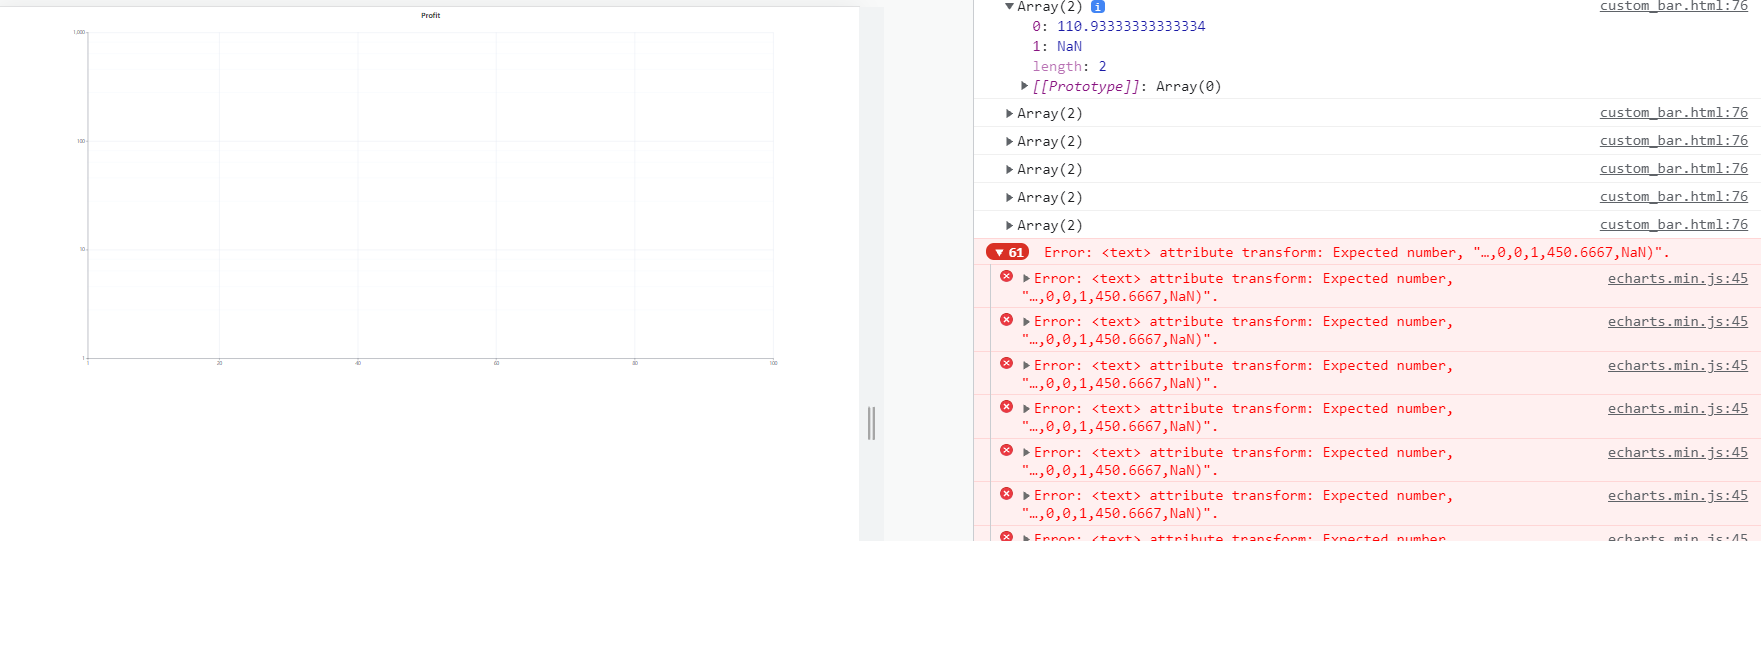
I have changed code as you said but I got error as picture, it seems the bug with log scale as there is no problem with normal scale (type: 'value")
The size[1] is returned with NaN
--
This is an automated message from the Apache Git Service.
To respond to the message, please log on to GitHub and use the
URL above to go to the specific comment.
To unsubscribe, e-mail: commits-unsubscribe@echarts.apache.org
For queries about this service, please contact Infrastructure at:
users@infra.apache.org
---------------------------------------------------------------------
To unsubscribe, e-mail: commits-unsubscribe@echarts.apache.org
For additional commands, e-mail: commits-help@echarts.apache.org
[GitHub] [echarts] nhhaidee closed issue #15832: Render custom bar plot with log scale
Posted by GitBox <gi...@apache.org>.
nhhaidee closed issue #15832:
URL: https://github.com/apache/echarts/issues/15832


--
This is an automated message from the Apache Git Service.
To respond to the message, please log on to GitHub and use the
URL above to go to the specific comment.

To unsubscribe, e-mail: commits-unsubscribe@echarts.apache.org

For queries about this service, please contact Infrastructure at:
users@infra.apache.org


---------------------------------------------------------------------
To unsubscribe, e-mail: commits-unsubscribe@echarts.apache.org
For additional commands, e-mail: commits-help@echarts.apache.org
[GitHub] [echarts] Ovilia commented on issue #15832: Render custom bar plot with log scale
Posted by GitBox <gi...@apache.org>.
Ovilia commented on issue #15832:
URL: https://github.com/apache/echarts/issues/15832#issuecomment-938364879


   It should be

   ```js
   renderItem: function (params, api) {
       var yValue = api.value(2);
       var start = api.coord([api.value(0), yValue]);
       var x = start[0]
       var y = start[1]
       var size = api.size([api.value(1) - api.value(0), yValue]);
       return {
       type: "rect",
       shape: {
           x: x,
           y: y,
           width: size[0],
           height: size[1]
       },
       style: api.style(),
       };
   },
   ```

   According to [api.size](https://echarts.apache.org/en/option.html#series-custom.renderItem.arguments.api.size), you should not omit the second parameter for log axis.

   > In some coordinate systems (for example, polar) or when log axis is used, the size is different in different point. So the second parameter is necessary to calculate size on the given point.


--
This is an automated message from the Apache Git Service.
To respond to the message, please log on to GitHub and use the
URL above to go to the specific comment.

To unsubscribe, e-mail: commits-unsubscribe@echarts.apache.org

For queries about this service, please contact Infrastructure at:
users@infra.apache.org


---------------------------------------------------------------------
To unsubscribe, e-mail: commits-unsubscribe@echarts.apache.org
For additional commands, e-mail: commits-help@echarts.apache.org
[GitHub] [echarts] nhhaidee edited a comment on issue #15832: Render custom bar plot with log scale
Posted by GitBox <gi...@apache.org>.
nhhaidee edited a comment on issue #15832:
URL: https://github.com/apache/echarts/issues/15832#issuecomment-941654456


   @pissang I found the reason why custom bar plot is distorted when zoom in. I missed ``` rectShape && ``` in the ```return``` line of renderItem function. I don't know what are the differences between 2 below codes, can you help explain this?

   ```
         return rectShape && {
           type: "rect",
           shape: rectShape,
           style: api.style()
         };

   ```

   And
   ```
         return {
           type: "rect",
           shape: rectShape,
           style: api.style()
         };
   ```
   The custom bar work wells with below codes:
   ```
         var start = api.coord([api.value(0), api.value(2)]);
         var end = api.coord([api.value(1), 1]);
         var rectShape = echarts.graphic.clipRectByRect(
           {
             x: start[0],
             y: start[1],
             width: end[0] - start[0],
             height: end[1] - start[1]
           },
           {
             x: params.coordSys.x,
             y: params.coordSys.y,
             width: params.coordSys.width,
             height: params.coordSys.height
           }
         );
         return rectShape && {
           type: "rect",
           shape: rectShape,
           style: api.style()
         };
   ```


--
This is an automated message from the Apache Git Service.
To respond to the message, please log on to GitHub and use the
URL above to go to the specific comment.

To unsubscribe, e-mail: commits-unsubscribe@echarts.apache.org

For queries about this service, please contact Infrastructure at:
users@infra.apache.org


---------------------------------------------------------------------
To unsubscribe, e-mail: commits-unsubscribe@echarts.apache.org
For additional commands, e-mail: commits-help@echarts.apache.org
[GitHub] [echarts] nhhaidee commented on issue #15832: Render custom bar plot with log scale
Posted by GitBox <gi...@apache.org>.
nhhaidee commented on issue #15832:
URL: https://github.com/apache/echarts/issues/15832#issuecomment-941244559


--
This is an automated message from the Apache Git Service.
To respond to the message, please log on to GitHub and use the
URL above to go to the specific comment.

To unsubscribe, e-mail: commits-unsubscribe@echarts.apache.org

For queries about this service, please contact Infrastructure at:
users@infra.apache.org


---------------------------------------------------------------------
To unsubscribe, e-mail: commits-unsubscribe@echarts.apache.org
For additional commands, e-mail: commits-help@echarts.apache.org
[GitHub] [echarts] pissang commented on issue #15832: Render custom bar plot with log scale
Posted by GitBox <gi...@apache.org>.
pissang commented on issue #15832:
URL: https://github.com/apache/echarts/issues/15832#issuecomment-939710508


   @nhhaidee Hi, `api.size` is not usable in the non-linear axis like `log`. The description of `api.size` can be checked at https://echarts.apache.org/en/option.html#series-custom.renderItem.arguments.api.size.

   The underlying logic of `api.size` is quite simple:
   ```ts
   const p0 = api.coord([arbitraryX, arbitrary]);
   const p1 = api.coord([arbitraryX + size[0], arbitrary + size[1]])
   return [p1[0] - p0[0], p1[1] - p0[1]];
   ```

   So it's more like a utility method that assumes the axis is linear. For the non-linear axis, the returned size will depends on the picked `[arbitraryX, arbitrary]`. So this method becomes meaningless in this case.

   To fix this issue, ss you can see, you can always use `api.coord` to calculate the size of rectangle:

   ```ts
   var start = api.coord([api.value(0), api.value(2)]);
   var end = api.coord([api.value(1), 1]);
   return {
             type: "rect",
             shape: {
               x: start[0],
               y: start[1],
               width: end[0] - start[0],
               height: end[1] - start[1]
             },
             style: api.style()
           };
   ```

   We will improve the doc to explain this point.


--
This is an automated message from the Apache Git Service.
To respond to the message, please log on to GitHub and use the
URL above to go to the specific comment.

To unsubscribe, e-mail: commits-unsubscribe@echarts.apache.org

For queries about this service, please contact Infrastructure at:
users@infra.apache.org


---------------------------------------------------------------------
To unsubscribe, e-mail: commits-unsubscribe@echarts.apache.org
For additional commands, e-mail: commits-help@echarts.apache.org
[GitHub] [echarts] nhhaidee commented on issue #15832: Render custom bar plot with log scale
Posted by GitBox <gi...@apache.org>.
nhhaidee commented on issue #15832:
URL: https://github.com/apache/echarts/issues/15832#issuecomment-944280185


   @Ovilia At line 426 `return` code

   zoom-in works well
   ```
         return rectShape && {
           type: "rect",
           shape: rectShape,
           style: api.style()
         };

   ```

   If you remove `rectShape &&`, custom bar will be distorted when zoom in. I don't know the reason why and what are the differences between 2 codes
   ```
         return {
           type: "rect",
           shape: rectShape,
           style: api.style()
         };
   ```


--
This is an automated message from the Apache Git Service.
To respond to the message, please log on to GitHub and use the
URL above to go to the specific comment.

To unsubscribe, e-mail: commits-unsubscribe@echarts.apache.org

For queries about this service, please contact Infrastructure at:
users@infra.apache.org


---------------------------------------------------------------------
To unsubscribe, e-mail: commits-unsubscribe@echarts.apache.org
For additional commands, e-mail: commits-help@echarts.apache.org
[GitHub] [echarts] nhhaidee commented on issue #15832: Render custom bar plot with log scale
Posted by GitBox <gi...@apache.org>.
nhhaidee commented on issue #15832:
URL: https://github.com/apache/echarts/issues/15832#issuecomment-936486501
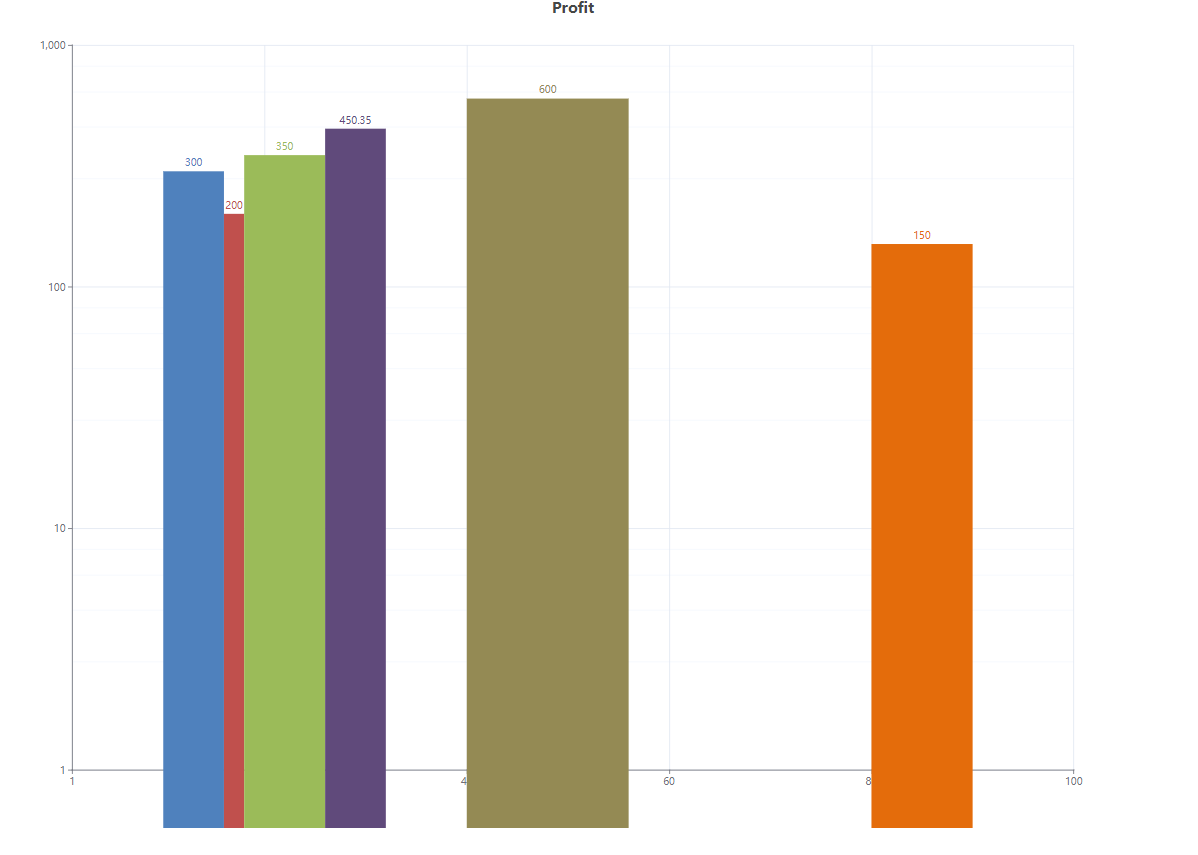
The custom bar plot:
--
This is an automated message from the Apache Git Service.
To respond to the message, please log on to GitHub and use the
URL above to go to the specific comment.
To unsubscribe, e-mail: commits-unsubscribe@echarts.apache.org
For queries about this service, please contact Infrastructure at:
users@infra.apache.org
---------------------------------------------------------------------
To unsubscribe, e-mail: commits-unsubscribe@echarts.apache.org
For additional commands, e-mail: commits-help@echarts.apache.org
[GitHub] [echarts] pissang edited a comment on issue #15832: Render custom bar plot with log scale
Posted by GitBox <gi...@apache.org>.
pissang edited a comment on issue #15832:
URL: https://github.com/apache/echarts/issues/15832#issuecomment-939710508


   @nhhaidee `api.size` is not usable in the non-linear axis like `log`. The description of `api.size` can be checked at https://echarts.apache.org/en/option.html#series-custom.renderItem.arguments.api.size.

   The underlying logic of `api.size` is quite simple:
   ```ts
   const p0 = api.coord([arbitraryX, arbitraryY]);
   const p1 = api.coord([arbitraryX + size[0], arbitraryY + size[1]])
   return [p1[0] - p0[0], p1[1] - p0[1]];
   ```

   So it's more like a utility method that assumes the axis is linear. For the non-linear axis, the returned size will depends on the picked `[arbitraryX, arbitrary]`. So this method becomes meaningless in this case.

   To fix this issue, as you can see, you can always use `api.coord` to calculate the size of rectangle:

   ```ts
   var start = api.coord([api.value(0), api.value(2)]);
   var end = api.coord([api.value(1), 1]);
   return {
             type: "rect",
             shape: {
               x: start[0],
               y: start[1],
               width: end[0] - start[0],
               height: end[1] - start[1]
             },
             style: api.style()
           };
   ```

   We will improve the doc to explain this point.


--
This is an automated message from the Apache Git Service.
To respond to the message, please log on to GitHub and use the
URL above to go to the specific comment.

To unsubscribe, e-mail: commits-unsubscribe@echarts.apache.org

For queries about this service, please contact Infrastructure at:
users@infra.apache.org


---------------------------------------------------------------------
To unsubscribe, e-mail: commits-unsubscribe@echarts.apache.org
For additional commands, e-mail: commits-help@echarts.apache.org
[GitHub] [echarts] pissang commented on issue #15832: Render custom bar plot with log scale
Posted by GitBox <gi...@apache.org>.
pissang commented on issue #15832:
URL: https://github.com/apache/echarts/issues/15832#issuecomment-940990741


   @nhhaidee Could you please provide an example?


--
This is an automated message from the Apache Git Service.
To respond to the message, please log on to GitHub and use the
URL above to go to the specific comment.

To unsubscribe, e-mail: commits-unsubscribe@echarts.apache.org

For queries about this service, please contact Infrastructure at:
users@infra.apache.org


---------------------------------------------------------------------
To unsubscribe, e-mail: commits-unsubscribe@echarts.apache.org
For additional commands, e-mail: commits-help@echarts.apache.org
[GitHub] [echarts] nhhaidee edited a comment on issue #15832: Render custom bar plot with log scale
Posted by GitBox <gi...@apache.org>.
nhhaidee edited a comment on issue #15832:
URL: https://github.com/apache/echarts/issues/15832#issuecomment-936486501
The result of custom bar plot as below image and to reproduce please download attached file

--
This is an automated message from the Apache Git Service.
To respond to the message, please log on to GitHub and use the
URL above to go to the specific comment.
To unsubscribe, e-mail: commits-unsubscribe@echarts.apache.org
For queries about this service, please contact Infrastructure at:
users@infra.apache.org
---------------------------------------------------------------------
To unsubscribe, e-mail: commits-unsubscribe@echarts.apache.org
For additional commands, e-mail: commits-help@echarts.apache.org
[GitHub] [echarts] nhhaidee commented on issue #15832: Render custom bar plot with log scale
Posted by GitBox <gi...@apache.org>.
nhhaidee commented on issue #15832:
URL: https://github.com/apache/echarts/issues/15832#issuecomment-941654456


   @pissang I found the reason why custom bar plot is distorted when zoom in. I missed ``` rectShape && ``` in the ```return``` line of renderItem function. I don't know what are the differences between 2 below codes, can you help explain this?

   ```
         return rectShape && {
           type: "rect",
           shape: rectShape,
           style: api.style()
         };

   ```

   And
   ```
         return {
           type: "rect",
           shape: rectShape,
           style: api.style()
         };
   ```
   The custom bar work wells with below codes:
   ```
   var start = api.coord([api.value(0), api.value(2)]);
         var end = api.coord([api.value(1), 1]);
         var rectShape = echarts.graphic.clipRectByRect(
           {
             x: start[0],
             y: start[1],
             width: end[0] - start[0],
             height: end[1] - start[1]
           },
           {
             x: params.coordSys.x,
             y: params.coordSys.y,
             width: params.coordSys.width,
             height: params.coordSys.height
           }
         );
         return rectShape && {
           type: "rect",
           shape: rectShape,
           style: api.style()
         };
   ```


--
This is an automated message from the Apache Git Service.
To respond to the message, please log on to GitHub and use the
URL above to go to the specific comment.

To unsubscribe, e-mail: commits-unsubscribe@echarts.apache.org

For queries about this service, please contact Infrastructure at:
users@infra.apache.org


---------------------------------------------------------------------
To unsubscribe, e-mail: commits-unsubscribe@echarts.apache.org
For additional commands, e-mail: commits-help@echarts.apache.org
[GitHub] [echarts] nhhaidee edited a comment on issue #15832: Render custom bar plot with log scale
Posted by GitBox <gi...@apache.org>.
nhhaidee edited a comment on issue #15832:
URL: https://github.com/apache/echarts/issues/15832#issuecomment-941654456


   @pissang I found the reason why custom bar plot is distorted when zoom in. I missed ``` rectShape && ``` in the ```return``` line of renderItem function. I don't know what are the differences between 2 below codes, can you help explain this?

   ```
         return rectShape && {
           type: "rect",
           shape: rectShape,
           style: api.style()
         };

   ```

   And
   ```
         return {
           type: "rect",
           shape: rectShape,
           style: api.style()
         };
   ```
   The custom bar work wells with below codes:
   ```
         var start = api.coord([api.value(0), api.value(2)]);
         var end = api.coord([api.value(1), 1]);
         var rectShape = echarts.graphic.clipRectByRect(
           {
             x: start[0],
             y: start[1],
             width: end[0] - start[0],
             height: end[1] - start[1]
           },
           {
             x: params.coordSys.x,
             y: params.coordSys.y,
             width: params.coordSys.width,
             height: params.coordSys.height
           }
         );
         return rectShape && {
           type: "rect",
           shape: rectShape,
           style: api.style()
         };
   ```


--
This is an automated message from the Apache Git Service.
To respond to the message, please log on to GitHub and use the
URL above to go to the specific comment.

To unsubscribe, e-mail: commits-unsubscribe@echarts.apache.org

For queries about this service, please contact Infrastructure at:
users@infra.apache.org


---------------------------------------------------------------------
To unsubscribe, e-mail: commits-unsubscribe@echarts.apache.org
For additional commands, e-mail: commits-help@echarts.apache.org
[GitHub] [echarts] nhhaidee commented on issue #15832: Render custom bar plot with log scale
Posted by GitBox <gi...@apache.org>.
nhhaidee commented on issue #15832:
URL: https://github.com/apache/echarts/issues/15832#issuecomment-940984023
@pissang and @Ovilia: The zoom in at left and right border is working well with ```clipRectByRect```. The chart generates plot by our tool which use Echarts is as below, it plots the large data and combing custom bar and line in the same plot with more than 29,000 value in Xaxis and it looks very good.
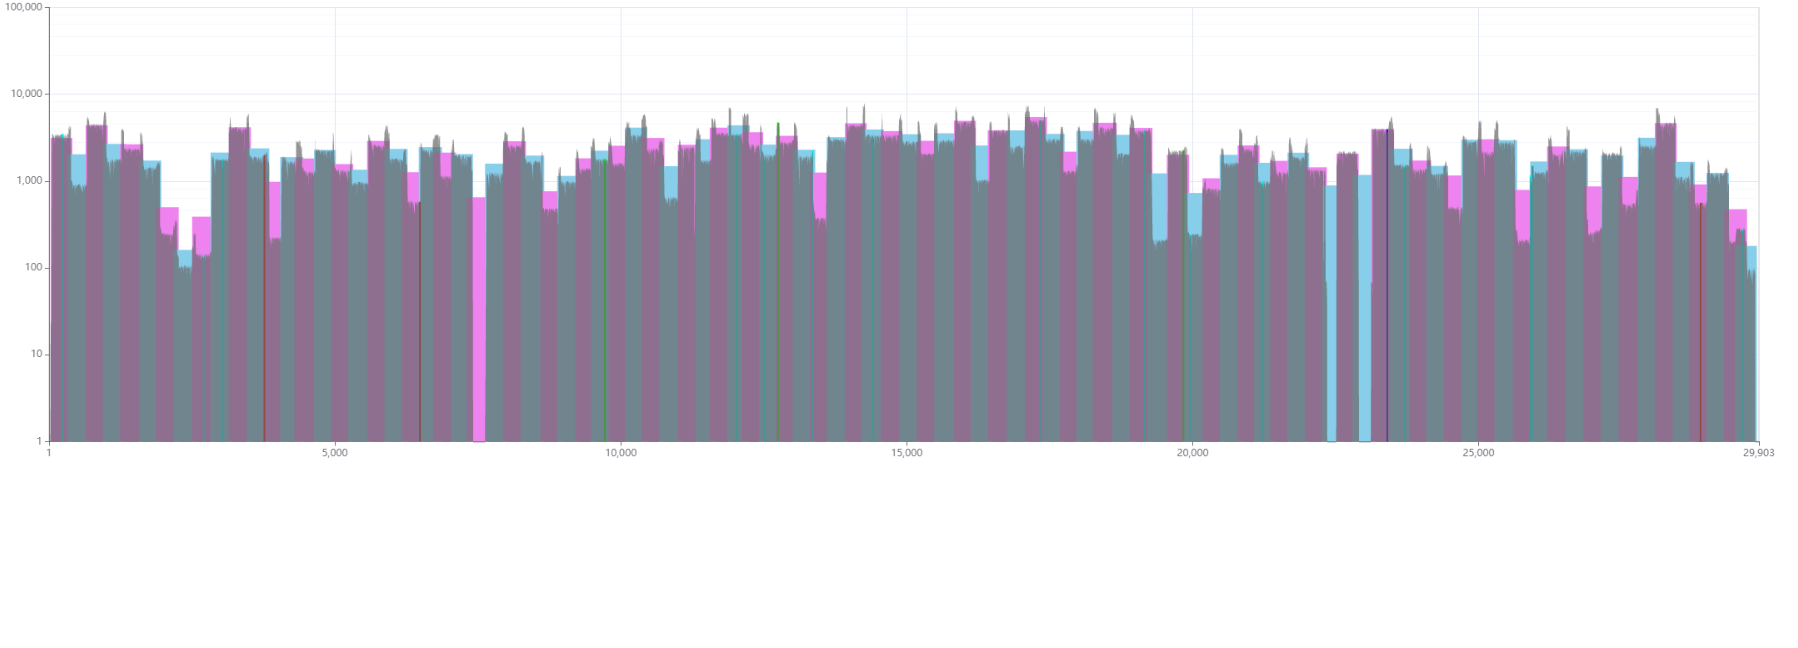
However, when I try to Zoom in, the custom bar is distorted, please see below picture and do you have any idea why this issue happens?
--
This is an automated message from the Apache Git Service.
To respond to the message, please log on to GitHub and use the
URL above to go to the specific comment.
To unsubscribe, e-mail: commits-unsubscribe@echarts.apache.org
For queries about this service, please contact Infrastructure at:
users@infra.apache.org
---------------------------------------------------------------------
To unsubscribe, e-mail: commits-unsubscribe@echarts.apache.org
For additional commands, e-mail: commits-help@echarts.apache.org
[GitHub] [echarts] pissang commented on issue #15832: Render custom bar plot with log scale
Posted by GitBox <gi...@apache.org>.
pissang commented on issue #15832:
URL: https://github.com/apache/echarts/issues/15832#issuecomment-940610680


   Have you used the `clipRectByRect` method as the example is using?


--
This is an automated message from the Apache Git Service.
To respond to the message, please log on to GitHub and use the
URL above to go to the specific comment.

To unsubscribe, e-mail: commits-unsubscribe@echarts.apache.org

For queries about this service, please contact Infrastructure at:
users@infra.apache.org


---------------------------------------------------------------------
To unsubscribe, e-mail: commits-unsubscribe@echarts.apache.org
For additional commands, e-mail: commits-help@echarts.apache.org
[GitHub] [echarts] nhhaidee commented on issue #15832: Render custom bar plot with log scale
Posted by GitBox <gi...@apache.org>.
nhhaidee commented on issue #15832:
URL: https://github.com/apache/echarts/issues/15832#issuecomment-939371410


   Hi @Ovilia

   Here is reproducible demo https://codesandbox.io/s/naughty-sun-k9zul
   The chart can not be rendered if
   ```
     yAxis: {
       type: "log",
       min: 1
     },
   ```
   It is OK if change type is value


--
This is an automated message from the Apache Git Service.
To respond to the message, please log on to GitHub and use the
URL above to go to the specific comment.

To unsubscribe, e-mail: commits-unsubscribe@echarts.apache.org

For queries about this service, please contact Infrastructure at:
users@infra.apache.org


---------------------------------------------------------------------
To unsubscribe, e-mail: commits-unsubscribe@echarts.apache.org
For additional commands, e-mail: commits-help@echarts.apache.org
[GitHub] [echarts] echarts-bot[bot] commented on issue #15832: Render custom bar plot with log scale
Posted by GitBox <gi...@apache.org>.
echarts-bot[bot] commented on issue #15832:
URL: https://github.com/apache/echarts/issues/15832#issuecomment-939239280


   @nhhaidee Please provide a minimum reproducible demo for the issue either with https://codepen.io/Ovilia/pen/dyYWXWM , https://www.makeapie.com/editor.html or https://codesandbox.io/s/mystifying-bash-2uthz.

   *A minimum reproducible demo* should contain as little data and components as possible but can still illustrate your problem. This is the best way for us to reproduce it and solve the problem faster.


--
This is an automated message from the Apache Git Service.
To respond to the message, please log on to GitHub and use the
URL above to go to the specific comment.

To unsubscribe, e-mail: commits-unsubscribe@echarts.apache.org

For queries about this service, please contact Infrastructure at:
users@infra.apache.org


---------------------------------------------------------------------
To unsubscribe, e-mail: commits-unsubscribe@echarts.apache.org
For additional commands, e-mail: commits-help@echarts.apache.org
[GitHub] [echarts] pissang edited a comment on issue #15832: Render custom bar plot with log scale
Posted by GitBox <gi...@apache.org>.
pissang edited a comment on issue #15832:
URL: https://github.com/apache/echarts/issues/15832#issuecomment-939710508


   @nhhaidee `api.size` is not usable in the non-linear axis like `log`. The description of `api.size` can be checked at https://echarts.apache.org/en/option.html#series-custom.renderItem.arguments.api.size.

   The underlying logic of `api.size` is quite simple:
   ```ts
   const p0 = api.coord([arbitraryX, arbitrary]);
   const p1 = api.coord([arbitraryX + size[0], arbitrary + size[1]])
   return [p1[0] - p0[0], p1[1] - p0[1]];
   ```

   So it's more like a utility method that assumes the axis is linear. For the non-linear axis, the returned size will depends on the picked `[arbitraryX, arbitrary]`. So this method becomes meaningless in this case.

   To fix this issue, as you can see, you can always use `api.coord` to calculate the size of rectangle:

   ```ts
   var start = api.coord([api.value(0), api.value(2)]);
   var end = api.coord([api.value(1), 1]);
   return {
             type: "rect",
             shape: {
               x: start[0],
               y: start[1],
               width: end[0] - start[0],
               height: end[1] - start[1]
             },
             style: api.style()
           };
   ```

   We will improve the doc to explain this point.


--
This is an automated message from the Apache Git Service.
To respond to the message, please log on to GitHub and use the
URL above to go to the specific comment.

To unsubscribe, e-mail: commits-unsubscribe@echarts.apache.org

For queries about this service, please contact Infrastructure at:
users@infra.apache.org


---------------------------------------------------------------------
To unsubscribe, e-mail: commits-unsubscribe@echarts.apache.org
For additional commands, e-mail: commits-help@echarts.apache.org
[GitHub] [echarts] nhhaidee commented on issue #15832: Render custom bar plot with log scale
Posted by GitBox <gi...@apache.org>.
nhhaidee commented on issue #15832:
URL: https://github.com/apache/echarts/issues/15832#issuecomment-941244559


   @pissang Please see below is an example to reproduce the problem

   https://codesandbox.io/s/optimistic-hertz-q8edp


--
This is an automated message from the Apache Git Service.
To respond to the message, please log on to GitHub and use the
URL above to go to the specific comment.

To unsubscribe, e-mail: commits-unsubscribe@echarts.apache.org

For queries about this service, please contact Infrastructure at:
users@infra.apache.org


---------------------------------------------------------------------
To unsubscribe, e-mail: commits-unsubscribe@echarts.apache.org
For additional commands, e-mail: commits-help@echarts.apache.org
[GitHub] [echarts] nhhaidee commented on issue #15832: Render custom bar plot with log scale
Posted by GitBox <gi...@apache.org>.
nhhaidee commented on issue #15832:
URL: https://github.com/apache/echarts/issues/15832#issuecomment-940515882
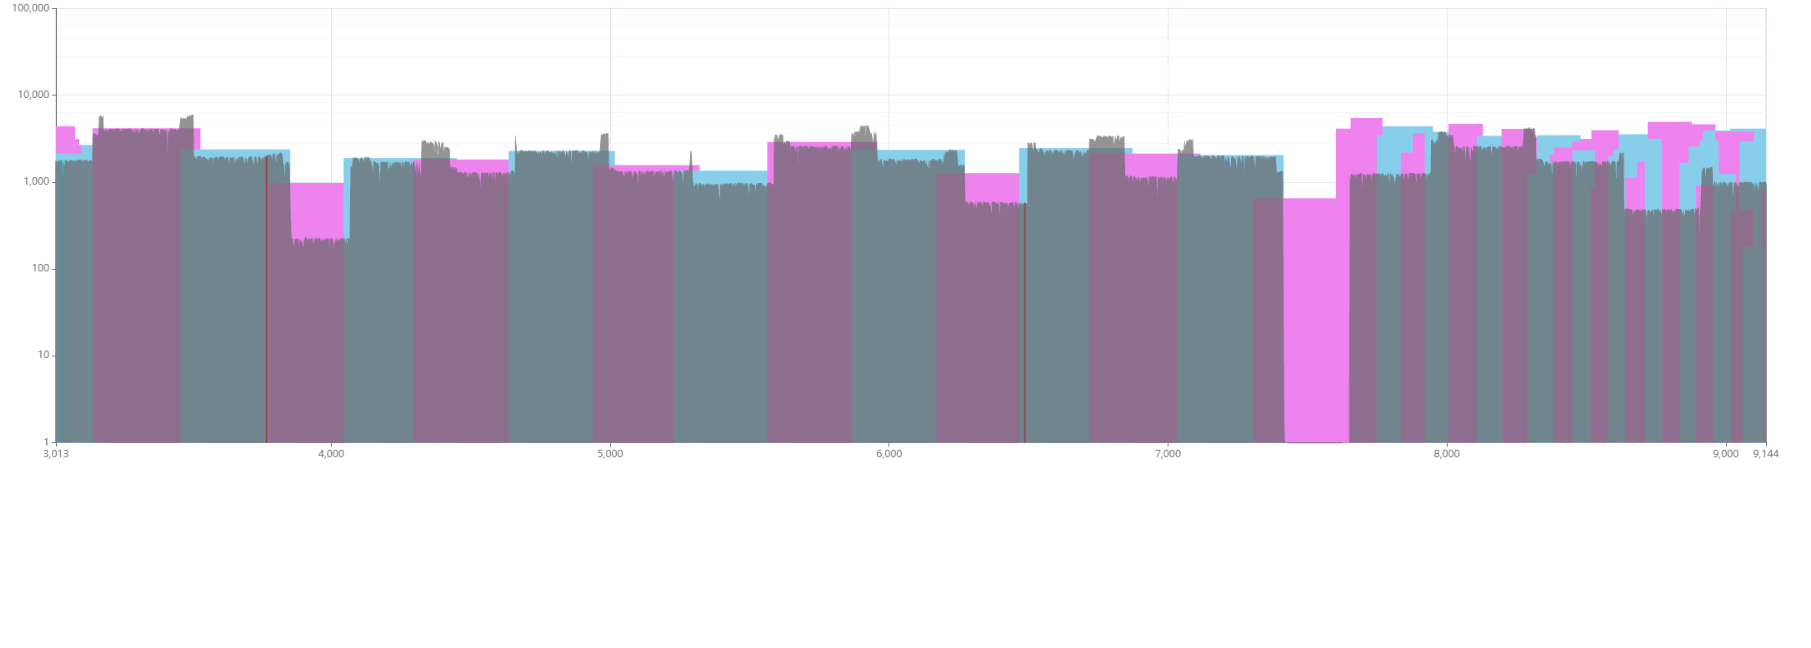
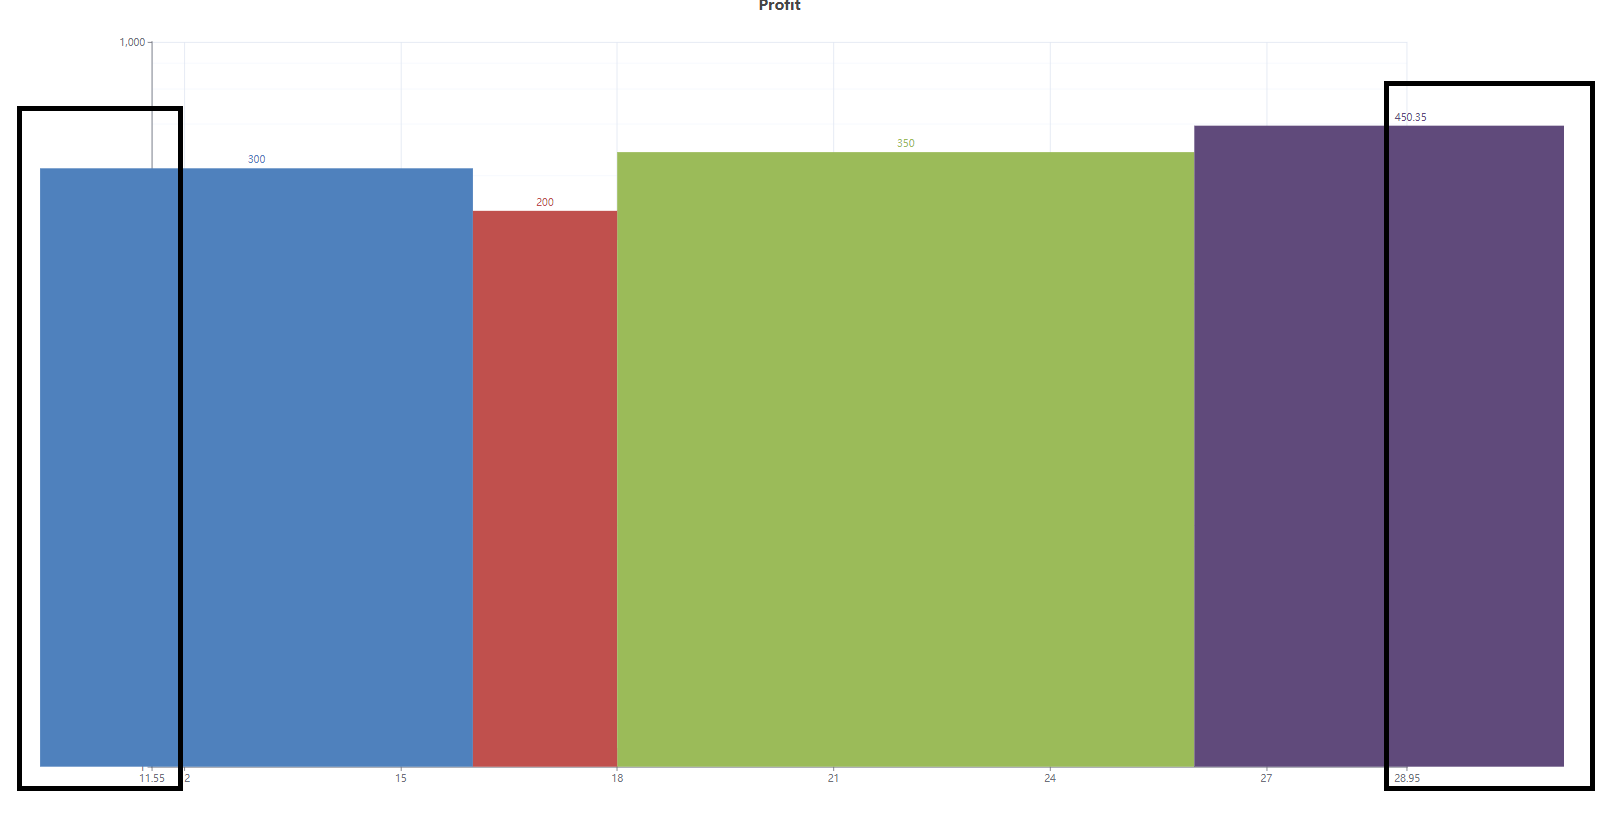
Thank @Ovilia and @pissang for great support. I can plot custom bar with our tool now in both linear and log scale. However, there is an issue when I try zoom in chart (please see picture). As you can see at the right and left border of the chart, I would expected the zoom is fixed within the width of chart only.
I would like to have zoom like this: https://echarts.apache.org/examples/en/editor.html?c=custom-profile
--
This is an automated message from the Apache Git Service.
To respond to the message, please log on to GitHub and use the
URL above to go to the specific comment.
To unsubscribe, e-mail: commits-unsubscribe@echarts.apache.org
For queries about this service, please contact Infrastructure at:
users@infra.apache.org
---------------------------------------------------------------------
To unsubscribe, e-mail: commits-unsubscribe@echarts.apache.org
For additional commands, e-mail: commits-help@echarts.apache.org
[GitHub] [echarts] pissang edited a comment on issue #15832: Render custom bar plot with log scale
Posted by GitBox <gi...@apache.org>.
pissang edited a comment on issue #15832:
URL: https://github.com/apache/echarts/issues/15832#issuecomment-939710508


   @nhhaidee `api.size` is not usable in the non-linear axis like `log`. The description of `api.size` can be checked at https://echarts.apache.org/en/option.html#series-custom.renderItem.arguments.api.size.

   The underlying logic of `api.size` is quite simple:
   ```ts
   const p0 = api.coord([arbitraryX, arbitraryY]);
   const p1 = api.coord([arbitraryX + size[0], arbitraryY + size[1]])
   return [p1[0] - p0[0], p1[1] - p0[1]];
   ```

   So it's more like a utility method that assumes the axis is linear. For the non-linear axis, the returned size will depends on the picked `[arbitraryX, arbitraryY]`. So this method becomes meaningless in this case.

   To fix this issue, as you can see, you can always use `api.coord` to calculate the size of rectangle:

   ```ts
   var start = api.coord([api.value(0), api.value(2)]);
   var end = api.coord([api.value(1), 1]);
   return {
             type: "rect",
             shape: {
               x: start[0],
               y: start[1],
               width: end[0] - start[0],
               height: end[1] - start[1]
             },
             style: api.style()
           };
   ```

   We will improve the doc to explain this point.


--
This is an automated message from the Apache Git Service.
To respond to the message, please log on to GitHub and use the
URL above to go to the specific comment.

To unsubscribe, e-mail: commits-unsubscribe@echarts.apache.org

For queries about this service, please contact Infrastructure at:
users@infra.apache.org


---------------------------------------------------------------------
To unsubscribe, e-mail: commits-unsubscribe@echarts.apache.org
For additional commands, e-mail: commits-help@echarts.apache.org
[GitHub] [echarts] Ovilia commented on issue #15832: Render custom bar plot with log scale
Posted by GitBox <gi...@apache.org>.
Ovilia commented on issue #15832:
URL: https://github.com/apache/echarts/issues/15832#issuecomment-939691896


   Marked to be a bug.


--
This is an automated message from the Apache Git Service.
To respond to the message, please log on to GitHub and use the
URL above to go to the specific comment.

To unsubscribe, e-mail: commits-unsubscribe@echarts.apache.org

For queries about this service, please contact Infrastructure at:
users@infra.apache.org


---------------------------------------------------------------------
To unsubscribe, e-mail: commits-unsubscribe@echarts.apache.org
For additional commands, e-mail: commits-help@echarts.apache.org
[GitHub] [echarts] pissang edited a comment on issue #15832: Render custom bar plot with log scale
Posted by GitBox <gi...@apache.org>.
pissang edited a comment on issue #15832:
URL: https://github.com/apache/echarts/issues/15832#issuecomment-939710508


   @nhhaidee `api.size` is not usable in the non-linear axis like `log`. The description of `api.size` can be checked at https://echarts.apache.org/en/option.html#series-custom.renderItem.arguments.api.size.

   The underlying logic of `api.size` is quite simple:
   ```ts
   const p0 = api.coord([arbitraryX, arbitraryY]);
   const p1 = api.coord([arbitraryX + size[0], arbitraryY + size[1]])
   return [p1[0] - p0[0], p1[1] - p0[1]];
   ```

   So it's more like a utility method that assumes the axis is linear. For the non-linear axis, the returned size will depends on the picked `[arbitraryX, arbitraryY]`. And this method becomes meaningless.

   To fix this issue, as you can see, you can always use `api.coord` to calculate the size of rectangle:

   ```ts
   var start = api.coord([api.value(0), api.value(2)]);
   var end = api.coord([api.value(1), 1]);
   return {
             type: "rect",
             shape: {
               x: start[0],
               y: start[1],
               width: end[0] - start[0],
               height: end[1] - start[1]
             },
             style: api.style()
           };
   ```

   We will improve the doc to explain this point.


--
This is an automated message from the Apache Git Service.
To respond to the message, please log on to GitHub and use the
URL above to go to the specific comment.

To unsubscribe, e-mail: commits-unsubscribe@echarts.apache.org

For queries about this service, please contact Infrastructure at:
users@infra.apache.org


---------------------------------------------------------------------
To unsubscribe, e-mail: commits-unsubscribe@echarts.apache.org
For additional commands, e-mail: commits-help@echarts.apache.org