You are viewing a plain text version of this content. The canonical link for it is here.
Posted to notifications@apisix.apache.org by GitBox <gi...@apache.org> on 2021/09/28 08:55:35 UTC
[GitHub] [apisix-ingress-controller] Sindweller opened a new issue #696: request help: metrics was exposed but not exist in Prometheus
Sindweller opened a new issue #696:
URL: https://github.com/apache/apisix-ingress-controller/issues/696


   ### Issue description
   Take `sync_operation_total` as an example:
   ```
   func (c *collector) IncrSyncOperation(resource, result string) {
   	c.syncOperation.With(prometheus.Labels{
   		"resource": resource,
   		"result":   result,
   	}).Inc()
   	log.Infow("-------sync operation-----")
   	log.Infow(resource)
   	log.Infow(result)
   }
   ```
   I add some log output to see whether the program reaches this function. And I got some output like:
   ```
   2021-09-28T16:34:55+08:00	info	metrics/prometheus.go:226	-------sync operation-----
   2021-09-28T16:34:55+08:00	info	metrics/prometheus.go:227	endpoints
   2021-09-28T16:34:55+08:00	info	metrics/prometheus.go:228	success
   ```
   So it seems there's an endpoint sync operation exist and has been synced successful.
   But there's still only a single record exist in Prometheus:
   ```
   # HELP apisix_ingress_controller_sync_operation_total Number of sync operations
   # TYPE apisix_ingress_controller_sync_operation_total counter
   apisix_ingress_controller_sync_operation_total{controller_namespace="default",controller_pod="",resource="schema",result="success"} 1
   ```
   **There's no `endpoint` in the record. What's the problem it might be?**
   Related  PR:  #670
   (There's no `events_total` and `check_cluster_health_total` as well, even the log outputs
   ```
   2021-09-28T15:11:18+08:00	info	metrics/prometheus.go:242	-------event------
   2021-09-28T15:11:18+08:00	info	metrics/prometheus.go:243	pod
   2021-09-28T15:11:18+08:00	info	metrics/prometheus.go:244	add
   ```
   )


--
This is an automated message from the Apache Git Service.
To respond to the message, please log on to GitHub and use the
URL above to go to the specific comment.

To unsubscribe, e-mail: notifications-unsubscribe@apisix.apache.org

For queries about this service, please contact Infrastructure at:
users@infra.apache.org
[GitHub] [apisix-ingress-controller] Sindweller closed issue #696: request help: metrics was exposed but not exist in Prometheus
Posted by GitBox <gi...@apache.org>.
Sindweller closed issue #696:
URL: https://github.com/apache/apisix-ingress-controller/issues/696


--
This is an automated message from the Apache Git Service.
To respond to the message, please log on to GitHub and use the
URL above to go to the specific comment.

To unsubscribe, e-mail: notifications-unsubscribe@apisix.apache.org

For queries about this service, please contact Infrastructure at:
users@infra.apache.org
[GitHub] [apisix-ingress-controller] tokers commented on issue #696: request help: metrics was exposed but not exist in Prometheus
Posted by GitBox <gi...@apache.org>.
tokers commented on issue #696:
URL: https://github.com/apache/apisix-ingress-controller/issues/696#issuecomment-929105842


   Not sure whether this is due to the inappropriate settings about the prom http handler.

   https://github.com/apache/apisix-ingress-controller/blob/master/pkg/api/router/router.go#L43

   You may try to have a closer look about the use of prom http handler.


--
This is an automated message from the Apache Git Service.
To respond to the message, please log on to GitHub and use the
URL above to go to the specific comment.

To unsubscribe, e-mail: notifications-unsubscribe@apisix.apache.org

For queries about this service, please contact Infrastructure at:
users@infra.apache.org
[GitHub] [apisix-ingress-controller] Sindweller commented on issue #696: request help: metrics was exposed but not exist in Prometheus
Posted by GitBox <gi...@apache.org>.
Sindweller commented on issue #696:
URL: https://github.com/apache/apisix-ingress-controller/issues/696#issuecomment-930027934
> Not sure whether this is due to the inappropriate settings about the prom http handler.
>
> https://github.com/apache/apisix-ingress-controller/blob/master/pkg/api/router/router.go#L43
>
> You may try to have a closer look about the use of prom http handler.
I think I've found the reason. Since I noticed that the exist metrics are all exposed in `./pkg/apisix` and the leader consistent to be 0. It seems the `metricsCollector: metrics.NewPrometheusCollector(),` in `cluster.go` has _overwrite_ (or some else term to describe this condition) the same one in `controller.go`.
So I currently annotate the `metricCollector` in `cluster.go` and those calling in `./pkg/apisix`
```
c := &cluster{
name: o.Name,
baseURL: o.BaseURL,
baseURLHost: u.Host,
...
// metricsCollector: metrics.NewPrometheusCollector(),
}
```
And keep this in `controller.go` and `./pkg/ingress`
```
c := &Controller{
name: podName,
namespace: podNamespace,
cfg: cfg,
apiServer: apiSrv,
apisix: client,
metricsCollector: metrics.NewPrometheusCollector(),
...
}
```
And some metrics like `events_total` have appeared in prometheus.
A quickly preview in grafana of those missing metrics:
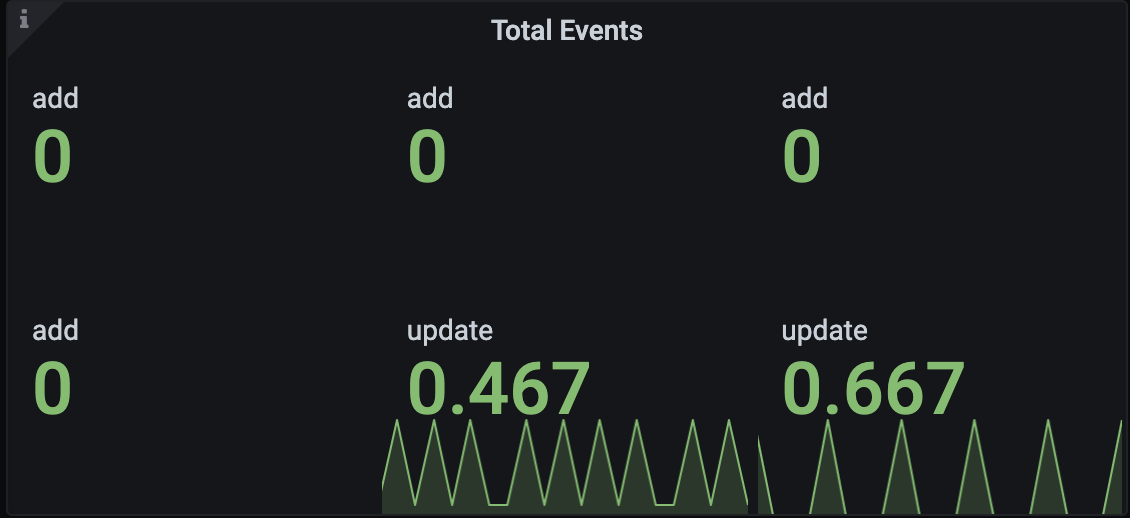
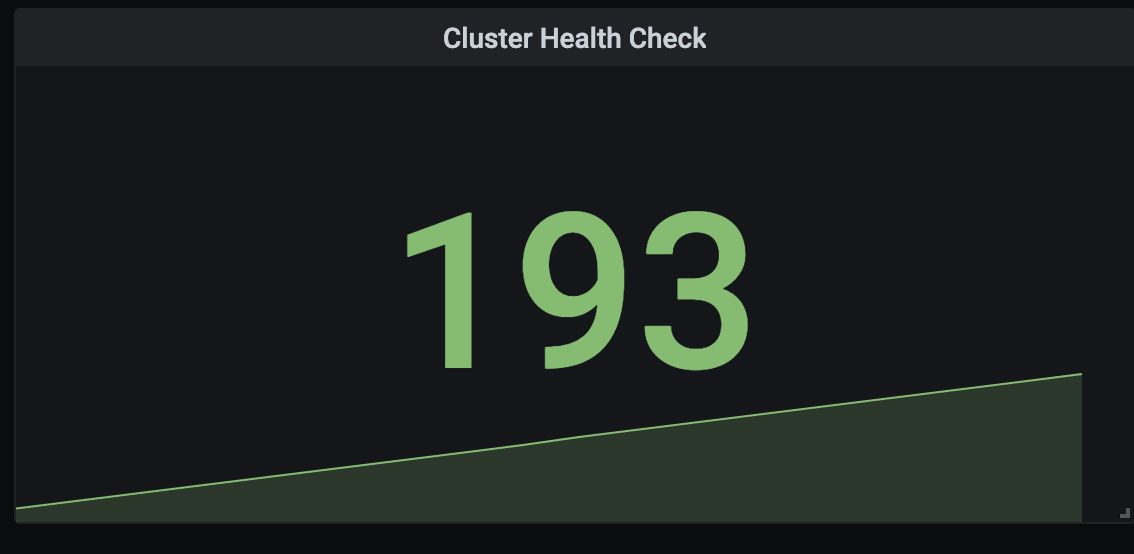
Could you please point out my mistakes in coding and the correct way to instantiate the `metricCollector` in both `./pkg/apisix/cluster.go` and `./pkg/ingress/controller.go`?
--
This is an automated message from the Apache Git Service.
To respond to the message, please log on to GitHub and use the
URL above to go to the specific comment.
To unsubscribe, e-mail: notifications-unsubscribe@apisix.apache.org
For queries about this service, please contact Infrastructure at:
users@infra.apache.org
[GitHub] [apisix-ingress-controller] tokers commented on issue #696: request help: metrics was exposed but not exist in Prometheus
Posted by GitBox <gi...@apache.org>.
tokers commented on issue #696:
URL: https://github.com/apache/apisix-ingress-controller/issues/696#issuecomment-929105842


   Not sure whether this is due to the inappropriate settings about the prom http handler.

   https://github.com/apache/apisix-ingress-controller/blob/master/pkg/api/router/router.go#L43

   You may try to have a closer look about the use of prom http handler.


--
This is an automated message from the Apache Git Service.
To respond to the message, please log on to GitHub and use the
URL above to go to the specific comment.

To unsubscribe, e-mail: notifications-unsubscribe@apisix.apache.org

For queries about this service, please contact Infrastructure at:
users@infra.apache.org
[GitHub] [apisix-ingress-controller] tokers commented on issue #696: request help: metrics was exposed but not exist in Prometheus
Posted by GitBox <gi...@apache.org>.
tokers commented on issue #696:
URL: https://github.com/apache/apisix-ingress-controller/issues/696#issuecomment-930097187
> > Not sure whether this is due to the inappropriate settings about the prom http handler.
> > https://github.com/apache/apisix-ingress-controller/blob/master/pkg/api/router/router.go#L43
> > You may try to have a closer look about the use of prom http handler.
>
> I think I've found the reason. Since I noticed that the exist metrics are all exposed in `./pkg/apisix` and the leader consistent to be 0. It seems the `metricsCollector: metrics.NewPrometheusCollector(),` in `cluster.go` has _overwrite_ (or some else term to describe this condition) the same one in `controller.go`. So I currently annotate the `metricCollector` in `cluster.go` and those calling in `./pkg/apisix`
>
> ```
> c := &cluster{
> name: o.Name,
> baseURL: o.BaseURL,
> baseURLHost: u.Host,
> ...
> // metricsCollector: metrics.NewPrometheusCollector(),
> }
> ```
>
> And keep this in `controller.go` and `./pkg/ingress`
>
> ```
> c := &Controller{
> name: podName,
> namespace: podNamespace,
> cfg: cfg,
> apiServer: apiSrv,
> apisix: client,
> metricsCollector: metrics.NewPrometheusCollector(),
> ...
> }
> ```
>
> And some metrics like `events_total` have appeared in prometheus. A quickly preview in grafana of those missing metrics: 
>
> 
>
> Could you please point out my mistakes in coding and the correct way to instantiate the `metricCollector` in both `./pkg/apisix/cluster.go` and `./pkg/ingress/controller.go`?
You can just instantiate the metrics collector in the controller and just pass that one to cluster.
--
This is an automated message from the Apache Git Service.
To respond to the message, please log on to GitHub and use the
URL above to go to the specific comment.
To unsubscribe, e-mail: notifications-unsubscribe@apisix.apache.org
For queries about this service, please contact Infrastructure at:
users@infra.apache.org
[GitHub] [apisix-ingress-controller] Sindweller commented on issue #696: request help: metrics was exposed but not exist in Prometheus
Posted by GitBox <gi...@apache.org>.
Sindweller commented on issue #696:
URL: https://github.com/apache/apisix-ingress-controller/issues/696#issuecomment-997196346


   should be closed as it's fixed in #670


--
This is an automated message from the Apache Git Service.
To respond to the message, please log on to GitHub and use the
URL above to go to the specific comment.

To unsubscribe, e-mail: notifications-unsubscribe@apisix.apache.org

For queries about this service, please contact Infrastructure at:
users@infra.apache.org
[GitHub] [apisix-ingress-controller] Sindweller commented on issue #696: request help: metrics was exposed but not exist in Prometheus
Posted by GitBox <gi...@apache.org>.
Sindweller commented on issue #696:
URL: https://github.com/apache/apisix-ingress-controller/issues/696#issuecomment-930027934
> Not sure whether this is due to the inappropriate settings about the prom http handler.
>
> https://github.com/apache/apisix-ingress-controller/blob/master/pkg/api/router/router.go#L43
>
> You may try to have a closer look about the use of prom http handler.
I think I've found the reason. Since I noticed that the exist metrics are all exposed in `./pkg/apisix` and the leader consistent to be 0. It seems the `metricsCollector: metrics.NewPrometheusCollector(),` in `cluster.go` has _overwrite_ (or some else term to describe this condition) the same one in `controller.go`.
So I currently annotate the `metricCollector` in `cluster.go` and those calling in `./pkg/apisix`
```
c := &cluster{
name: o.Name,
baseURL: o.BaseURL,
baseURLHost: u.Host,
...
// metricsCollector: metrics.NewPrometheusCollector(),
}
```
And keep this in `controller.go` and `./pkg/ingress`
```
c := &Controller{
name: podName,
namespace: podNamespace,
cfg: cfg,
apiServer: apiSrv,
apisix: client,
metricsCollector: metrics.NewPrometheusCollector(),
...
}
```
And some metrics like `events_total` have appeared in prometheus.
A quickly preview in grafana of those missing metrics:


Could you please point out my mistakes in coding and the correct way to instantiate the `metricCollector` in both `./pkg/apisix/cluster.go` and `./pkg/ingress/controller.go`?
--
This is an automated message from the Apache Git Service.
To respond to the message, please log on to GitHub and use the
URL above to go to the specific comment.
To unsubscribe, e-mail: notifications-unsubscribe@apisix.apache.org
For queries about this service, please contact Infrastructure at:
users@infra.apache.org