You are viewing a plain text version of this content. The canonical link for it is here.
Posted to commits@echarts.apache.org by GitBox <gi...@apache.org> on 2022/08/24 03:52:04 UTC
[GitHub] [echarts] mansion-sun opened a new issue, #17560: [Bug] 折线图绘制精度问题,小数位被忽略
mansion-sun opened a new issue, #17560:
URL: https://github.com/apache/echarts/issues/17560
### Version
^5.2.2
### Link to Minimal Reproduction
https://codesandbox.io/s/zen-spence-q6c6fw?file=/src/index.js
### Steps to Reproduce
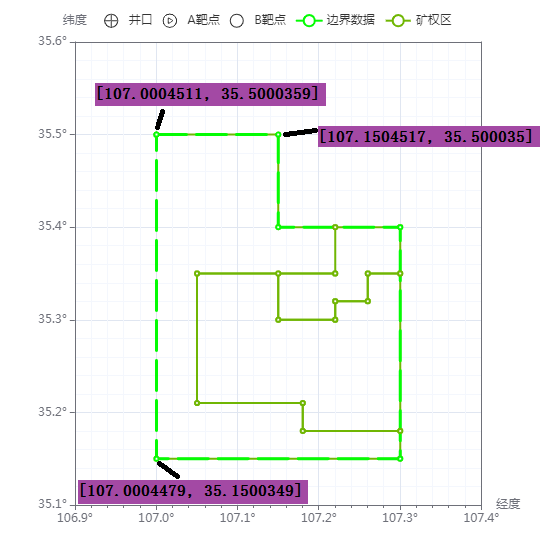
使用折线图绘制小数位数包含小数点后七位的折线图
### Current Behavior
const data = [
[107.0004511, 35.5000359],
[107.1504517, 35.500035],
[107.1504508, 35.4000348],
[107.3004514, 35.4000338],
[107.3004492, 35.1500331],
[107.0004479, 35.1500349],
[107.0004511, 35.5000359]
];
const dataset = data.map(m => ({ value: m, }));
option = {
tooltip: {
formatter: function (param) {
param = param[0] || param;
return [
`${param?.data.name} (${param?.seriesName})<hr size=1 style="margin: 3px 0">`,
'经度:' + param.data.value[0] + '°;',
'纬度:' + param.data.value[1] + '°<br/>',
].join('');
}
},
xAxis: [
{
min: value => (value?.min - 0.1).toFixed(1),
max: value => (value?.max + 0.1).toFixed(1),
name: "经度",
axisLabel: {
formatter: function (value, index) {
return value.toFixed(1) + '°';
}
},
minorTick: {
show: true
},
minorSplitLine: {
show: true
}
},
{
min: value => (value?.min - 0.1).toFixed(1),
max: value => (value?.max + 0.1).toFixed(1),
minInterval: 0.0000001,
maxInterval: 10,
}
],
yAxis: [
{
min: value => (value?.min - 0.1).toFixed(1),
max: value => (value?.max + 0.1).toFixed(1),
name: "纬度",
axisLabel: {
formatter: function (value, index) {
return value.toFixed(1) + '°';
}
},
minorSplitLine: {
show: true,
}
},
{
min: value => (value?.min - 0.1).toFixed(1),
max: value => (value?.max + 0.1).toFixed(1),
minInterval: 0.0000001,
maxInterval: 10,
}
],
series: [
{
data: dataset,
type: 'line'
}
]
};
### Expected Behavior
如上图,三个点位可以通过小数点区分微小差别
### Environment
```markdown
- OS:window7
- Browser:Chrome版本 91.0.4472.106(正式版本) (64 位)
- Framework:react"^17.0.2"
```
### Any additional comments?
_No response_
--
This is an automated message from the Apache Git Service.
To respond to the message, please log on to GitHub and use the
URL above to go to the specific comment.
To unsubscribe, e-mail: commits-unsubscribe@echarts.apache.org.apache.org
For queries about this service, please contact Infrastructure at:
users@infra.apache.org
---------------------------------------------------------------------
To unsubscribe, e-mail: commits-unsubscribe@echarts.apache.org
For additional commands, e-mail: commits-help@echarts.apache.org
[GitHub] [echarts] echarts-bot[bot] commented on issue #17560: [Bug] 折线图绘制精度问题,小数位被忽略
Posted by GitBox <gi...@apache.org>.
echarts-bot[bot] commented on issue #17560:
URL: https://github.com/apache/echarts/issues/17560#issuecomment-1225156727
@mansion-sun It seems you are not using English, I've helped translate the content automatically. To make your issue understood by more people and get helped, we'd like to suggest using English next time. 🤗
<details><summary><b>TRANSLATED</b></summary><br>
**TITLE**
[Bug] Line chart drawing accuracy issue, decimal places are ignored
**BODY**
### Version
^5.2.2
### Link to Minimal Reproduction
https://codesandbox.io/s/zen-spence-q6c6fw?file=/src/index.js
### Steps to Reproduce
Use a line chart to draw a line chart with seven decimal places
### Current Behavior
const data = [
[107.0004511, 35.5000359],
[107.1504517, 35.500035],
[107.1504508, 35.4000348],
[107.3004514, 35.4000338],
[107.3004492, 35.1500331],
[107.0004479, 35.1500349],
[107.0004511, 35.5000359]
];
const dataset = data.map(m => ({ value: m, }));
option = {
tooltip: {
formatter: function (param) {
param = param[0] || param;
return [
`${param?.data.name} (${param?.seriesName})<hr size=1 style="margin: 3px 0">`,
'longitude:' + param.data.value[0] + '°;',
'Latitude:' + param.data.value[1] + '°<br/>',
].join('');
}
},
xAxis: [
{
min: value => (value?.min - 0.1).toFixed(1),
max: value => (value?.max + 0.1).toFixed(1),
name: "longitude",
axisLabel: {
formatter: function (value, index) {
return value.toFixed(1) + '°';
}
},
minorTick: {
show: true
},
minorSplitLine: {
show: true
}
},
{
min: value => (value?.min - 0.1).toFixed(1),
max: value => (value?.max + 0.1).toFixed(1),
minInterval: 0.0000001,
maxInterval: 10,
}
],
yAxis: [
{
min: value => (value?.min - 0.1).toFixed(1),
max: value => (value?.max + 0.1).toFixed(1),
name: "Latitude",
axisLabel: {
formatter: function (value, index) {
return value.toFixed(1) + '°';
}
},
minorSplitLine: {
show: true,
}
},
{
min: value => (value?.min - 0.1).toFixed(1),
max: value => (value?.max + 0.1).toFixed(1),
minInterval: 0.0000001,
maxInterval: 10,
}
],
series: [
{
data: dataset,
type: 'line'
}
]
};

### Expected Behavior

As shown in the figure above, the three points can be distinguished by the decimal point to distinguish the slight difference
### Environment
````markdown
- OS:window7
- Browser: Chrome version 91.0.4472.106 (official version) (64-bit)
- Framework:react "^17.0.2"
````
### Any additional comments?
_No response_
</details>
--
This is an automated message from the Apache Git Service.
To respond to the message, please log on to GitHub and use the
URL above to go to the specific comment.
To unsubscribe, e-mail: commits-unsubscribe@echarts.apache.org
For queries about this service, please contact Infrastructure at:
users@infra.apache.org
---------------------------------------------------------------------
To unsubscribe, e-mail: commits-unsubscribe@echarts.apache.org
For additional commands, e-mail: commits-help@echarts.apache.org