You are viewing a plain text version of this content. The canonical link for it is here.
Posted to dev@echarts.apache.org by GitBox <gi...@apache.org> on 2018/05/31 09:30:24 UTC
[GitHub] bummm26 opened a new issue #8441: xAxis ticks disappappear when set
negative min Yaxis value.
bummm26 opened a new issue #8441: xAxis ticks disappappear when set negative min Yaxis value.
URL: https://github.com/apache/incubator-echarts/issues/8441
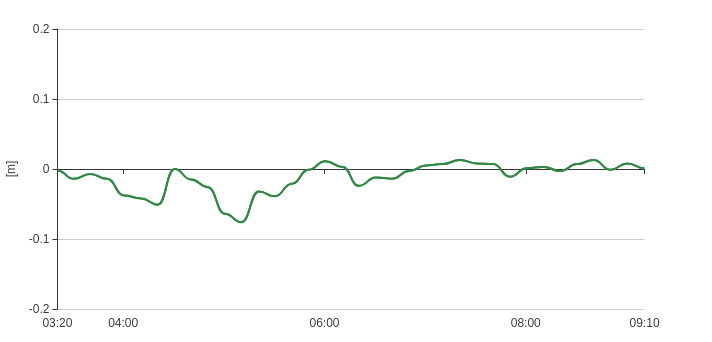
When I set negative min. value at yAxis value the xAxis ticks disappear. I attach a picture.
**Here is the wrong chart with negativr axes.**
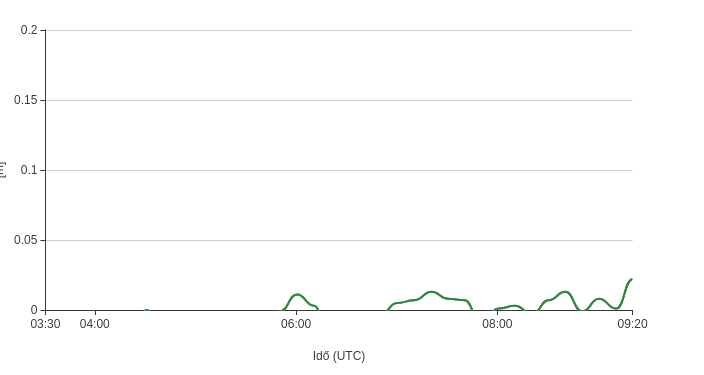
**Here with just postive values:**
----------------------------------------------------------------
This is an automated message from the Apache Git Service.
To respond to the message, please log on GitHub and use the
URL above to go to the specific comment.
For queries about this service, please contact Infrastructure at:
users@infra.apache.org
With regards,
Apache Git Services
---------------------------------------------------------------------
To unsubscribe, e-mail: dev-unsubscribe@echarts.apache.org
For additional commands, e-mail: dev-help@echarts.apache.org