You are viewing a plain text version of this content. The canonical link for it is here.
Posted to commits@echarts.apache.org by GitBox <gi...@apache.org> on 2019/12/18 15:29:53 UTC
[GitHub] [incubator-echarts] Zigotote opened a new issue #11868: Overlay
data from different periods in a line graph
Zigotote opened a new issue #11868: Overlay data from different periods in a line graph
URL: https://github.com/apache/incubator-echarts/issues/11868
### What problem does this feature solve?
**My context :**
Every day, some statistics are calculated about the use of our applications.
**My needs :**
- I would like to be able to show the statistics from a period (for exemple the current year) --> done with a line graph
- I would like to be able to add an other time period to my graph, to be able to compare the data between two (or more) different time periods. It could allow my team to predict how our applications will be used, and on wich projects we should be more focus depending on the past years' statistics.
**Why is it usefull ?**
Being able to superimpose data can be usefull in many other cases, if the user wants to compare data over several time period.
**How should the graph look like ?**
I tried to do this on my own, while using a lot "formatter" methods but it is really hard and the rendering can be quite slow. On the top of this, catching every interactions between the user and the graph isn't always possible.
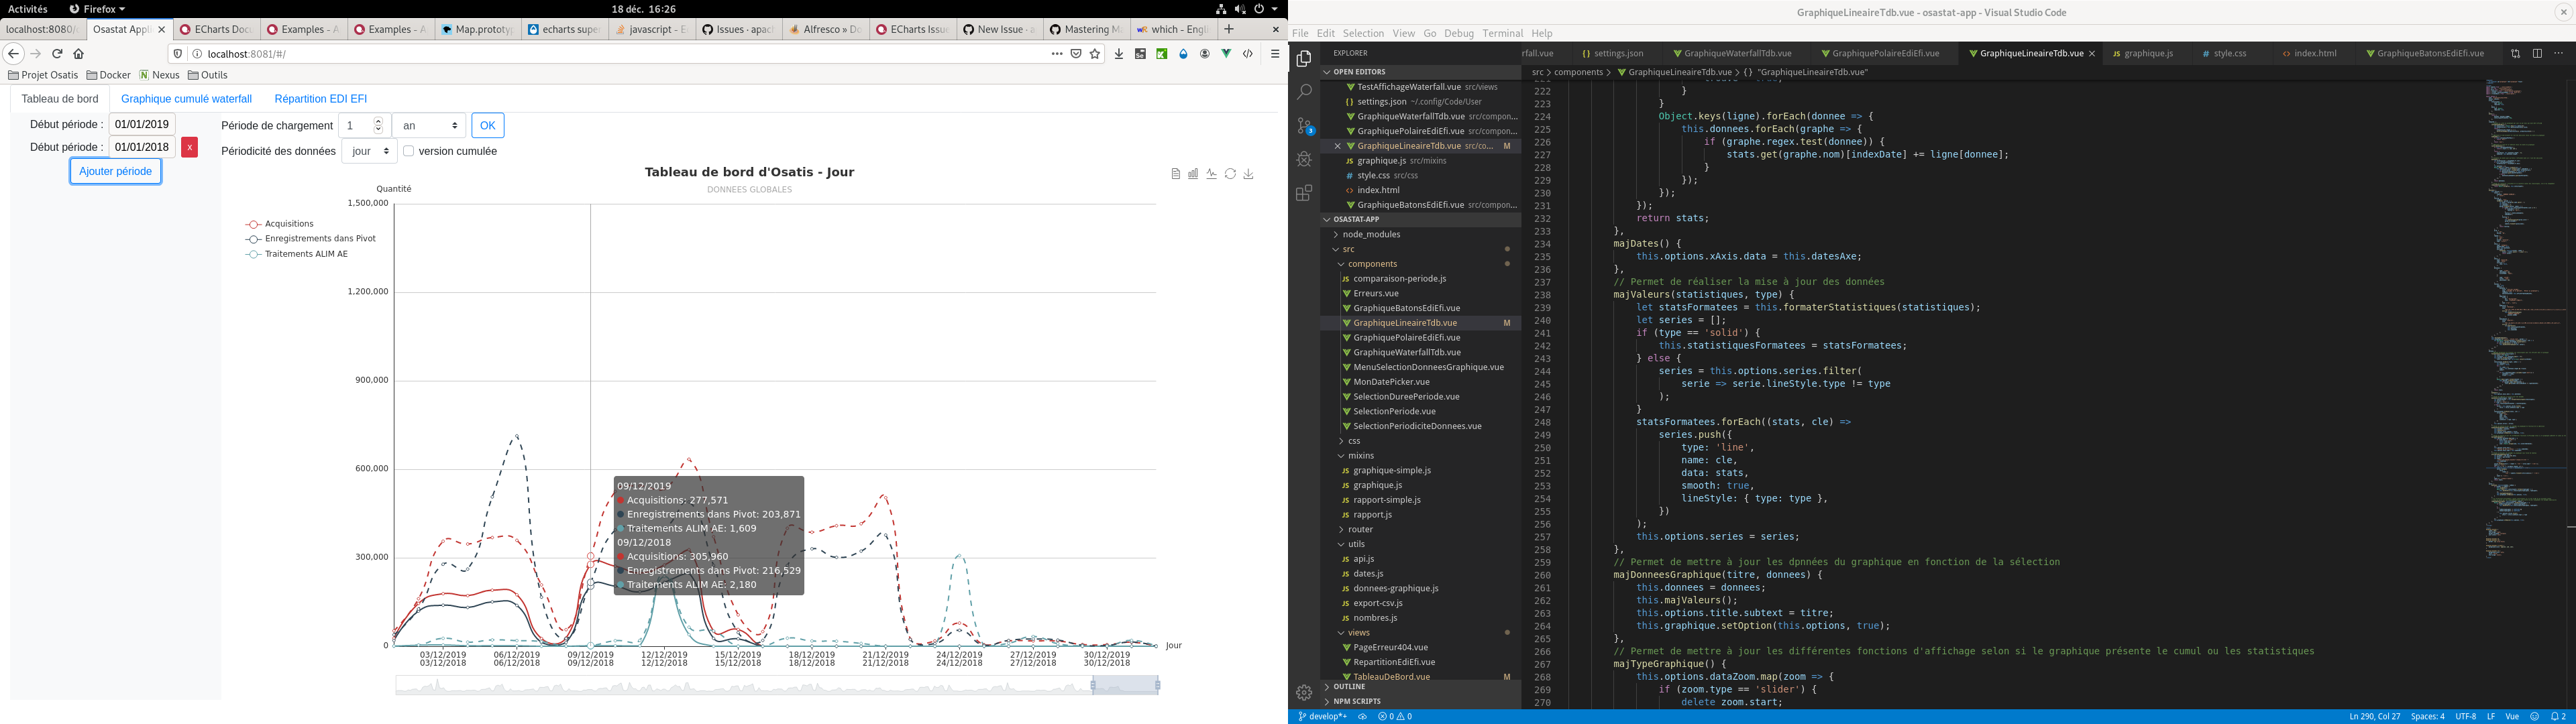
But my idea is to put a different lineStyle for every period we want to add (the first one is solid, the second dashed and the third dotted). Then, every time periods should be added on the xAxis, one above the other, so that we can easily see where which day is displayed. Maybe it could be great to adapt the text style of each period to the corresponding lineStyle (by underlining it for example ?). Then, the tooltips should be corrected to, in order to know which value corresponds to which date.
This is a screenshot of what I am trying to explain :
### What does the proposed API look like?
The proposed API could look like that :
```json
let options = {
xAxis: {
data: { list_1, list_2 }
},
series: [
{
type: 'line',
name: 'whatever',
data: list_whatever1,
overlay: 0
},
{
type: 'line',
name: 'whatever',
data: list_whatever2,
overlay: 1
}
]
}
```
With the "overlay" attribute saying to which xAxis data list the line is bounded to.
<!-- This issue is generated by echarts-issue-helper. DO NOT REMOVE -->
<!-- This issue is in English. DO NOT REMOVE -->
----------------------------------------------------------------
This is an automated message from the Apache Git Service.
To respond to the message, please log on to GitHub and use the
URL above to go to the specific comment.
For queries about this service, please contact Infrastructure at:
users@infra.apache.org
With regards,
Apache Git Services
---------------------------------------------------------------------
To unsubscribe, e-mail: commits-unsubscribe@echarts.apache.org
For additional commands, e-mail: commits-help@echarts.apache.org
[GitHub] [echarts] github-actions[bot] commented on issue #11868: Overlay data from different periods in a line graph
Posted by GitBox <gi...@apache.org>.
github-actions[bot] commented on issue #11868:
URL: https://github.com/apache/echarts/issues/11868#issuecomment-1007739554


   This issue has been automatically marked as stale because it did not have recent activity. It will be closed in 7 days if no further activity occurs. If you wish not to mark it as stale, please leave a comment in this issue.


--
This is an automated message from the Apache Git Service.
To respond to the message, please log on to GitHub and use the
URL above to go to the specific comment.

To unsubscribe, e-mail: commits-unsubscribe@echarts.apache.org

For queries about this service, please contact Infrastructure at:
users@infra.apache.org


---------------------------------------------------------------------
To unsubscribe, e-mail: commits-unsubscribe@echarts.apache.org
For additional commands, e-mail: commits-help@echarts.apache.org
[GitHub] [incubator-echarts] Zigotote commented on issue #11868: Overlay
data from different periods in a line graph
Posted by GitBox <gi...@apache.org>.
Zigotote commented on issue #11868: Overlay data from different periods in a line graph
URL: https://github.com/apache/incubator-echarts/issues/11868#issuecomment-571926982


   Hi @deqingli, its seems indeed quite interesting to me ! How could I join you to discuss more about that ?

----------------------------------------------------------------
This is an automated message from the Apache Git Service.
To respond to the message, please log on to GitHub and use the
URL above to go to the specific comment.

For queries about this service, please contact Infrastructure at:
users@infra.apache.org


With regards,
Apache Git Services

---------------------------------------------------------------------
To unsubscribe, e-mail: commits-unsubscribe@echarts.apache.org
For additional commands, e-mail: commits-help@echarts.apache.org
[GitHub] [echarts] github-actions[bot] commented on issue #11868: Overlay data from different periods in a line graph
Posted by GitBox <gi...@apache.org>.
github-actions[bot] commented on issue #11868:
URL: https://github.com/apache/echarts/issues/11868#issuecomment-1013753889


   This issue has been automatically closed because it did not have recent activity. If this remains to be a problem with the latest version of Apache ECharts, please open a new issue and link this to it. Thanks!


--
This is an automated message from the Apache Git Service.
To respond to the message, please log on to GitHub and use the
URL above to go to the specific comment.

To unsubscribe, e-mail: commits-unsubscribe@echarts.apache.org

For queries about this service, please contact Infrastructure at:
users@infra.apache.org


---------------------------------------------------------------------
To unsubscribe, e-mail: commits-unsubscribe@echarts.apache.org
For additional commands, e-mail: commits-help@echarts.apache.org
[GitHub] [incubator-echarts] deqingli commented on issue #11868: Overlay
data from different periods in a line graph
Posted by GitBox <gi...@apache.org>.
deqingli commented on issue #11868: Overlay data from different periods in a line graph
URL: https://github.com/apache/incubator-echarts/issues/11868#issuecomment-568870356


   hi @Zigotote, thanks a lot for such a detailed suggestion, in version 5.0 we consider adding some data analysis related features. If you are interested, you can join us to discuss or develop together. At that time, I will organize the current plan into an issue.

----------------------------------------------------------------
This is an automated message from the Apache Git Service.
To respond to the message, please log on to GitHub and use the
URL above to go to the specific comment.

For queries about this service, please contact Infrastructure at:
users@infra.apache.org


With regards,
Apache Git Services

---------------------------------------------------------------------
To unsubscribe, e-mail: commits-unsubscribe@echarts.apache.org
For additional commands, e-mail: commits-help@echarts.apache.org
[GitHub] [echarts] github-actions[bot] closed issue #11868: Overlay data from different periods in a line graph
Posted by GitBox <gi...@apache.org>.
github-actions[bot] closed issue #11868:
URL: https://github.com/apache/echarts/issues/11868


--
This is an automated message from the Apache Git Service.
To respond to the message, please log on to GitHub and use the
URL above to go to the specific comment.

To unsubscribe, e-mail: commits-unsubscribe@echarts.apache.org

For queries about this service, please contact Infrastructure at:
users@infra.apache.org


---------------------------------------------------------------------
To unsubscribe, e-mail: commits-unsubscribe@echarts.apache.org
For additional commands, e-mail: commits-help@echarts.apache.org