You are viewing a plain text version of this content. The canonical link for it is here.
Posted to notifications@superset.apache.org by GitBox <gi...@apache.org> on 2022/11/08 10:10:23 UTC
[GitHub] [superset] GerbenvdHuizen opened a new issue, #22061: Plotting data with different time granularity in a time series line chart does not always render the lines
GerbenvdHuizen opened a new issue, #22061:
URL: https://github.com/apache/superset/issues/22061
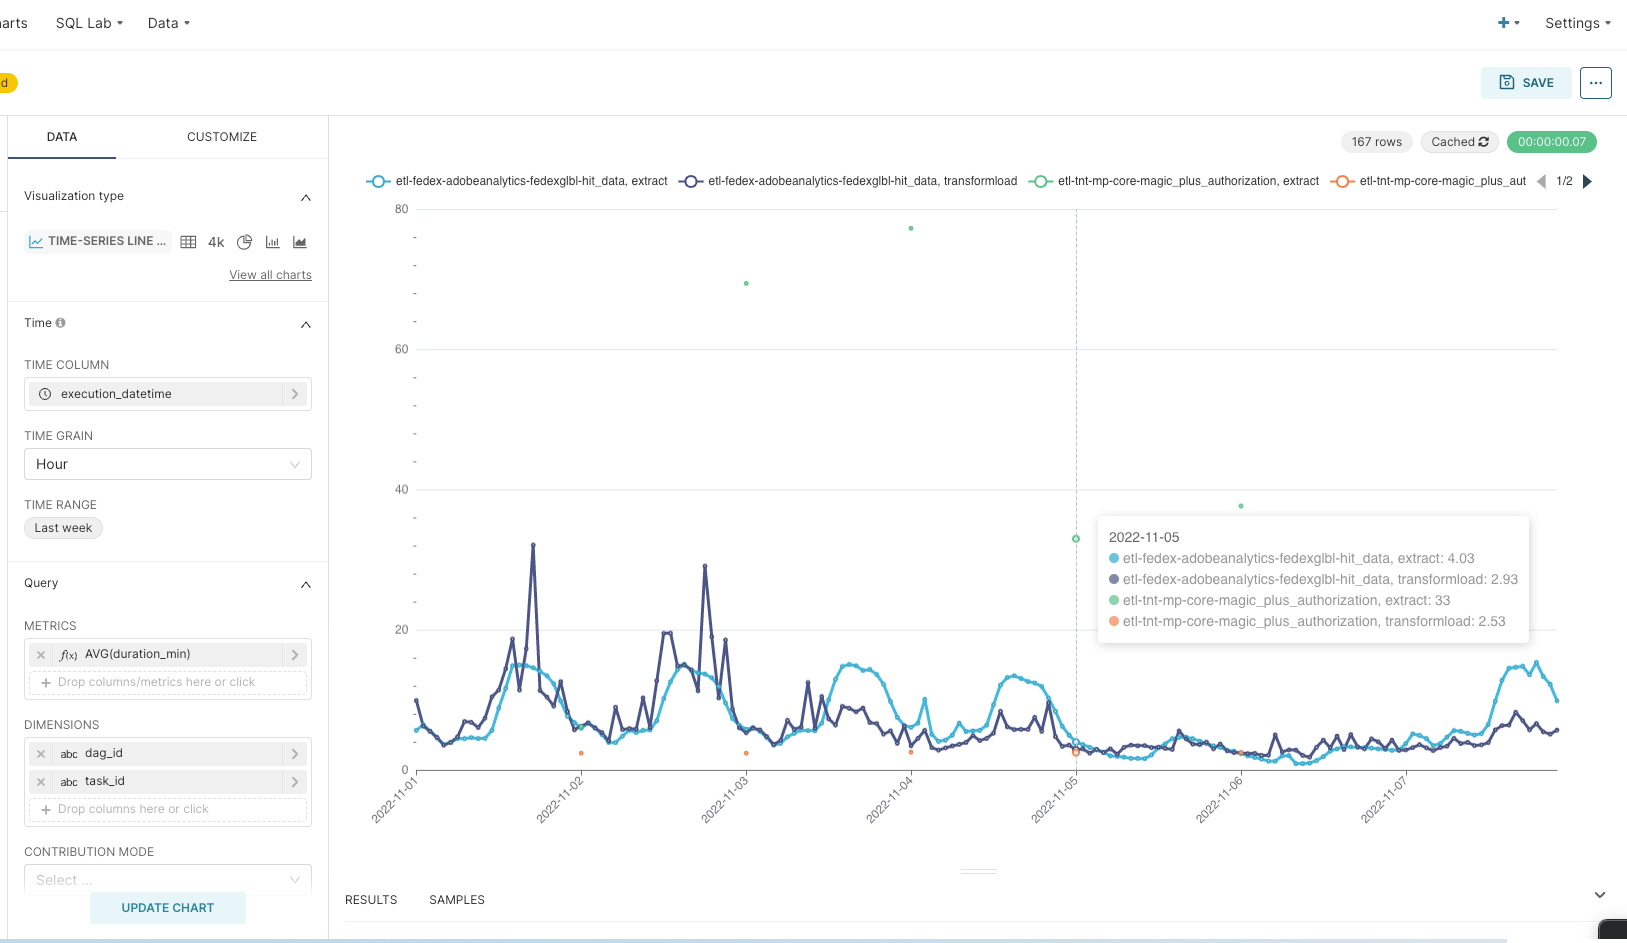
When plotting data with hourly and daily granularity in a timeseries line chart, the lines of daily data will not render when the time grain of the chart is set to hourly. This makes it difficult to compare daily and hourly data in the same chart. We would expect to at least have an option to render lines between existing data points, despite what time grain is set.
In the example screenshot you can see the time grain is set to hourly, so the daily data points do not have a drawn/rendered line.
#### How to reproduce the bug
1. Create a chart timeseries line chart with both daily and hourly data (granularity).
2. Set time grain of the chart to hourly
3. The chart will only plot lines for the hourly data, and show only data points for the daily data.
### Expected results
Have an option to draw/render lines between data points despite what time grain is currently set on a graph
### Actual results
If time grain is set for example to hourly, the chart will only render lines for hourly data not for daily (or weekly, monthly etc.).
#### Screenshots
### Environment
- Superset version: 2.0.0 (we're using the `apache/superset:2.0.0` Docker image)
- In case it matters we're using Spark Thriftserver as our SQL engine
```
FEATURE_FLAGS = {
"SQLLAB_BACKEND_PERSISTENCE": True,
"ENABLE_TEMPLATE_PROCESSING": True,
"ENABLE_TEMPLATE_REMOVE_FILTERS": True,
}
```
### Checklist
- [x] I have checked the superset logs for python stacktraces and included it here as text if there are any.
- [x] I have reproduced the issue with at least the latest released version of superset.
- [x] I have checked the issue tracker for the same issue and I haven't found one similar.
--
This is an automated message from the Apache Git Service.
To respond to the message, please log on to GitHub and use the
URL above to go to the specific comment.
To unsubscribe, e-mail: notifications-unsubscribe@superset.apache.org.apache.org
For queries about this service, please contact Infrastructure at:
users@infra.apache.org
---------------------------------------------------------------------
To unsubscribe, e-mail: notifications-unsubscribe@superset.apache.org
For additional commands, e-mail: notifications-help@superset.apache.org
[GitHub] [superset] ashgorithm commented on issue #22061: Plotting data with different time granularity in a time series line chart does not always render the lines
Posted by "ashgorithm (via GitHub)" <gi...@apache.org>.
ashgorithm commented on issue #22061:
URL: https://github.com/apache/superset/issues/22061#issuecomment-1436402537

   This is similar to this issue:
   https://github.com/apache/superset/issues/4257

   When there is missing data then the line is not continuous. For the line to be smooth, you need to use resample option in advanced Analytics section.


--
This is an automated message from the Apache Git Service.
To respond to the message, please log on to GitHub and use the
URL above to go to the specific comment.

To unsubscribe, e-mail: notifications-unsubscribe@superset.apache.org

For queries about this service, please contact Infrastructure at:
users@infra.apache.org


---------------------------------------------------------------------
To unsubscribe, e-mail: notifications-unsubscribe@superset.apache.org
For additional commands, e-mail: notifications-help@superset.apache.org
[GitHub] [superset] Shazad-khan commented on issue #22061: Plotting data with different time granularity in a time series line chart does not always render the lines
Posted by "Shazad-khan (via GitHub)" <gi...@apache.org>.
Shazad-khan commented on issue #22061:
URL: https://github.com/apache/superset/issues/22061#issuecomment-1471707205

   https://www.loom.com/share/1e0b3f96326548cd8980309da3c1845c

   It is not a bug it's working as expected


--
This is an automated message from the Apache Git Service.
To respond to the message, please log on to GitHub and use the
URL above to go to the specific comment.

To unsubscribe, e-mail: notifications-unsubscribe@superset.apache.org

For queries about this service, please contact Infrastructure at:
users@infra.apache.org


---------------------------------------------------------------------
To unsubscribe, e-mail: notifications-unsubscribe@superset.apache.org
For additional commands, e-mail: notifications-help@superset.apache.org
Re: [I] Plotting data with different time granularity in a time series line chart does not always render the lines [superset]
Posted by "rusackas (via GitHub)" <gi...@apache.org>.
rusackas closed issue #22061: Plotting data with different time granularity in a time series line chart does not always render the lines
URL: https://github.com/apache/superset/issues/22061


--
This is an automated message from the Apache Git Service.
To respond to the message, please log on to GitHub and use the
URL above to go to the specific comment.

To unsubscribe, e-mail: notifications-unsubscribe@superset.apache.org

For queries about this service, please contact Infrastructure at:
users@infra.apache.org


---------------------------------------------------------------------
To unsubscribe, e-mail: notifications-unsubscribe@superset.apache.org
For additional commands, e-mail: notifications-help@superset.apache.org