You are viewing a plain text version of this content. The canonical link for it is here.
Posted to notifications@apisix.apache.org by ju...@apache.org on 2021/11/04 06:34:24 UTC
[apisix-website] branch master updated: docs: added skywalking blog
(#706)
This is an automated email from the ASF dual-hosted git repository.
juzhiyuan pushed a commit to branch master
in repository https://gitbox.apache.org/repos/asf/apisix-website.git
The following commit(s) were added to refs/heads/master by this push:
new 9bbf19b docs: added skywalking blog (#706)
9bbf19b is described below
commit 9bbf19baf24d3a23daf07955266da528837c7070
Author: lijing-21 <88...@users.noreply.github.com>
AuthorDate: Thu Nov 4 14:34:18 2021 +0800
docs: added skywalking blog (#706)
---
website/blog/2021/11/04/skywalking.md | 104 +++++++++++++++++++++
.../2021/11/04/skywalking.md | 104 +++++++++++++++++++++
2 files changed, 208 insertions(+)
diff --git a/website/blog/2021/11/04/skywalking.md b/website/blog/2021/11/04/skywalking.md
new file mode 100644
index 0000000..85d6197
--- /dev/null
+++ b/website/blog/2021/11/04/skywalking.md
@@ -0,0 +1,104 @@
+---
+title: "The observability of Apache APISIX"
+author: "Haochao Zhuang"
+authorURL: "https://github.com/dmsolr"
+authorImageURL: "https://avatars.githubusercontent.com/u/29735230?v=4"
+keywords:
+- Apache APISIX
+- observability
+- SkyWalking
+- Apache
+- Prometheus
+description: This article introduces the observability capabilities of Apache APISIX and how to improve the observability capabilities of Apache APISIX through Apache SkyWalking.
+tags: [Technology]
+---
+
+> This article introduces the observability capabilities of Apache APISIX and how to improve the observability capabilities of Apache APISIX through Apache SkyWalking.
+
+<!--truncate-->
+
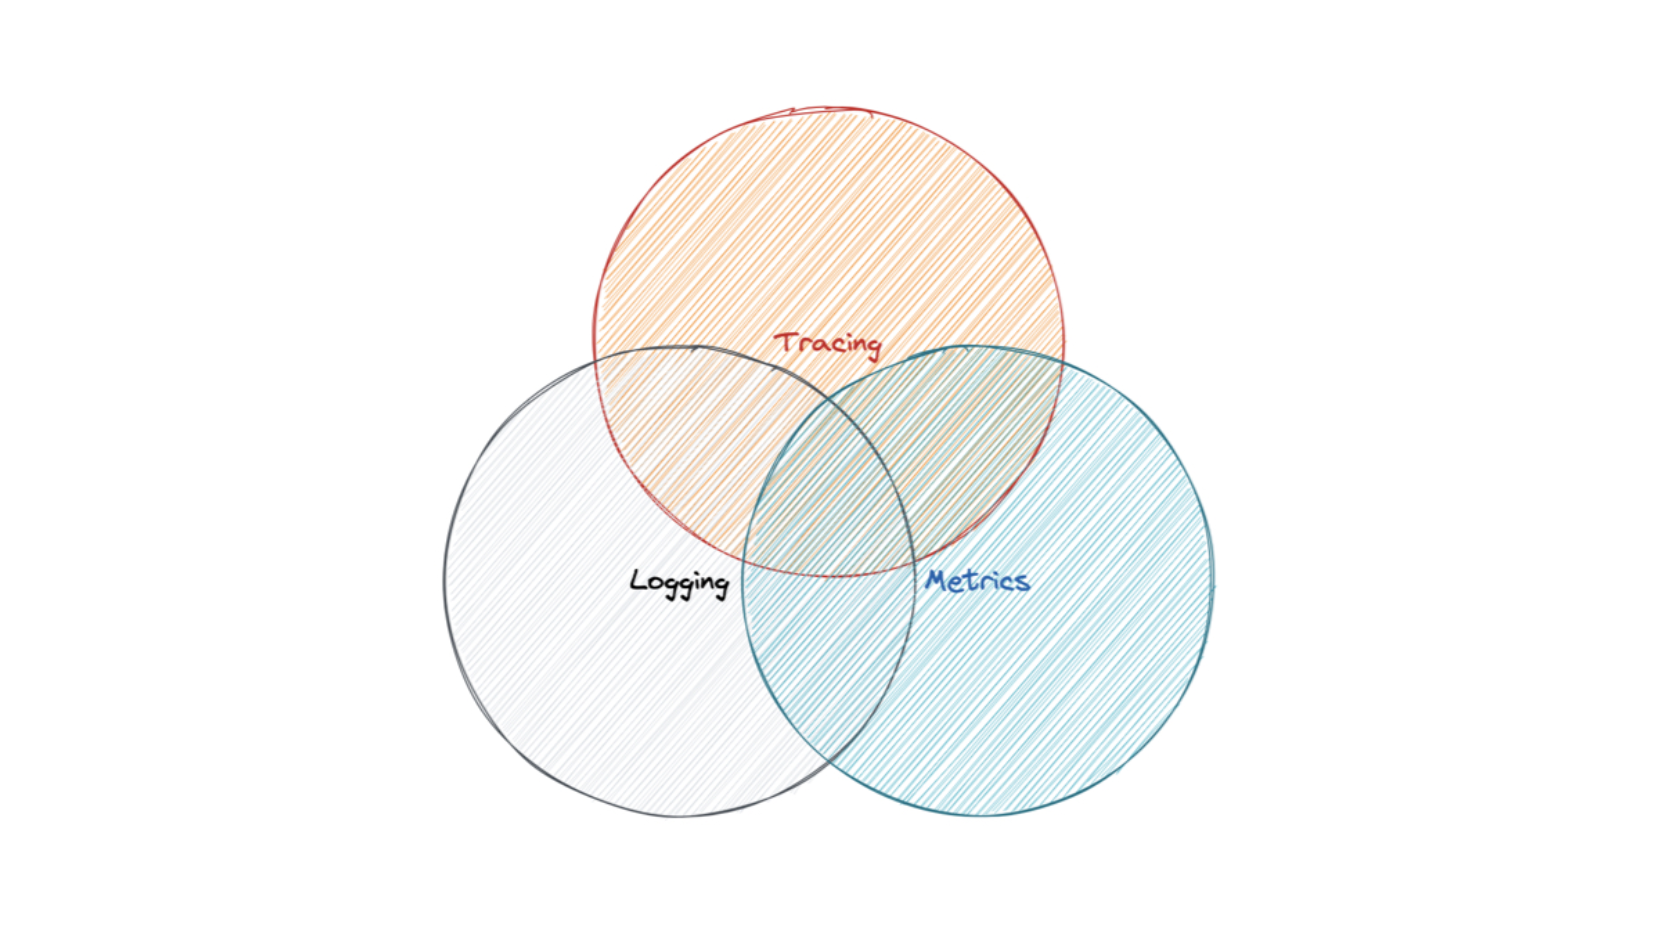
+Observability is the ability to observe the runtime state and resource usage of the internal program of the system from the outside of the system. The main measures of observability are Metrics, Logging, and Tracing, and the following diagram shows the relationship between Metrics, Logging, and Tracing.
+
+
+
+For example, the overlap between Tracing and Logging represents the logs generated by Tracing at the request level, and the Tracing ID is used to associate Tracing and Logging. After performing certain aggregation operations on this log, some Metrics can be obtained. Tracing itself also generates some Metrics, such as the relationship between the call volume.
+
+## Observability Capabilities of Apache APISIX
+
+Apache APISIX has comprehensive observability capabilities: support for Tracing and Metrics, a rich ecosystem of Logging plug-ins, and support for querying node status.
+
+### Tracing
+
+Apache APISIX supports a variety of Tracing plugins, including: Zipkin, OpenTracing and SkyWalking. Note that: Tracing plug-in is closed by default, you need to manually open Tracing plug-in before use. Tracing plugin needs to be bound to routing or global rules. If there is no requirement for sampling rate, it is recommended to bind to global rules to avoid omissions.
+
+### Metrics
+
+In Apache APISIX, Metrics related information is reported through Prometheus Exporter, which is compatible with the Prometheus data format. There are two things to be aware of when using the Prometheus Plugin in Apache APISIX.
+
+**First, please try to improve the readability of the names of all three - route, service and upstream.**
+
+There is a parameter named `prefer_name` in Prometheus Plugin. When the value of this parameter is set to `true`, that is: `prefer_name: true`. If the names of routing, service and upstream are relatively readable, This will bring some benefits: when you monitor the parameters on the large screen through Grafana, you can not only clearly display all the data, but also clearly know the source of the data. If the value of the `prefer_name` parameter is `false`, only the ID of the resource [...]
+
+**Second, the Prometheus Plugin must be bound to a route or global rule before it can view the metrics of the specified resource.**
+
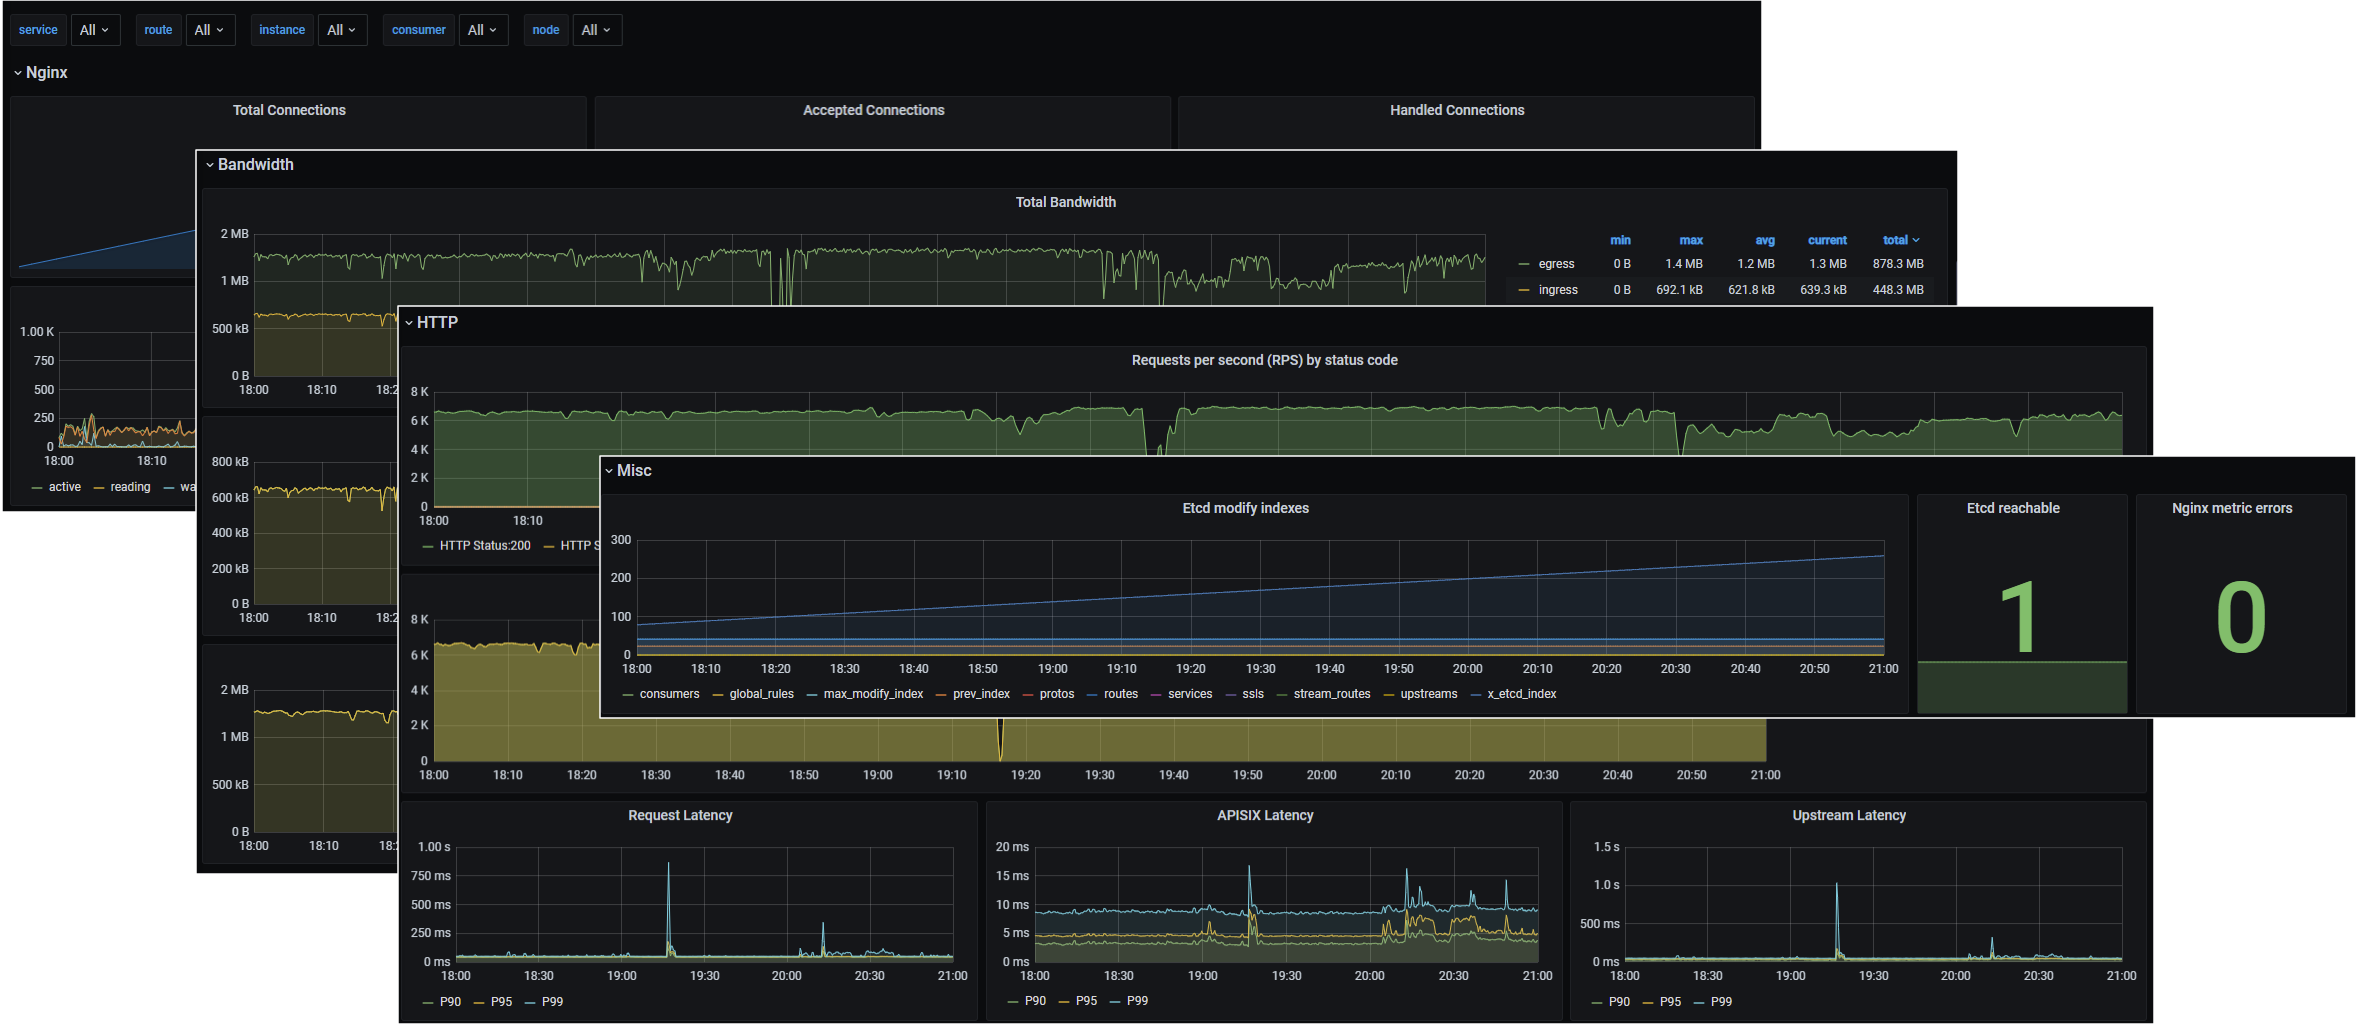
+After the above setup, the Metrics data will be stored in Prometheus. Since Prometheus has good storage performance, but poor display performance, we need to use the Grafana Dashboard to display the data. We can see the Metrics for the Nginx instance, the Metrics for the network bandwidth, the Metrics for the routes and upstream, and more, as shown in the following image.
+
+
+
+### Logging
+
+Apache APISIX supports a variety of logging plugins to share log data directly with other external platforms. The Error Log plug-in supports HTTP and TCP protocols, and is compatible with the log format of SkyWalking. Logs can also be synchronized to logging platforms for processing through log collection components such as FluentBit.
+
+The Access Log plugin does not currently support nesting inside the log format. Because the Access Log plugin is route-level, it needs to be bound to a route in order to collect access logs for the route. However, the log format is global, and there can only be one global log format.
+
+### Support Querying Node Status
+
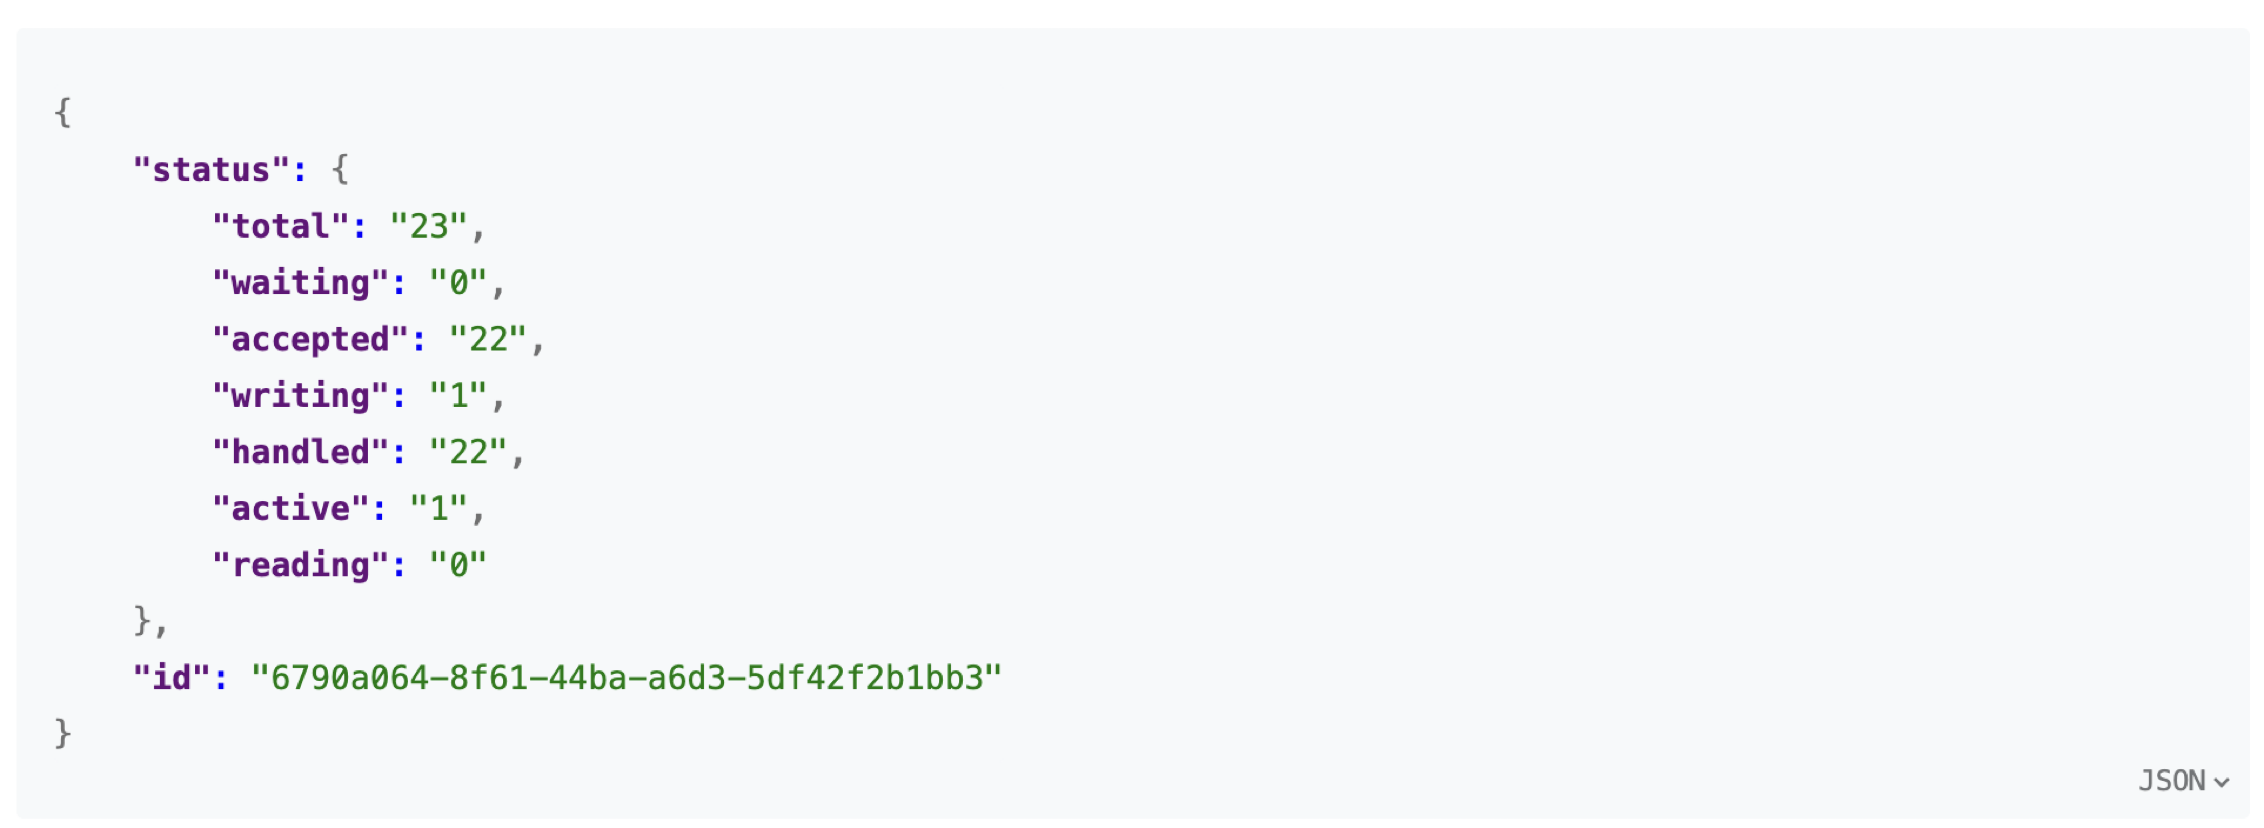
+Apache APISIX supports querying node status. When enabled, information about the nodes can be collected via `/apisix/status`, including the number of nodes, the number of waiting links, the number of connections processed, etc.
+
+
+
+### Pitfalls
+
+As mentioned above, Apache APISIX has a well-established observability capability to collect information such as Metrics, Logging, and Tracing. Although the built-in plug-in of Apache APISIX and Grafana Dashboard can solve the problems of monitoring data collection and indicator visualization, all kinds of data are scattered on various platforms. It is expected that an observability analysis platform can integrate Metrics, Logging, and Tracing information and link all data together.
+
+## Use Apache SkyWalking to Enhance the Observation Capabilities of Apache APISIX
+
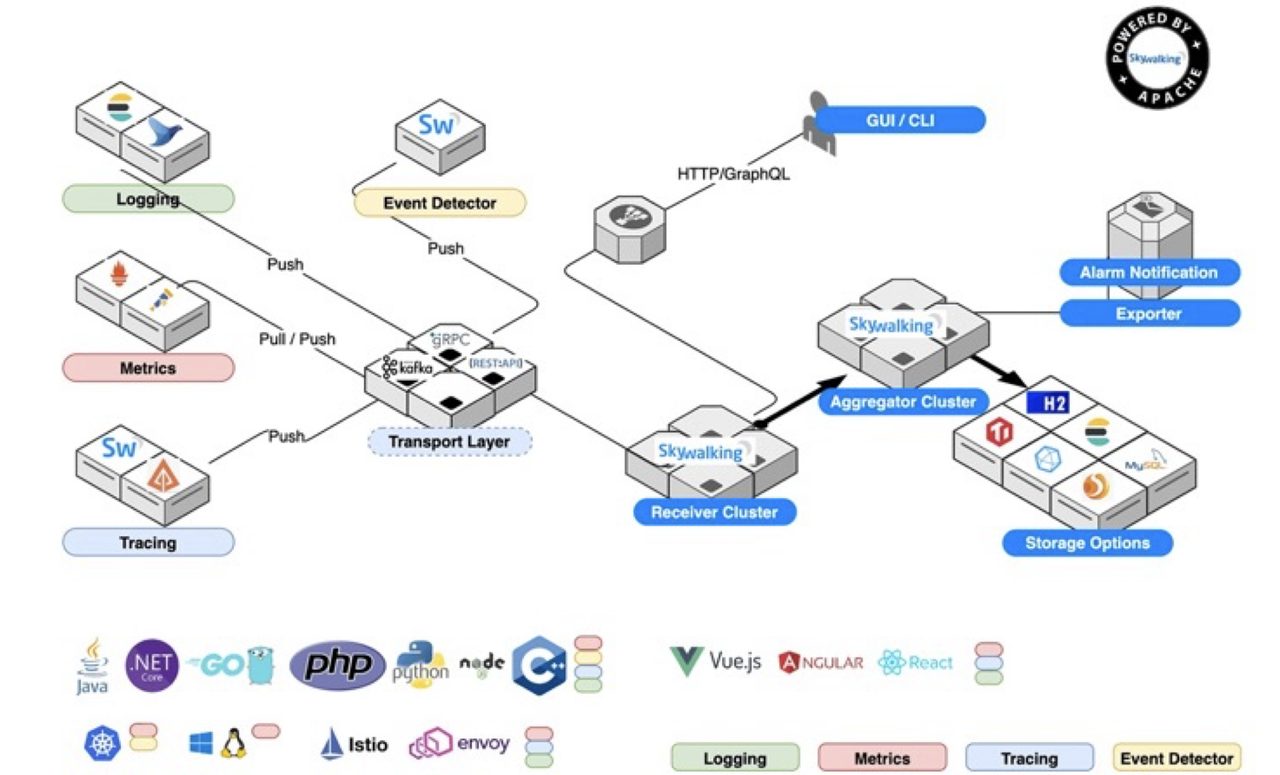
+Apache SkyWalking is an application performance monitoring (APM) and observability analysis platform for distributed systems. It provides multi-dimensional application performance analysis methods, from distributed topology diagrams to application performance indicators, traces, log correlation analysis and alarms.
+
+
+
+### One-stop Data Processing
+
+Apache SkyWalking supports interfacing with Metrics, Logging, Tracing and other monitoring data, compatible with the Prometheus data model, and can also be used to generate new Metrics through secondary aggregation by Log Analysis Language.
+
+### More Detailed Data Presentation
+
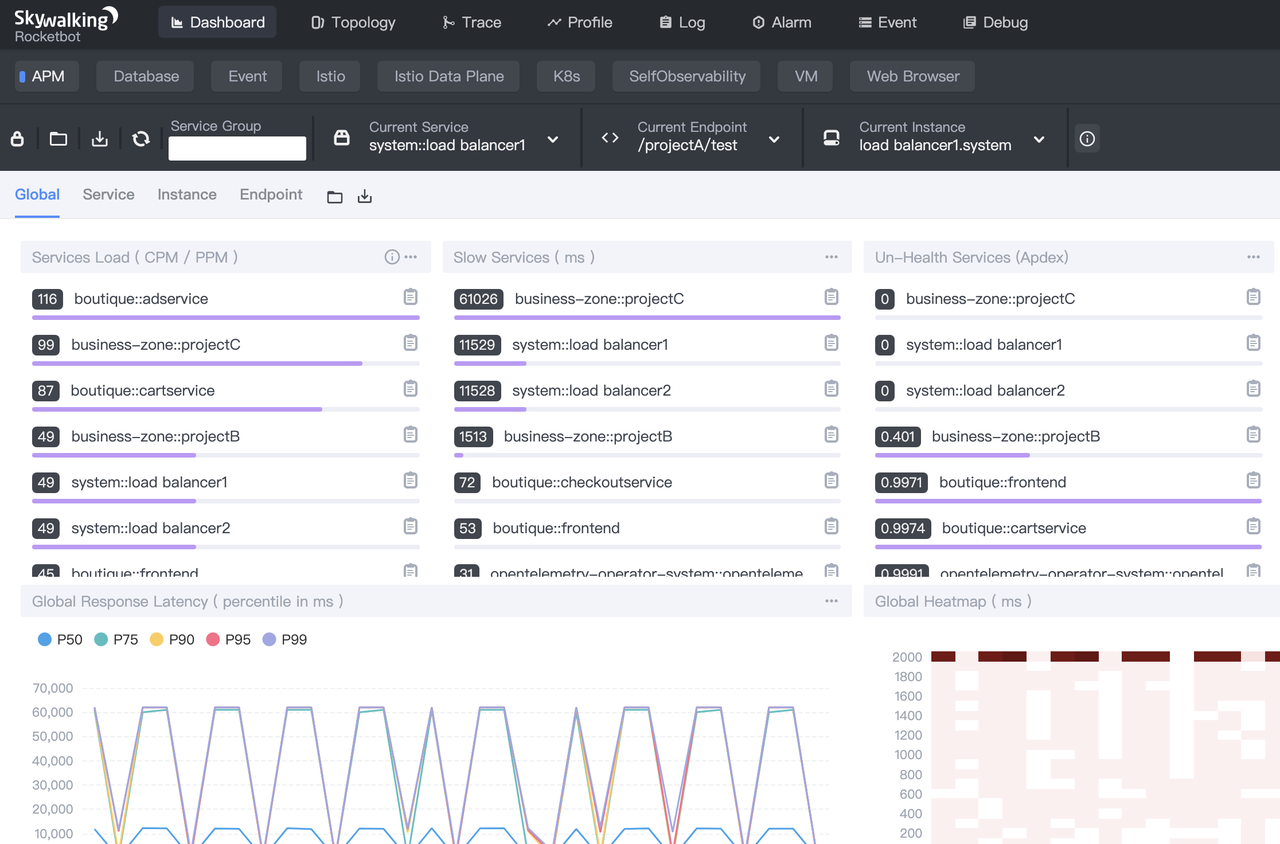
+The Dashboard of Apache SkyWalking is divided into two areas: the upper area for feature selection and the lower area for panel content. The upper part is the feature selection area, and the lower part is the content of the dashboard, which provides Metrics related information in multiple entity dimensions, such as Global, Service, Example, Endpoint, etc., and supports different views to show the observability. Take the global view as an example, the displayed Metrics include: service lo [...]
+
+
+
+Another thing worth mentioning is the Trace view of SkyWalking Dashboard. SkyWalking provides 3 display forms: list, tree diagram and table. Trace view is a typical view of distributed tracing. These views allow users to view trace data from different angles, especially the time-consuming relationship between spans.
+
+SkyWalking Dashboard also supports topology diagrams. The topology diagram is the overall topology structure analyzed based on the probe uplink data. The topology diagram supports clicking to show and drill down the performance statistics, tracing, and alerts of individual services, and you can also click on the relationship lines in the topology diagram to show the performance Metrics between services and between service examples.
+
+### Support Containerized Deployments
+
+Kubernetes is an open source cloud-native containerized cluster management platform that aims to make deploying containerized applications simple and efficient. The Apache SkyWalking backend can be deployed in Kubernetes, and thanks to the efficient management of Kubernetes, high availability of UI components can be guaranteed.
+
+If Apache APISIX is deployed on a cluster, Apache SkyWalking supports the deployment of SkyWalking Satellite in the form of sidecar or service discovery to monitor Apache APISIX in the cluster.
+
+## Future Plans
+
+Apache APISIX will continue to enhance observability-related feature support in the future, such as
+
+1. Solve the problem of missing peer of SkyWalking Nginx-Lua plugin
+
+2. Support printing trace id in the log
+
+3. Access to the access log
+
+4. Support gateway metadata
+
+## Conclusion
+
+This article introduces the observability capabilities of Apache APISIX and how Apache SkyWalking can enhance the observability capabilities of Apache APISIX. The two communities will continue to work together to further enhance the observability of Apache APISIX in the future. We hope you can get more involved in the Apache APISIX and Apache SkyWalking projects. If you are interested in these two open source projects but are not familiar with the code, writing articles, making videos, s [...]
diff --git a/website/i18n/zh/docusaurus-plugin-content-blog/2021/11/04/skywalking.md b/website/i18n/zh/docusaurus-plugin-content-blog/2021/11/04/skywalking.md
new file mode 100644
index 0000000..cffebfa
--- /dev/null
+++ b/website/i18n/zh/docusaurus-plugin-content-blog/2021/11/04/skywalking.md
@@ -0,0 +1,104 @@
+---
+title: "浅谈 Apache APISIX 的可观测性"
+author: "庄浩潮"
+authorURL: "https://github.com/dmsolr"
+authorImageURL: "https://avatars.githubusercontent.com/u/29735230?v=4"
+keywords:
+- Apache APISIX
+- 可观测性
+- SkyWalking
+- Apache
+- Prometheus
+description: 本文介绍了 Apache APISIX 的可观测性能力以及如何通过 Apache SkyWalking 提升Apache APISIX 的可观测性能力。
+tags: [Technology]
+---
+
+> 本文介绍了 Apache APISIX 的可观测性能力以及如何通过 Apache SkyWalking 提升Apache APISIX 的可观测性能力。
+
+<!--truncate-->
+
+可观测性是从系统外部去观察系统内部程序的的运行时状态和资源使用情况。衡量可观测性的主要手段包括:Metrics、Logging 和 Tracing,下图是 Metrics、Logging 和 Tracing 之间的关系。
+
+
+
+举个例子,Tracing 和 Logging 重合的部分代表的是 Tracing 在 request 级别产生的日志,并通过 Tracing ID 将 Tracing 和 Logging 关联起来。对这份日志进行一定的聚合运算之后,能够得到一些 Metrics。Tracing 自身也会产生一些 Metrics,例如调用量之间的关系。
+
+## Apache APISIX 的可观测性能力
+
+Apache APISIX 拥有完善的可观测性能力:支持 Tracing 和 Metrics、拥有丰富的 Logging 插件生态、支持查询节点状态。
+
+### Tracing
+
+Apache APISIX 支持多种 Tracing 插件,包括:Zipkin、OpenTracing 和 SkyWalking。需要注意是: Tracing 插件默认处于关闭状态,使用前需要手动开启 Tracing 插件;Tracing 插件需要与路由或全局规则绑定,如果没有采样率的要求,建议与全局规则绑定,这样可以避免遗漏。
+
+### Metrics
+
+在 Apache APISIX 中, Metrics 的相关信息通过 Prometheus Exporter上报,兼容 Prometheus 的数据格式。在 Apache APISIX 中使用 Prometheus Plugin 有两件事情需要注意。
+
+**第一,请尽量提高路由、服务和上游这三者名称的可读性。**
+
+Prometheus Plugin 中有一个名为 `prefer_name` 的参数,将这个参数的值设置为 `true` 时,即:`prefer_name: true`,如果路由、服务和上游这三者的名称可读性比较强,这会带来一些好处:后续通过 Grafana 监控大屏展示参数的时候,不仅能够清楚地展示出所有的数据,还能够清晰地知晓这些数据的来源。如果 `prefer_name` 参数的值为 `false`,则只会展示资源的 ID 作为数据来源,例如 路由 ID、上游 ID,进而造成监控大屏的可读性较低的问题。
+
+**第二,Prometheus Plugin 必须与路由或者全局规则绑定,然后才可以查看到指定资源的 Metrics。**
+
+完成上述设置以后,Metrics 的数据会存储在 Prometheus 里面。由于 Prometheus 的存储性能很好,但展示性能欠佳,所以我们需要借助 Grafana Dashboard 展示数据。我们可以看到 Nginx 实例的 Metrics、网络带宽的 Metrics、路由和上游的 Metrics 等,详情如下图所示:
+
+
+
+### Logging
+
+Apache APISIX 支持多种日志插件,可以与其他外部的平台直接分享日志数据。Error Log 插件支持 HTTP 与 TCP 协议,并且兼容 SkyWalking 的日志格式。也可以通过 FluentBit 等日志收集组件,将日志同步到日志平台进行处理。
+
+Access Log 插件目前还不支持在日志格式里面进行嵌套。因为 Access Log 插件是路由级别的,所以需要跟路由进行绑定,才可以收集到路由的访问日志。但是日志的格式是全局的,而全局只能有一份日志格式。
+
+### 支持查询节点状态
+
+Apache APISIX 的支持查询节点状态,启用之后,可以通过 `/apisix/status` 收集到节点的信息,包括节点数、等待链接数、处理连接数等。
+
+
+
+### 美中不足
+
+上文讲到,Apache APISIX 的可观测性能力非常完善,能够收集 Metrics、Logging 和 Tracing 等信息。虽然借助 Apache APISIX 的内置插件配合 Grafana Dashboard,能够解决监控数据收集和指标可视化问题,但是各种数据分散在各个平台。期望有一个可观测性分析平台能集成 Metrics、Logging、Tracing 信息,能够将所有数据联动起来。
+
+## 使用 Apache SkyWalking 增强 Apache APISIX 的观测能力
+
+Apache SkyWalking 是一个针对分布式系统的应用性能监控(APM)和可观测性分析平台。它提供了多维度应用性能分析手段,从分布式拓扑图到应用性能指标、Trace、日志的关联分析与告警。
+
+
+
+### 一站式数据处理
+
+Apache SkyWalking 支持对接 Metrics、Logging、Tracing 等多种监控数据,兼容 Prometheus 数据模型,还可以通过 Log Analysis Language 进行二次聚合,产生新的 Metrics。
+
+### 更详细的数据展示
+
+Apache SkyWalking 的 Dashboard 分为上下两个区域。上部是功能选择区域,下部是面板内容。Dashboard 提供全局、服务、示例、Endpoint 等多个实体维度的 Metrics 相关信息,支持以不同的视图展示可观测性。以全局视图为例,展示的 Metrics 包括:服务负载、慢服务数量、不健康的服务数量等,如下图所示。
+
+
+
+另外值得一说的是 SkyWalking Dashboard 的 Trace 视图。SkyWalking 提供了 3 种展现形式:列表、树状图和表格。Trace 视图是分布式追踪的典型视图,这些视图允许用户从不同角度查看追踪数据,特别是 Span 间的耗时关系。
+
+SkyWalking Dashboard 也支持拓扑图。拓扑图是根据探针上行数据分析出的整体拓扑结构。拓扑图支持点击展现和下钻单个服务的性能统计、Tracing、告警,也可以点击拓扑图中的关系线,展示服务之间、服务示例间的性能 Metrics。
+
+### 支持容器化部署
+
+Kubernetes 是一个开源的云原生容器化集群管理平台,目标是让部署容器化的应用简单且高效。Apache SkyWalking 后台可以部署在 Kubernetes 之中,而且得益于 Kubernetes 的高效率管理,可以保证 UI 组件的高可用性。
+
+如果在集群上部署了 Apache APISIX,Apache SkyWalking 支持以 sidecar 或服务发现的形式部署 SkyWalking Satellite,监控集群中的 Apache APISIX。
+
+## 未来计划
+
+Apache APISIX 在未来仍会继续加强可观测性相关的功能支持,例如:
+
+1. 解决 SkyWalking Nginx-Lua 插件的 peer 缺失问题
+
+2. 支持在日志中打印 trace id
+
+3. 接入访问日志
+
+4. 支持网关元数据
+
+## 结语
+
+本文介绍了 Apache APISIX 的可观测性能力以及如何通过 Apache SkyWalking 提升Apache APISIX 的可观测性能力。未来两个社区还会继续深度合作,进一步增强 Apache APISIX 的可观测性能力。希望大家能够多多地参与到 Apache APISIX 和 Apache SkyWalking 项目中来。如果你对这两个开源项目很感兴趣,却不熟悉代码,写文章、做视频、对外分享、积极参与社区和邮件列表讨论都是很不错方式。